© 2018, IRJET | Impact Factor value: 6.171 | ISO 9001:2008 Certified Journal | Page 592
IOT in Agriculture
Prashaunsa J. Nachankar
1, Mayur G. Somani
2, Deeksha M. Singh
3, Prof. Sunil N. Katkar
41,2,3,4
Dept. of Computer Engineering, Vidyavardhini’s College of Engineering and Technology, Maharashtra, India.
---***---Abstract -
This project is introduced to demonstrate the useof Internet of Things (IOT) in the field of agriculture. In this project, sensors are used to measure various parameters of the field such as temperature, humidity, soil moisture . This data from the field is collated and stored onto the server. On this available data, analysis is done to calculate the water requirement of a crop. The crop water requirement is calculated by the system using the Penman Monteith algorithm. Based on the soil nitrogen, phosphorous and potassium (NPK) values, the system recommends fertilizers to achieve optimum crop production. The system also generates the irrigation schedule of a crop based on input parameters such as date of sowing, soil moisture percent and calculated water need of the crop. This project is implemented on a local scale where local farmers can utilize this IOT based analytics which provides new insights and improves decision making.
Key Words
: Internet of Things, Penman Monteith,
fertilizer recommendation, irrigation schedule.1. INTRODUCTION
The Internet of Things (IOT) helps various devices and sensors to send data over the internet in a near real time manner. A sensor based system is developed to monitor the field. The conditions of the field can be viewed by the farmers from anywhere. Local farms can utilize this information to quickly analyze the data combined with third party information, such as weather services, to improve decision making [1][2][3].
The crop must be supplied water in proper quantity. Too much water can suffocate the plant roots and too little may not be able to sustain the plants. Identifying the correct crop water requirement is essential. Field data gathered from sensors can help to achieve a high level of accuracy in the calculation of water requirement.
Well-planned irrigation is very critical for obtaining optimal crop yields. For proper irrigation scheduling, sound knowledge of the soil moisture status, crop water requirements, soil density, pH value of soil is prerequisite to maximize profits and optimize the use of water and energy[4][5].
2. RELATED WORK
CropIn Technology Solutions Pvt. Ltd
CropIn provides Farm-Businesses/Growers with farm management software and mobile apps, which enable them
to do connect and data driven farming .The solutions offered by CropIn are:
1. Smart Farm: Make every farm traceable and increase your per acre value.
2. Smart Sales: Increase your sales by more than 15%.
3. mWarehouse: End to end traceability of Inventory and Packhouse.
Their idea is to make every farm and farmer traceable and get information regarding the plot, area, date of plantation, pesticides used, etc. Also to increase per acre value for growers/farmers [6].
SMART!
SMART! Fertilizer Management began its services in 2014, and has made huge strides in production. They provide fertilizer management tools that agriculturalists and farmers can make use of to attain better, high quality yield and effectively decrease their production costs [7].
3. PROPOSED SYSTEM
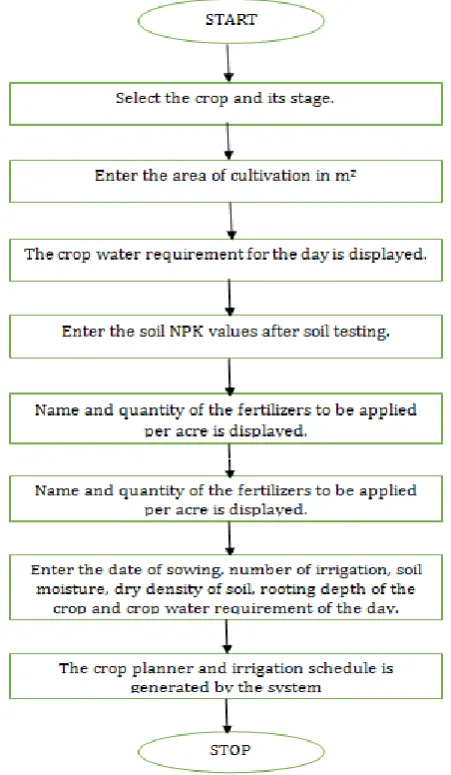
The scope of our project is currently limited to five crops namely wheat, cotton, groundnut, sorghum and rice. Actual working and design of the proposed system, with the help of flow diagram is described and explained in this section. The system consists of three main modules:
1) Calculation of crop water requirement.
2) Fertilizer recommendation based on soil NPK values.
3) Generation of the irrigation schedule.
The first module consists of the following steps:
Select the crop and its stage.
Climate information based on location will be displayed [8].
Input the land available for cultivation for the particular crop in m2.
Based on above input parameters, the crop water requirement is calculated using the Penman Monteith algorithm [9].
a) Penman Monteith:
© 2018, IRJET | Impact Factor value: 6.171 | ISO 9001:2008 Certified Journal | Page 593 1. Effect of climate: Climatic data needed for
this method is temperature, humidity, wind, sunshine hours, and radiation. The wind speed, sunshine hours and radiation values can be obtained from Apixu API for our desired location.
2. Effect of crop characteristics. 3. Effect of local conditions.
The water requirement can be calculated for all stages of the crop, namely initial, development, mid, late and harvest.
The second module consists of the following steps:
After carrying out a soil test, input soil NPK values from the soil test report [10][11][12][13].
The recommended dose of NPK for the crops is stored in the database. Based on the input, the system recommends fertilizers so that the recommended dose can be achieved.
The name of the fertilizer and the quantity of the fertilizer to be applied per acre is displayed.
The recommendation system is created by considering 64 input possibilities for each crop. The input values of N,P,K respectively can lie within any of the four ranges: Very low, Low, Moderate, High, Very High. Fertilizers are selected accordingly based on their unique compositions [11].
The third module consists of the following steps:
Select the crop.
Enter the date of sowing.
Enter the value of required crop water (L) calculated in module 1.
Select the number of irrigation.
[image:2.595.313.539.87.475.2]The system calculates the interval of days between the irrigations by taking into consideration parameters such as available soil moisture, dry density of the soil, daily consumptive use of water and soil pH [5][14]. The date of the next irrigation depends on the date of the previous irrigation entered by the farmer. It is not mandatory to follow the schedule generated by the system. Thus, the system is completely flexible. The schedule generated contains detailed information about the crop such as land preparation, seed treatment, crop establishment, nutrient management, crop harvesting, etc [12].
Figure 1: Shows the flow diagram of the proposed system.
4. RESULT
Our system has integrated three different modules together to make the agriculture process simpler and easier. Following are some screenshots of the system:
[image:2.595.317.559.579.730.2]© 2018, IRJET | Impact Factor value: 6.171 | ISO 9001:2008 Certified Journal | Page 594 Figure 3: Shows the Crop Water page. The user has to
select the crop and the stage of the crop.
[image:3.595.39.289.75.260.2]Figure 4: Farmer enters the land available for cultivation.
Figure 5: System has calculated the crop water requirement.
Figure 6: Shows the Fertilizers page. Farmer enters the soil NPK values per acre.
[image:3.595.326.545.213.477.2]Figure 7: Shows the fertilizers recommended by the system.
Figure 8: List of fertilizers stored in the database.
[image:3.595.43.282.313.397.2] [image:3.595.321.550.504.732.2]© 2018, IRJET | Impact Factor value: 6.171 | ISO 9001:2008 Certified Journal | Page 595 Figure 10: Irrigation Schedule generated by the system.
[image:4.595.32.301.53.331.2]Figure 11: Events are stored in the system and can be viewed by the farmer.
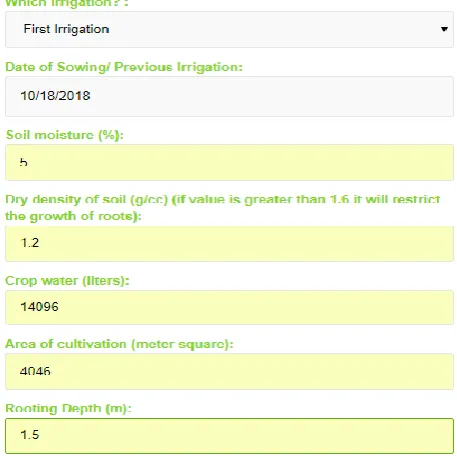
[image:4.595.315.552.129.423.2]Figure 12: Farmer selects the next irrigation and enters the date of previous irrigation for accurate results.
Figure 13: System generates the next irrigation date.
5. CONCLUSION
Comparing conventional and IOT based method of farming, the efficiency of farming based on IOT is high. Collecting real time meaningful data is possible due to IOT based applications. Our project has been developed for five crops and has incorporated information which will meet the needs of experienced as well as inexperienced farmers. The problems of excess water application, improper application of fertilizers can be avoided to limit water usage and obtain optimal yield. The irrigation schedule generated is dynamic and flexible as it allows the farmer to plan irrigations according to his needs.
ACKNOWLEDGEMENT
[image:4.595.53.271.363.582.2]© 2018, IRJET | Impact Factor value: 6.171 | ISO 9001:2008 Certified Journal | Page 596
REFERENCES
1) Snigdha Sen, Madhu B, “SMART AGRICULTURE: A BLISS TO FARMERS”, International Journal of Engineering Sciences & Research Technology, April, 2017.
2) Jeetendra Shenoy, Yogesh Pingle, “IOT in Agriculture", Proceedings of the 10th INDIACom:INDIACom-2016. 3)
https://www.iotforall.com/iot-applications-in-agriculture/
4) Yadvinder Singh, Surinder S. Kukal, Mangi Lal Jat, Harminder S. Sidhu,”Improving Water Productivity of Wheat-Based Cropping Systems in South Asia for Sustained Productivity”,volume 127, 2014.
5) “Irrigation Engineering And Hydraulic Structures” by Santosh Kumar Garg, 32nd revised edition, Khanna
Publishers.
6) http://cropin.co.in/
7) https://app.smart-fertilizer.com/login
8)
https://www.apixu.com/api-explorer.aspx?key=4153d0a630f54aa6b6f7283417151 0
9) J Doorenbos, W.O Prult, A. Aboukhaled, J Damagnez, N.G Dastane, C. Van Den Berg, P.E Rijterna, O.M Ashford, M. Frere, FAO Field Staff,” Crop Water Requirements”, FAO Irrigation and Drainage paper 24.
10)UNDERSTANDING YOUR SOIL ANALYSIS REPORT, Compiled & Edited by Peaceful Valley Farm Supply.
11)http://www1.agric.gov.ab.ca/$department/deptdocs.ns f/all/crop1273
12)http://www.ikisan.com
13)http://www.apnikheti.com/home