© 2016, IRJET | Impact Factor value: 4.45 | ISO 9001:2008 Certified Journal
| Page 892
IMPROVED OUTLIER DETECTION USING CLASSIC KNN ALGORITHM
K.T.Divya
1, N.Senthil Kumaran
21
Research Scholar, Department of Computer Science, Vellalar college for Women, Erode, Tamilnadu, India
2
Assistant Professor, Dept. of Computer Applications, Vellalar College for Women, Erode, Tamilnadu, India
---***---Abstract -Outlier detection is used for identification of items,
events or observations which do not conform to an expected pattern or other items in dataset. The identification of instances that diverge from the expected behavior is a important task. Existing techniques provides a solution to the problem of anomaly detection in categorical data with a semi supervised setting. The outlier detection approach is based on distance learning for categorical attributes (DILCAs), a distance learning framework was introduced. The key intuition of DILCA is that the distance between the two values of a categorical attribute can be determined by the way, in which they co-occur with the values of other attributes in the data set. Existing techniques work well for fixed-schema data, with low dimensionality. certain applications require privacy preserving publishing of transactional data (or basket data), which involve hundreds or even thousands of dimensions, rendering existing methods unusable. This work proposes novel anonymization methods for sparse high-dimensional data. It is based on approximate Classic K-Nearest Neighbor search in high-dimensional spaces. These representations facilitate the formation of anonymized groups with low information loss, through an efficient linear-time heuristic. Among the proposed techniques, Classic KNN-search yields superior data utility, but incurs higher computational overhead. In addition dimensionality reduction technique is used. In this work healthcare dataset are used
Key Words: Outlier Detection, Distance Learning, Semi Supervised Anomaly Detection, Classic KNN Algorithm.
1.INTRODUCTION
Outlier detection (also anomaly detection) is the identification of items, events or observations in data mining
which do not conform to an expected pattern or other items in a dataset. Anomalies are also referred to as outliers, novelties, noise, deviations and exceptions. Outliers in input data can skew and mislead the training process of machine learning algorithms resulting in longer training times, less accurate models and ultimately poorer results. In statistics, an outlier is an observation point that is distant from other observations. An outlier is because of due to variability in the measurement or it may indicate experimental error; the latter are sometimes excluded from the data set. Outliers, being the most extreme observations, it may also include the sample maximum or sample minimum or both depending on whether they are extremely high or low. However, the sample maximum and minimum are not always outliers because they may not be unusually far from other observations. Outliers can be classified into three categories: point outliers, contextual outliers and collective outliers. Outliers can have many anomalous causes. A physical apparatus for taking the measurements may have suffered a transient malfunction.
2. LITERATURE SURVEY
© 2016, IRJET | Impact Factor value: 4.45 | ISO 9001:2008 Certified Journal
| Page 893
attributes. Its shown that proposed framework, based on information-theoretic techniques, is able to model categorical data using a distance-based algorithm. It is show that proposed approach also outperforms a fully unsupervised anomaly detection technique, such as LOF, that they are coupled with a specific measure for categorical data.
Varun Chandola, Arindam Banerjee, Vipin Kumar [2009]describes that, Anomaly detection is an important problem that has been researched within diverse research areas and application domains [2]. They have grouped existing techniques into different categories based on the underlying approach adopted by each technique. For each category they have identified key assumptions, which are used by the techniques to show difference between normal and anomalous behavior. When applying a given technique to a particular domain, these assumptions can be used as guidelines to assess the effectiveness of the technique in that domain. Many techniques discussed in this survey require the entire test data before detecting anomalies. Recently, techniques have been proposed that can operate in an online fashion; such techniques not only assign an anomaly score to a test instance as it arrives, but also incrementally update the model.
Dino Ienco, Ruggero G. Pensa and Rosa Meo [2012] stated that clustering data described by categorical attributes is a challenging task in data mining applications. Unlike the numerical attributes, it is difficult to define a distance between the pairs of values of a categorical attribute, since the values are not ordered. The authors propose [4] a framework to learn a context-based distance for the categorical attributes. The key intuition of this work is that the distance between two values of a categorical attribute Ai can be determined by way in which the values of other attributes Aj are distributed in the dataset objects: if they are similarly distributed in groups of objects in correspondence of the di. The authors in this study proposed a solution to the critical point for the choice of the attributes Aj. They validate their approach by embedding their distance
learning framework in hierarchical clustering algorithm. They applied it on the various real world and synthetic datasets, both are low and high-dimensional. Experimental results show that their method is competitive. They also show that their approach is scalable and has a low impact on the overall computational time of a clustering task. They introduce a new method [4], called DILCA, to compute the distance between any pair of values of a specific categorical attribute; notice that the distance-learning approach is independent of any subsequent learning on the actual instances
Keith Noto, Carla Brodley and Donna Slonim [2012] described thatAnomaly detection involves identifying rare data instances (anomalies) that come from a different class or distribution than the majority. By giving training set of only normal data, the semi-supervised anomaly detection task is used to identify anomalies in the future. The unsupervised anomaly detection task is different by means of normal data, identify the anomalies among them. Many real-world machine learning tasks, including many fraud and intrusion detection tasks, are unsupervised because it is impractical to verify all of the training data. They recently presented FRaC [5], a new approach for semi-supervised anomaly detection. FRaC is based on using normal instances to build an ensemble of the feature models, and then identifying instances that disagree with those models as anomalous. In this paper, they investigate the behavior of FRaC experimentally and explain why FRaC is so successful. They also show that FRaC is a superior approach for unsupervised as well as the semi-supervised anomaly detection task, which are compared to well-known state-of-the art LOF, anomaly detection methods and one-class support vector machines, and to an existing feature-modeling approach.
3.PROBLEM FORMULATION
© 2016, IRJET | Impact Factor value: 4.45 | ISO 9001:2008 Certified Journal
| Page 894
expected distribution. Concerning the first point of view in the literature, identify three classes of approaches: supervised, unsupervised, and semi supervised. Supervised techniques are often handled using the classical machine learning techniques where the problem is treated as a binary classification problem with the abnormal class being poorly represented (imbalanced data).
Unsupervised techniques detect anomalies without knowledge on the class variable. They assume that the anomalies are geometrically separated in the feature space from the normal instances. Supervised and Unsupervised anomaly detection techniques represent the majority of the research work in the area of anomaly/outlier detection. A limitation of these approaches consists in the fact that they assume that the training data contain both normal and abnormal instances. A solution to this point comes from the semi supervised approaches that do not require anomalous instances in the training phase.
They build a model of normal class in the training data and recognize the anomalies in test data as those instances that most differ from the normal model. As a positive side effect, when normality shifts, it may relearn the data model. Concerning the second point of view, most anomaly detection methods apply to numerical or ordinal attributes for which the normality can be defined as a proximity notion between the instances described as vectors in an m-dimensional space.
3.2 SYSTEM OBJECTIVE
3.2.1 Main Objective
The main objective of this research is to provide a solution to the problem of anomaly detection in categorical data with a semi-supervised approach. This research considers
anonymization of high-dimensional data for non-binary databases.
To apply dimensionality-reduction technique such that age and category (adult/children) can be reduced to age only.
To reduce computational overhead,
To increase data utility by proper anonymization carried out by substituting proper Value Generalization Hierarchy values.
3.2.2 Specific Objective
The proposed methodology implements the approach of the previous researches which consists of three categories of novel anonymization methods for sparse high-dimensional data. Approximate nearest-neighbor (NN) search is used.
In addition, dimensionality reduction technique is applied so that two attribute values is averaged and converted into a new attribute.
Likewise, maximum of two attributes values is taken as value for new attribute. Hence the dimensionality reduction is achieved.
Anonymization of high-dimensional data for non-binary databases is considered.
Dimensionality-reduction technique is applied
4.SYSTEM METHODOLOGY
© 2016, IRJET | Impact Factor value: 4.45 | ISO 9001:2008 Certified Journal
| Page 895
4.1 SYSTEM ARCHITECTURE
The system is designed and implemented with the following processes to perform the outlier detection over the categorical data using the semi-supervised approach.
Distance Learning for Categorical Attributes Semi-supervised Anomaly Detection Classic K-Nearest Neighbor Search Classic K-Nearest Neighbor Algorithm
Classic K- Nearest Neighbor for data reduction Dimensionality Reduction for KNN Search Distance Learning for Categorical Attributes
The distribution of values in the contingency table is help to define a distance between the values of a categorical attribute, but also that the context matters. Let us now consider the set F = { X1, X2,. . . , Xm} of m categorical attributes and data set D, in which the instances are defined over F. We denote by Y ∈ F the target
attribute, which is a specific attribute in F that is the target of the method [8], i.e., the attribute on whose values we compute the distances.It allows to compute a context-based distance between any pair of values (yi, y j) of the target attribute Y in the basis of the similarity between the probability distributions of yi and y j given the context attributes, called C(Y) ⊆ F \ Y. For each context attribute Xi ∈
C(Y), computes the conditional probability for both the values yi and y j given the values xk ∈ Xi, and then, it applies the Euclidean distance. The Euclidean distance is normalized by the total number of considered values as
At the end of the process, returns a distance model M = {MXi | i = 1,. . ., m}, where each MXi is the matrix
containing the distances between any pair of values of attribute Xi.
CALSSIC K-NEAREST NEIGHBOR SEARCH
The Classic k-nearest neighbor algorithm (k-NN) is a method for classifying objects based on closest training examples in the feature space. k-NN is a type of instance based learning, or lazy learning where the function is approximated locally and all computation is deferred until the classification[7]. In this process, the numerical columns values of patient profiles (which are classified into specified groups already) is taken as x-axis and y-axis data and then new patient is classified into one of the existing patients’ classes.
CLASSIC K-NEAREST NEIGHBORS ALGORITHM
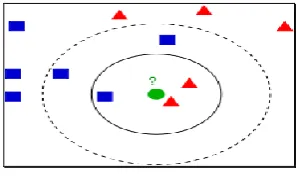
[image:4.595.359.508.538.629.2]The Classic k-Nearest Neighbors algorithm (or Classic-k-NN) is a non-parametric method used for classification and regression[9]. In both cases, the input consists of the k closest training examples in feature space. The output depends on whether K-NN is used for classification or regression K-NN is a type of instance-based learning, or lazy learning, where the function is only approximated locally and all the computation is deferred awaiting classification. The k-NN algorithm is among the simplest of all machine learning algorithms.
Fig 4.1 Classic k-NN classification
Data Reduction
Data reduction is one of the important problems for work with huge data sets. Usually, only some of the data points are needed for accurate classification. Those data are said to be prototypes and can be found as follows:
© 2016, IRJET | Impact Factor value: 4.45 | ISO 9001:2008 Certified Journal
| Page 896
2. Separate the remaining data into two sets: (i) the prototypes which are used for the classification decisions (ii) the absorbed points that can be correctly classified as k-NN using prototypes. The absorbed points that can be removed from the training set.
DIMENSIONALITY REDUCTION FOR KNN SEARCH
In the dimensionality reduction for KNN search, there are three numerical columns values of patient profiles (which are classified into specified groups already) are taken and two of the three data are averaged into one data and is taken as x-axis and third column as y-axis data and then new patient is classified into one of the existing patients classes.
5.RESULTS AND DISCUSSION
Experimental analysis is to be of use to researchers from all fields who want to study algorithms experimentally. To demonstrate the proposed method classic KNN classification is used and compare it performance with KNN Classification
5.1 EXPERIMENTAL RESULTS
The following Table 5.1 describes Secure Outlier model for existing KNN and Classic KNN classification algorithm. The table contains number of patient datasets, average for KNN Classification algorithm and average performances for Classic-KNN Classification algorithm details are given below.
Number of Datasets
[N]
KNN-Classification
[%]
Classic KNN-Classification
[%]
100 50.2 51.33
200 58.67 59.32
300 64.03 65.34
400 72.33 73.44
500 76.12 77.98
600 79.33 79.89
700 80.44 81.04
800 81.45 82.78
900 83.22 84.03
1000 84.10 85.65
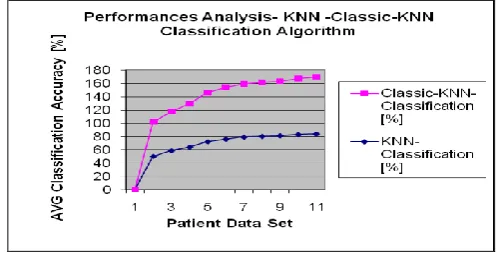
Table 5.1 Performances Analysis- KNN –Classic KNN Classification Algorithm
[image:5.595.308.557.331.465.2]The following Fig 5.1 describes Secure Outlier model for existing KNN and Classic KNN classification algorithm. The figure contains number of patient datasets, average for KNN Classification algorithm and average performances for Classic-KNN Classification algorithm details are given below.
Fig 5.1 Performances Analysis- KNN-Classic-KNN Algorithm
The following Table 5.2 describes Secure Outlier model for existing KNN and Classic KNN Classification algorithm. The table contains number of observation patient dataset, average for KNN Classification algorithm and average performances for Classic-KNN Classification algorithm details are given below.
Number of Numerical Datasets [N]
KNN Classification
[%]
Classic KNN Classification
[%]
100 60.43 58.23
200 63.66 61.67
300 65.04 62.22
400 67.99 64.83
500 69.03 66.45
© 2016, IRJET | Impact Factor value: 4.45 | ISO 9001:2008 Certified Journal
| Page 897
700 72.77 69.34
800 74.03 70.07
900 75.88 72.09
1000 76.73 73.08
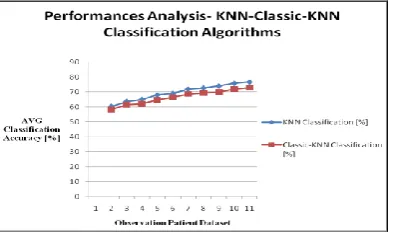
Table 5.2-Performance Analysis of KNN-Classic-KNN Classification Algorithm
[image:6.595.40.557.326.790.2]The following Fig 5.2 describes Secure Outlier model for existing KNN and Classic KNN Classification algorithm. The figure contains number of observation patient dataset, average for KNN Classification algorithm and average performances for Classic-KNN Classification algorithm details are given below.
Fig 5.2: Performance Analysis of KNN-Classic-KNN Classification Algorithm
The following Table 5.3 describes Secure Outlier model for existing KNN and Classic KNN Classification algorithm. The table contains number of observation patient dataset, time taken for KNN Classification algorithm and time taken performances for Classic-KNN Classification algorithm details are given below.
Number of Numerical Datasets [N]
KNN Classification
[ms]
Classic KNN Classification
[ms]
100 0.008 0.005
200 0.014 0.011
300 0.023 0.020
400 0.032 0.026
500 0.042 0.037
600 0.053 0.044
700 0.065 0.052
800 0.072 0.064
900 0.081 0.075
1000 0.094 0.083
Table 5.3-Performance Time Analysis of KNN-Classic-KNN Classification
The following Table 5.3 describes Secure Outlier model for existing KNN and Classic KNN Classification algorithm. The figure contains number of observation patient dataset, time taken for KNN Classification algorithm and time taken performances for Classic-KNN Classification algorithm details are given below
Fig 5.3 Performance Time Analysis of KNN-Classic-KNN
[image:6.595.65.263.330.446.2]© 2016, IRJET | Impact Factor value: 4.45 | ISO 9001:2008 Certified Journal
| Page 898
6. CONCLUSIONS
Outlier detection is an important issue occurs within various research and applications domains in today. It aims to detect the object that are considerably distinct, exceptional and inconsistent the majority data in input data sets. To identify abnormal data which forms non conforming pattern is referred to as outlier, anomaly detection. This leads to knowledge and discovery. The proposed methodology is about outlier detection approaches from position of data mining term. In that reviews related work in outlier detection. Managing and handling categorical data are a recurrent problem in data mining. The k-nearest neighbor algorithm (k-NN) is a method for classifying objects based on closest training examples in the feature space. k-NN is a type of instance that is based on learning, or lazy learning where the function is only approximated locally and all computation is deferred until classification.
7.FUTURE WORK
To reduce redundant or irrelevant features that can improve classification performance in most of cases and decrease cost of classification. A novel semi-supervised classification technique has to be proposed for dimensionality reduction in mammogram classification. As a future work, new data structures to handle categorical data more efficiently and speed up the anomaly detection task for continuous and categorical attributes.
8.BIBLIOGRAPHY
[1] Dino Ienco, Ruggero G. Pensa, and Rosa Meo,” A Semisupervised Approach to the Detection and Characterization of Outliers in Categorical Data”, IEEE transactions on neural networks and learning systems, February 2, 2016.
[2] Chandola .V, Banerjee .A, and Kumar .V, “Anomaly detection: A survey,” ACM Comput. Surv., vol. 41, no. 3, 2009, Art. ID 15.
[3] Angiulli .F and Fassetti .F, “Distance-based outlier queries in data streams: The novel task and algorithms,” Data Mining Knowl. Discovery, vol. 20, no. 2, pp. 290–324, 2010. [4] Ienco .D, Pensa R.G, and Meo .R, “From context to distance: Learning dissimilarity for categorical data clustering,” ACM Trans. Knowl. Discovery Data, vol. 6, no. 1, 2012.
[5] Noto .K, Brodley .C, and Slonim .D, “FRaC: A feature-modeling approach for semi-supervised and unsupervised anomaly detection,” Data Mining Knowl. Discovery, vol. 25, no. 1, pp. 109–133, 2012.
[6] Breunig M. M, Kriegel H.P, Ng .R.T, and Sander .J, “LOF: Identifying density-based local outliers,” in Proc. ACM SIGMOD Conf. Manage. Data, Dallas, TX, USA, May 2000, pp. 93–104.
[7]Kriegel H.P, Schubert .M, and Zimek .A, “Angle-based outlier detection in high-dimensional data,” in Proc. 14th ACM SIGKDD Conf. Knowl. Discovery Data Mining, Las Vegas, NV, USA, Aug. 2008, pp. 444–452.
[8] Chandola .V, Boriah .S, and Kumar .V, “A framework for exploring categorical data,” in Proc. SIAM Int. Conf. Data Mining, Sparks, NV, USA, Apr. 2009, pp. 187–198.