© 2017, IRJET | Impact Factor value: 5.181 | ISO 9001:2008 Certified Journal
| Page 1328
Detection and Classification of Tumor in Mammograms using Discrete
Wavelet Transform and Support Vector Machine
Deepthi Sehrawat
1, Abhishek Sehrawat
2, Dhirendra Jaiswal
3,
Dr. Anima Sen
41
Asst. Prof., Amity School of Engineering & Technology, Amity University Gurgaon
2P.G. student, University of Calcutta & The West Bengal University of Health Sciences
3
P.G student, All India Institute of Medical Sciences, New Delhi
4
Member Secretary, University of Calcutta & The West Bengal University of Health Sciences
---***---Abstract-
The breast cancer is common causes amongwomen. It is detectable. The detection of the tumor method follows preprocessing, feature extraction, and classification. In preprocessing the noises is removed by Gaussian filters from the original images and elaborate the image. The wavelet features are used for the classification to get the tumor classification. The support vector machine is used for classification.
I. INTRODUCTION
At present breast cancer is one of the cause of death among women after lung cancer [1]-[5]. The urban women are more affected than rural women. It is more developed in the higher societies. The average incidence rate varies from 22-28 per 1,00,000 women per year in urban settings to 6 per 100,000 women per year in rural areas. There is a rising incidence of breast cancer in India due to rapid urbanization and westernization of lifestyles, According to The International Agency for Research on Cancer, a part of the WHO, the collected data is 79,000 women per year affected by breast cancer in India. It is thought that it takes about 10 years to become 1 cm in size s. Earlier diagnoses of breast cancer is significant. At present, mammography is the easy method for early breast cancer detection [6]-[8]. But automatic analysis of mammograms is not completely replaced by radiologists, to make more reliable and efficient decisions [9]an accurate computer-aided analysis method is used by radiologist. Tumors and other abnormalities present in the mammograms are of basic interests that need to be segmented and extracted in
mammograms [10]-[11].The grayscale based
segmentation methods are enough effective to extract the exact edges of homogeneous grayscale regions. They are often not so effective with complex structure because of the complex distribution of the grayscale. But the appearances of breast cancers are very delicate and unbalanced in their early stages. So there is chances to miss the abnormalities by radiologists in case of diagnose
by experience. The computer aided detection technology can help doctors and radiologists to get a more reliable and effective diagnosis. There are several tumor detection techniques have been analyzed [12]-[13].A region-growing technique is discussed by Umesh A diga et al [14] which is controlled by shape and size similarities of cell nuclei. In high throughput tissue image analysis, an automatic initial seed selection method is required and becomes slow due to the requirement of continuous updating of similarity measures. The semi-automation method proposed by Wu and Barba [15] has limitation he shape of the segmented object tends to change in accordance with the shape of the structuring elements used for filtering [16]-[18] if morphological filters are used, a parametric model-fitting algorithm for cell segmentation [19].is proposed by Wu et al. Objects are assumed convex in this method and hence a shape model can be used for segmentation. The algorithm is very complicated if overlapped structures are present in the image. Wavelet transform-based methods offer a natural
framework for providing multi scale image
© 2017, IRJET | Impact Factor value: 5.181 | ISO 9001:2008 Certified Journal
| Page 1329
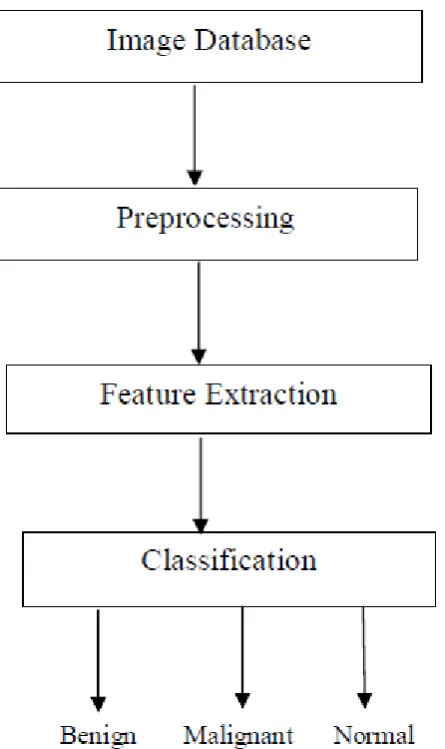
Fig. 1: Functional block diagram of the proposed schemeThe overview of the proposed method is follows thefigure1. The methodology deals with medical image processing. Further process is done by using MATLAB coding. The mammogram images are collected then deals with the part of various steps such as enhancement, segmentation, feature extraction and classification.
1.1 Preprocessing
The preprocessing is used to identify the tumor. It is significantly increasing the reliability, robustness of the image. It is used to remove the noise and elaborate the image using Gaussian filter. To reduce the work area only to the relevant region that exactly contains the breast. It acquires the image from the database as the input image.
1.2 Gaussian filter
The noise is removed from the image by Gaussian filter and its impulse response is Gaussian function. It is a class of linear smoothening filters with the weight chosen according to the shape of Gaussian function. For smoothening purpose Gaussian kernel is mainly used. It is used to remove noise from the normal distribution. The filter window is symmetric in center so it makes Gaussian filter as unrealized. But it is not limitation for application if the bandwidth is much larger than the signal. Five properties make Gaussian functions useful. These properties of Gaussian filter smoothing filters are effective low-pass filters from the view of both the spatial and frequency domains are efficient.
1.3 Segmentation
The next step is segmentation after image acquisition. Segmentation is the process of classifying the image into several regions [30]. The proposed segmentation of intensity images such as mammograms is based on thresholding technique (Ostu method).involves the separation of background from the breast tissues in the thresholding in mammogram images. Based on the threshold value the pixels that are less than the threshold are considered as background and the remaining pixels are considered as breast.
1.4 Discrete Wavelet Transform:
The vital symptoms of breast cancers are the presence of micro calcification cluster has higher attenuation than the breast tissue as rough bright spot in the mammograms. These spots appear as high frequency in the frequency domain and can be identified by using wavelet based approaches.
© 2017, IRJET | Impact Factor value: 5.181 | ISO 9001:2008 Certified Journal
| Page 1330
( )√ (
) ( )
The variable ‘a’ (inverse of frequency) reflects the width of a specific basis function such that its large value gives low frequencies and small values gives the high frequencies. The variable ‘b’ specifies its translation along x-axis in time. The term
√ is used for normalization.
1.5 Feature Extraction:
Feature extraction techniques are used to extract the most discriminating features which represent various classes of images. The image properties of the extracted features are provided and compare with the unknown sample image features for classification. Here, Gray Level Co-occurrence Matrix (GLCM) approach is used for feature extraction. The GLCM is constructed based on the wavelet sub bands. Then the texture features, like Contrast, Correlation Energy, and Entropy are extracted from the constructed co-occurrence matrix for diagnosis purpose.
A.
Energy: It is a grayscale image texture measure
of homogeneity changing, reflecting the
distribution of image grayscale uniformity of weight and texture. The formula for calculating the Energy _ is given as follows::
∑ ∑
( )( )
B.
Contrast:
It is the main diagonal near themoment of inertia, by which the value of the matrix is measured to distribute and images of local changes in number, reflecting the image clarity and texture of shadow depth. The contrast is computed as follows:
( )
∑
∑(
)
( ) ( )
C.
Entropy: It is used to measure the image texture
at random, if the space co-occurrence matrix for all values are equal, then it achieved the minimum value. The Entropy S is given as
∑ ∑
( ) ( )( )
D.
Correlation Coefficient: Measures the
probability of combined occurrence of the specified pixel pairs.
∑
( )( )
( )
1.5 Window Selection
The selection of small and large window is the first step in fine segmentation. Here the whole image R is partitioned into a finite set of large regions or large windows R1, R2, Rm.
⋃
( )
© 2017, IRJET | Impact Factor value: 5.181 | ISO 9001:2008 Certified Journal
| Page 1331
1.6 Window based thresholding
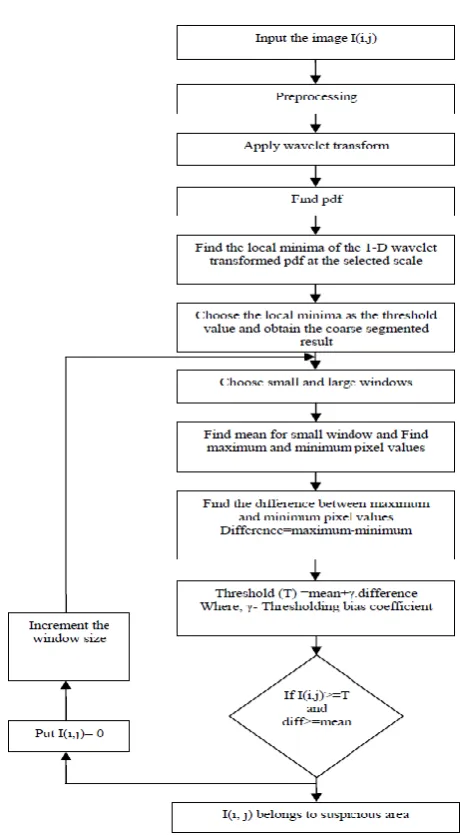
Figure 2. Flow chart of the wavelet based adaptive windowing
method of segmentation
Fig.2 shows the flowchart of the proposed method for tumour detection. For each pixel in coarse segmented result I (i, j), a decision is made to classify it into a potential doubtful cut pixel or a normal pixel by the following rule. If I(i, j) ≥ TH(i, j) and Difference ≥ Mean, then I(i, j) belongs to the doubtful area; else, I(i, j) belongs to the normal area. In this rule, TH(i, j) is an adaptive threshold value calculated by equation(4).Here, γ is a thresholding bias coefficient. Its value ranges from zero to one. Mean is an average of pixel intensity in a small window around the pixel I(i, j); max(i, j) and min(i, j) are
the maximum and minimum intensity values in the large window. Each step is explained as are under.
1) The coarse segmented image I(i,j) is considered and choose the window sizes of (w1 x w1) & (w2 x w2) for large window and small window respectively.
2) The equation is used to determine the mean for small
window
∑ ( )
( )
Where, N is the total number of pixels in small window, S (i,j) is the pixel value within the small window.
3) The maximum and minimum pixel values within the
large window are computed. Maximum=max(L(i,j)) Minimum=min(L(i,j)) (3)
Where, L(i,j) is the pixel value within large window.
4) Find the difference between maximum and minimum
pixel values. Difference=max(L(i,j))-min(L(i,j)) (4)
5) Calculate the threshold value by using the following
equation.
TH(i,j)=Mean + γ ・difference (5)
With difference =max (i, j) − min (i, j), γ is a thresholding bias coefficient
6) If I(i, j) ≥ TH(i, j) and Difference ≥ Mean, then I(i,j) belongs to the suspicious area; else, I(i, j) belongs to the normal area otherwise, shift the window by one step and go to step (2).
(7). Repeat steps (2) -(6) till the whole image is exhausted.
1.7 Classification
© 2017, IRJET | Impact Factor value: 5.181 | ISO 9001:2008 Certified Journal
| Page 1332
performed by using trained classifier [31].According to thepattern presented in the form of a feature vector.
Support Vector Machine
The Support Vector Machine (SVM) is a supervised device with associated learning algorithm that analyzes data and recognize pattern. It searches for a separating hyper plane to separates positive and negative from each other with maximum margin. So, the distance between the decisions surface [32]. SVM classifier is designed to solve a binary classification problem finding the class boundary, the hyper plane maximizing the margin in the given training
2. RESULTS AND DISCUSSION
The proposed method is tested by using the mini-MIAS database of mammograms. All images are digitized at the resolution of 1024 × 1024 pixels and 8- bit accuracy (gray level). The proposed algorithm was implemented in a MATLAB environment. The original image is shown as Fig.3(a). The preprocessing is done by linear contrast stretching which is shown in Fig.3(b).
[image:5.595.308.534.102.221.2](a) Original image (b)Preprocessed image
Figure 3. Original image and preprocessed image
Fig.4 (a) shows the original mammogram images. Then Fig.7 (b) shows the bad segmentation results because it cannot detect the entire tumor area. Simulation results show that the
proposed algorithms yield significantly superior image quality when it is compared to the Global thresholding method and window based adaptive thresholding method.
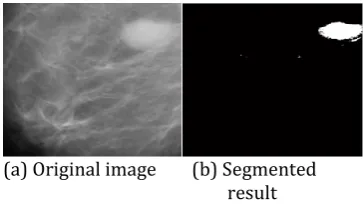
[image:5.595.343.525.269.372.2](a) Original image (b) Segmented result
Figure 4. Example of segmentation results by the Global thresholding.
(a) Original image (b) Segmented result
Figure 5. Example of segmentation results by the window based adaptive thresholding segmentation.
Fig.5 (a) shows the original mammogram images. Then Fig.5 (b) shows the segmentation results for window based adaptive thresholding. Fig.6 (a) shows the original mammogram images. Then Fig.6(b) shows the preprocessed output and Fig.6(c) shows the coarse segmented result. Fig.6(d) shows the fine segmented result.
(a)Original image (b) Preprocessed image (c) Coarse segmented result (d) Fine segmented result.
Figure 6. Example of segmentation results by the wavelet based adaptive windowing method of thresholding.
3. CONCLUSION
[image:5.595.36.267.432.548.2] [image:5.595.309.531.512.593.2]© 2017, IRJET | Impact Factor value: 5.181 | ISO 9001:2008 Certified Journal
| Page 1333
wavelet based analysis of PDFs of wavelet
transformed images at different channels. Window
wing method is used to obtained Final segmented
result. And by choosing threshold the simulation
results show that the proposed method is effective to
segment the tumors in mammograms and it can also
be used in other segmentation applications.
Simulation results show that the proposed
algorithms yield significantly superior image quality
when it is compared to the Global thresholding
method and window based adaptive thresholding
method.
4. REFERENCES
[1] T.C.Wang, N.B. Karayiannis, “Detection of micro
calcifications in digital mammograms using wavelets, Medical Imaging,” IEEE Transactions, 17 , 498 -509, 1998.
[2] H. Kobatake, M. Murakami, H. Takeo, and S.
Nawano, “Computerized detection of malignant
tumors on digital mammograms,” IEEE
Trans.Med. Imag., vol. 18, no. 5, pp. 369–378, May 1999.
[3] R.Mata, E.Nava, F. Sendra, “Micro calcifications
detection using multi resolution methods, pattern Recognition,”2000,proceeings,15th International Conference.4,344-347,2000.
[4]. X. P. Zhang, “Multiscale tumor detection and
segmentation in mammograms,” in Proc. IEEE Int. Symp Biomedical Image, pp. 213–216, Jul. 2002.
[5] F. Fauci, S. Bagnasco, R. Bellotti, D. Cascio,
C.Cheran, F. De Carlo, G. De Nunzio, M. E.Fantacci, G. Forni, A. Lauria, E. Lopez Torres, R.Magro, G. L. Masala, P. Oliva, M. Quarta, G. Raso,A. Retico, and S. Tangaro, “Mammogram segmentation by contour searching and masslesions classification with neural network,” IEEE Trans. Nucl. Sci., vol. 53, no. 5, pp. 2827–2833,Oct. 2006.
[6] Grady, L., “Random Walks for Image
Segmentation,” IEEE Transactions on PAMI 28(11),1–17, 2006.
[7] Ersoy, I., Bunyak, F., Palaniappan, K., Sun,
M.Forgacs, G., “Cell Spreading Analysis with Directed Edge Profile-Guided Level Set Active Contours,” In: Metaxas, D., Axel, L., Fichtinger, G.,Székely, G. (eds.) MICCAI 2008, Part I. LNCS, vol.5241, pp. 376–383. Springer, Heidelberg, 2008.
[8] A.Mencattini, M. Salmeri, R. Lojacono, M. Frigerio,
and F. Caselli,“Mammographic images
Enhancement and denoising for breast cancer detection using dyadic wavelet processing,” IEEE Trans. Instrum. Meas., vol. 57, no. 7, pp. 1422– 1430, Jul. 2008.
[9] Giovanni Palma, Isabelle Bloch, and Serge Muller,
“Spiculated Lesions and Architectural
DistortionsDetection in Digital Breast Tomo synthesisDatasets,” IWDM 2010, LNCS 6136, pp. 712–719,2010.
[10] S. Liu, C. F. Babbs, and E. J. Delp,“Multi resolution
detection of speculated lesions indigital mammograms,” IEEE Trans. Image Process., vol. 10, no. 6, pp. 874–884, Jun. 2001.
[11] G. M. te Brake and N. Karssemeijer, “Segmentation
of suspicious densities in digital mammograms,” Med. Phys., vol. 28, no. 2, pp.259–266, Feb. 2001.
[12] Shengzhou Xu & Hong Liu & Enmin Song,
“Marker-Controlled Watershed for Lesion
Segmentation in Mammograms,” J Digital Imaging24:754–763, 2011.
[13] M. Grgic et al. (Eds.): Rec. Advance In Multi Signal
Process. And Communication., SCI 231, pp. 631– 657, 2009.
[14] Umesh Adiga, et al(2006), “High Throughput
Analysis of Multispectral Images of Breast Cancer Tissue,” IEEE Trans on image processing, vol.15,No.8,August 2006.
[15] H.S.Wu and J. Barba, “An efficient semi automatic
algorithm for cell contour extraction,” J. Microscopy, vol. 179, pp. 270–276, 1995.
[16] N. H. Eltonsy, G. D. Tourassi, and A. S.Elmaghraby,
“A concentric morphology model for the detection
of masses in mammography,” IEEE Trans.
Med. Image., vol. 26, no. 6, pp. 880–889, Jun. 2007.
[17] A. Nedzved, S. Ablameyko, and I. Pitas,
“Morphological segmentation of histology cell
images,” presented at the Int. Conf.
PatternRecognition, Barcelona, Spain, 2000. [18] S. Schupp, A. Elmoataz, P. Herlin, and D. Bloyet,
“Mathematical morphologic segmentation
dedicated to quantitative immune
histochemistry,” Anal. Quant. Cytol. Histol., vol. 23, no. 4, pp. 257–67, 2001.
[19] H. S. Wu, J. Barba, and J. Gil, “A parametric fitting algorithm for segmentation of cellimages,” IEEE Trans. Biomed. Eng., vol. 45, no. 3pp. 400–407, Mar. 1998.
[20] Wei Ping Li Junli, Zhao Shanxu, Lu Dongming,Chen
Gang, “A Method of Detection Micro-Calcifications in Mammograms Using Wavelets and Adaptive Thresholds,” The second International Conference on Bioinformatics and Biomedical Engineering, ICBBE 2008, pp.2361 –2364, 2008.
[21] Pradhan, S Swaroop Patra, D Nanda, P Kumar,
“Adaptive Thresholding Based Image
© 2017, IRJET | Impact Factor value: 5.181 | ISO 9001:2008 Certified Journal
| Page 1334
and Information Systems, ICIIS, Kharagpur,December8-10, 2008.
[22] S. Mallat, “A theory for multiresolution signal
decomposition: The wavelet
representation,”IEEETrans. Pattern Anal. Mach. Intell, vol. 11, no. 7, pp.674–693, Jul. 1989.
[23] Grossman, A. and Morlet, J., “Decomposition
ofHardy functions into square integrable wavelets ofconstant shape,” SIAM J. Math. Anal., Vol. 15, No.4, pp. 723–736, 1984.
[24] Garbay, “Image structure representation and
processing: A discussion of some segmentation methods in cytology,” IEEE Trans. Pattern Anal. Mach. Intel, vol. PAMI-8, pp. 140–146, 1986. [25] Mallat, S., “A theory for multi resolution signals
decomposition: The wavelet representation,” IEEE Trans Pattern Anal. Mach. Intel, Vol. 11, No. 7pp. 674–693, 1989.
[26] Daubechies, I., “Orthonormal bases of compactly
supported wavelets,” Commun. Pure Appl. Math., Vol. 41, No. 7, pp. 909–996, 1988.
[27] Unser, M., Aldroubi, A., and Laine, A., “Special issue on wavelets in medical imaging,” IEEE transactions on medical imaging, Vol. 22, No. 3,2003.
[28] Weaver, J. B., Yansun, X., Healy, D. M., and
Cromwell, L. D., “Filtering noise from images with wavelet transform,” Magn. Reson. Med., Vol. 21,No. 2, pp. 288–295, 1991.
[29] X.P.Zhang and M. D. Desai, “Segmentation of bright
targets using wavelets and adaptive
thresholding,” IEEE Trans. Image Process., vol. 10,no. 7, pp. 1020–1030, Jul. 2001.
[30] Ramesh Kumar, K.K. and A. Anbumani, 2014.
“Medical Image Segmentation using Multifractual Analysis” International Journal of Inventions in Computer Science and Engineering (IJICSE), 1: 3.
[31] Muhammad Hussain, Salabat Khan, Ghulam
Muhammad, Iftikhar Ahmad, George
Bebis,”Effective Extraction of Gabor Features for False Positive Reduction and Mass Classification in Mammography,Appl. Math. Inf. Sci. 6,No. 1, 29-33 (2012).
[32] R.Nithya,B.santhi, “Mammogram Classification