© 2017, IRJET | Impact Factor value: 5.181 | ISO 9001:2008 Certified Journal
| Page 1
Numerical simulation of Hybrid Generation System: a case study
B.AFif
1,R., Elhamrani
2, A.BENHAMOU
31
B, Afif , Department of Electrical Engineering, E.N.P Oran, Algeria.
2R, Elhamrani
,
EMP, Bordj Elbahri, Algeria
3
A. Benhamou, energetic Department, Boumerdes, Algeria
---***---Abstract -
Objective of this study is to simulate an hybrid wind-photovoltaic-diesel generator to supply a load in Tamanrasset region, this solution is proposed to overcome defects of zone isolation, Not important and also scattered in this region. Algeria among the countries, which have a very important renewable deposit. However, part of renewable energies in the national energy balance still very low. In this context, work presented in this paper is a contribution to use of hybrid system - Wind-Photovoltaic-Diesel with storage batteries to be installed in Tamanrasset region, in order to reduce greenhouse gas emissions. To validate hybrid system for electrical energy generation, simulation results will be presented by HOMER software based on actual geographical information of studied region.Key Words:
Renewable Energies, Hybrid System,
Homer, solar wind system.
1. INTRODUCTION
Global warming and pollution caused by fossil fuels, which have become harmful to human life. Growth in global electricity demand, thus rapid depletion of hydrocarbons requires use of renewable energies [1] which are non-polluting, practical and economical.
Only 6.4% of total renewable energy sources available in the world are used today as sources of inexhaustible electrical energy. In order to compensate for defects of each energy source, there has been an increasing tendency to combine them with diesel generators, which gives a hybrid system of energy generation.
For isolated sites of conventional power grid, the possibility of being connected with this network remains a major problem to the fact that price of extension is prohibitive in parallel with the increase in fuel prices also. Highlighting the price of generators based on renewable energy are experiencing a steady decline in price at the same time increasing reliability, these benefits have led to significant use of generation of electric power by renewable energies [2].
The relation between its renewable energies and the limits of use, with regard to variation of resources and the fluctuation of loads according to annual and daily periods linked to climatic conditions, are the subject of a more general solution at the level of Generation of electric power, one that leads to introduction of hybrid systems, to serve as electric power to telecommunication relays, border posts, isolated housing, dispensaries ... etc
2. OPTIMIZATION WITH HOMER SOFTWARE
For the hybrid system study; We used HOMER software, which was developed by National Renewable Energy Laboratory (NREL) in United States and supports design evaluation of various electrical power generation systems connected to an electrical grid Classic or not, for variety of applications. It allows to analyze and to combine between different sources of energy in order to arrive at displaying an optimal configuration of a system capable of supplying energy to specified site in a feasible manner according to certain technical and economic criteria [3].
To simulate a hybrid system, all elements of the hybrid system must be defined, using the components defined in the software library such as wind turbines, photovoltaic panels, generators and static converters, etc. If it is necessary to add a component that does not exist in the list of elements defined by default, the software allows us to add it by introducing all its technical characteristics as well as its cost. You can also modify the characteristics of a component already existing in the library.
Also HOMER simulates the operation of a system by making hourly energy budget calculations at each element for 8760 hours in a year. He finds the least expensive combination that meets specific electrical and thermal loads. HOMER simulates several configurations; it optimizes the cost for a given life cycle and generates sensitivity results for most situations.
2.1Geographical site
© 2017, IRJET | Impact Factor value: 5.181 | ISO 9001:2008 Certified Journal
| Page 2
We will present a hybrid system based on photovoltaicpanels and wind turbines and as a backup alternative, diesel generators and energy storage batteries. To do this, we must have all the solar radiation data, wind speed for the chosen site, load profile to be fed by the system, initial cost of each component (diesel, renewable energy generator, batteries, and converters), cost of fuel and lifetime of the project.
Fig -1: Seasonal load profile
Figure 1 shows the load profile to be supplied. The simulation process of chosen hybrid system; was analyzed to see if the use of power system will be possible or not. It is important to note that these houses presented in the example study are already connected to the network; the additional objective is to see the possibility of using a hybrid system to supply them with electrical energy. The daily load is 88 KWh.
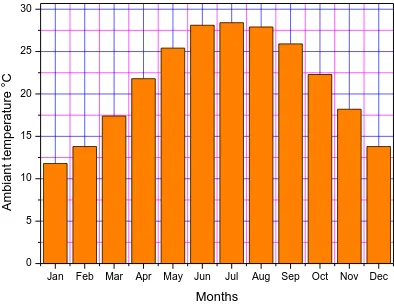
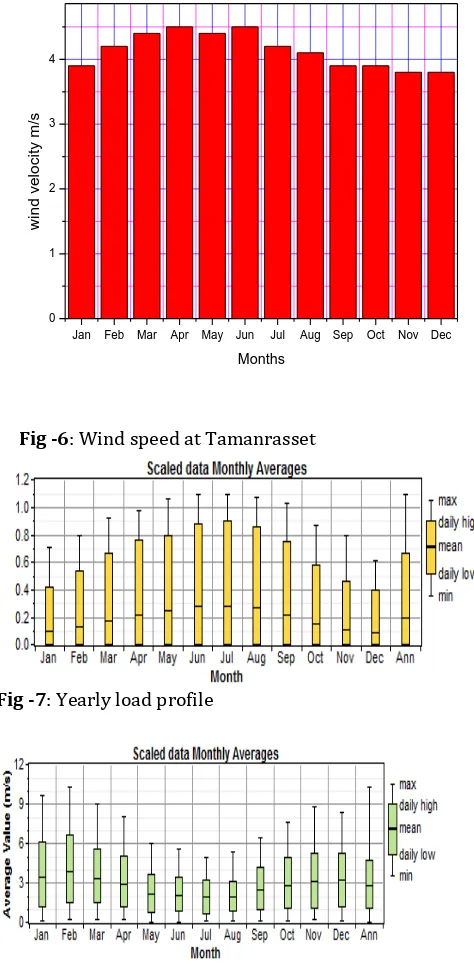
However, information on renewable energy sources such as solar and wind data is presented in Figures 2, 3, 4, 5 and 6.
Fig -2: Sun trajectory and sunshine in Tamanrasset.
Fig -3: Profile of global irradiation in Tamanrasset
Fig -4: Tamanrasset diffuse radiation
Fig -5: Ambient temperature in Tamanrasset
Jan Feb Mar Apr May Jun Jul Aug Sep Oct Nov Dec
0 50 100 150 200 250 300 350
G
lo
b
a
l
Ir
ra
d
ia
ti
o
n
W/
m
2
Months
Jan Feb Mar Apr May Jun Jul Aug Sep Oct Nov Dec
0 20 40 60 80
D
if
fu
s
e
W
/m
2
Months
Jan Feb Mar Apr May Jun Jul Aug Sep Oct Nov Dec
0 5 10 15 20 25 30
Am
b
ia
n
t te
m
p
e
ra
tu
re
°C
[image:2.595.319.520.112.266.2] [image:2.595.39.271.211.320.2] [image:2.595.318.511.312.461.2] [image:2.595.40.244.459.616.2] [image:2.595.322.519.555.709.2]© 2017, IRJET | Impact Factor value: 5.181 | ISO 9001:2008 Certified Journal
| Page 3
Fig -6: Wind speed at TamanrassetFig -7: Yearly load profile
Fig -
8
: Yearly landfill profile2.2 The simulation steps by HOMER
We have defined each element of our facility based on all the characteristics and data provided.
The diagram is shown in Fig 4.
Fig -9: Hybrid system architecture on HOMER
The hybrid system model presented by HOMER can be simulated by introduction of many factors such as the cost of components, the availability of resources. Another major factor in this digital implementation is evaluation of the project life which is estimated for 25 years. Calculations presented by the software take into account the investment capital, depreciation, operating costs, maintenance costs, replacement costs and the fuel cost. All its estimates are part of proper functioning of studied system.
3. REVIEW OF OPTIMIZATION PROBLEM AND ITS
PROPOSED SOLUTION
3.1 Adopted models of individual sources
The paragraph below presents a brief model of power generated by the following individual sources: solar, wind, and mini-hydro generators.
Analytical model of Solar Energy Generation
According to previous works done by [5][6][7][8], the model of power generated by a PV module can be given by the formula below:
( )
[ (
)] ( ) ( )
Where nr is the reference module efficiency, Tcref is reference cell temperature in degree Celsius, A (m2 ) is the PV generator area and G(t) is the solar irradiation in tilted module plane (Wh/m2 ), β is the temperature coefficient, Tc is the cell effective temperature.
Analytical model of Wind Energy Generation
The model of wind power can be derived from works done [9][10][11] as follow:
Jan Feb Mar Apr May Jun Jul Aug Sep Oct Nov Dec 0
1 2 3 4
w
in
d
v
e
lo
c
it
y m
/s
[image:3.595.38.275.113.601.2]© 2017, IRJET | Impact Factor value: 5.181 | ISO 9001:2008 Certified Journal
| Page 4
( )
( ) ( )
Where:
Cp is the coefficient of performance also called power coefficient
A is the swept area by the turbine’ blades (m2 )
is the air density (kg/m3 )
is the wind speed (m/s)
Analytical model of Mini-hydro generators
The general formula for the determination of hydraulic power is shown by[12] [13][14] as follow:
( ) ( )
Where: is the mechanical power produced at the turbine shaft (Watts), is the density of water (1000 kg/m3 ), g is the acceleration due to gravity (9.81 m/s2 ), Q is the water flow rate passing through the turbine (m3 /s), H is the effective pressure head of water across the turbine (m) and ŋt is the efficiency of the turbine.
3.2 Assumption
With reference to[11] the following assumptions are made:
Each module is considered independent at the construction level and therefore their various cost of electricity will be estimated separately.
There exist numbers Ns , Nw and Nh representing respectively the total number of solar plant, wind power plant and mini-hydro power plant respectively in existence.
3.3 Optimization problem formulation
Considering the unit costs of electricity Cus, Cuw, Cuh, generated respectively by the solar, wind and hydropower plants, the cost of electricity generated by the hybrid energy system over a period of time T was expressed in the previous paper, [11], as follows:
ŋ ( ) ( ) ( )
The unit cost of electricity is further evaluated based on equation 5 below:
( )
Where Cc represents the capital cost of investment, CRF is the capital recovery factor, Co is the operation and maintenance cost and ET is the total energy generated over a year.
The objective function is given as follow (4) Minimize CE subjected to the following constraints:
1- The power generated by the hybrid system should meet the demand at any given time as expressed below:
( ) ( ) ( ) ( ) ( )
2- The total power generated should be within range of minimum and maximum power that can be generated
( ) ( ) ( ) ( )
3- Variables should also stay between bounds as follow
{
(8)
With the assumption that the irradiation G, the wind velocity Vw and the water flow Q are all constant during the period T, the problem was considered as a linear optimization function subjected to linear inequalities constraints.
3.4 Proposed solution
The solution to the above optimization problem is constructed around the linprog function of Matlab and can be described by the following algorithm.
1. Initialize an index variable to N that will serve for iteration.
2. Get the input load data, wind velocity, solar irradiation and hydro data (water flow and total head) as well as necessary data to evaluate the unit cost of electricity per individual sources
3. Calculate the power generated by individual sources of renewable energy generator using the models described above
4. Create decision variables for indexing
5. Define lower and upper bounds for all variables
6. Define linear equality and linear inequality constraints 7. Define the objective function
8. Solving the linear optimization problem with the function linprog of Matlab
9. Save result
© 2017, IRJET | Impact Factor value: 5.181 | ISO 9001:2008 Certified Journal
| Page 5
11. If index N is less than or equal to12 (for the twelve months in a year), repeat processes from 2 to 10 , 12. Display result
13. Stop
3. RESULTS AND DISCUSSIONS
The simulation of our hybrid system by HOMER gives us the optimal combination of elements of hybrid system. It is presented according to a net present value (NPC) and according to different technical system constraints. Our case deals with a simulation of an hybrid system that contains two renewable energies, photovoltaic and wind energy sources, and another diesel generator, with presence of batteries and converters, this system is isolated from the grid (off grid system).
After several iterations, HOMER gives the best technical-economic solution of the proposed system. Fig.5
Fig -10: Optimal solution given by HOMER
Each generator produces energy individually; In figure.11, the contribution of each source to overall production of studied system, can be seen.
Fig -11: Average power produced by each source
[image:5.595.323.545.398.463.2]Tab.1; Presents the rate of electric power generation for each generator throughout the year.
Table -1: Annual Energy produced by each Generator
Production Kwh/y %
PV 14.736 22
Wind 36.873 54
G.Diesel 16.076 24
Total 67.685 100
From Table 1, it can be seen that the production of energy by hybrid system during a full year of operation ensures continuity and availability. It can be seen that more than 70% of energy is produced by renewable energy generators (54% for wind and 22% for photovoltaic panels), which contributes to the reduction of greenhouse effect on our planet. There is a variation in energy production for each generator throughout the year, it appears that the wind generator participates with a great power produced in the autumn and winter season; this power decreases with the decrease in wind speed during spring and summer. However, the photovoltaic generator production increases with evolution of solar irradiance and duration of sunshine. Production of diesel generator develops to meet demand for load and to compensate the discontinuous and random nature of renewable energies. Energy production study for each generator is illustrated as follows.
4.1 Photovoltaic Generator
The operating parameters of photovoltaic generator are shown in the following table 2:
Table -2: Information about photovoltaic generator
Variable Value
Operational time 4.358h/y
Average power produced 1.7kw
Maximum power produced 10.4kwh
[image:5.595.39.288.421.565.2]Total energy production 14.91kwh/y
Fig. 12 shows a DMAP presentation of energy production by photovoltaic generator, this type of graph shows one year of hourly data, each hour of year is presented by a color that simulates precise information of a Value of data. This presentation makes it possible to see more clearly the information useful for an easy and concrete interpretation.
Fig -12: DMAP of hourly production by photovoltaic generator
[image:5.595.309.559.561.658.2]© 2017, IRJET | Impact Factor value: 5.181 | ISO 9001:2008 Certified Journal
| Page 6
generators or use of energy stored in batteries to meet theload demand.
4.2 Wind Generator
The operating parameters of wind generator are shown in Table 3:
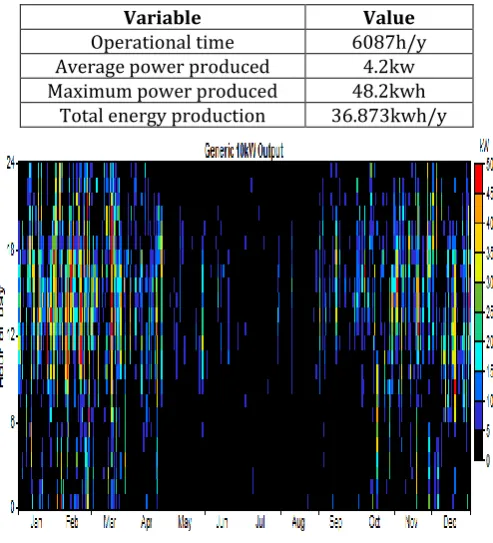
Table -3: Information about energy production by wind generator
Variable Value
Operational time 6087h/y
Average power produced 4.2kw
Maximum power produced 48.2kwh
Total energy production 36.873kwh/y
Fig -13: DMAP of hourly production by photovoltaic generator
As shown in Fig. 13, the wind generator runs all day, which is well shown in the DMAP graph. The production of wind energy has benefited from the great values throughout the autumn and winter months, which is well translated by clear colors, unlike the month of spring and summer where the wind speed decreases , Wind production decreases in parallel.
4.3 Diesel Generator
The operating parameters of diesel generator are shown in following table
Table -4: Information about energy production by diesel generator
Variable Value
Operational time 4.308h/y
Average power produced 3.73kw
Maximum power produced 10kwh
Fuel used annually 7465L/y
Specific use of fuel 0.464L/kwh
[image:6.595.310.558.121.330.2]Total energy production 14.91kwh/y
Fig -14: DMAP of hourly production by DG
From Fig.14, diesel generator works as a back-up tool and participates in energy generation when energy generation from renewable energy decreases.
5. CONCLUSIONS
Work presented in this paper concerns hybrid systems with multiple sources of electric power, for autonomous operation to reduce greenhouse gas emissions and reduce the high cost of supplying electric power in remote sites, where the extension of conventional power lines is costly. Hybrid systems based on renewable energy seem to be of considerable importance. Our work has therefore focused on the optimization by Homer software of an autonomous hybrid system (photovoltaic-wind-diesel) with an energy storage device. The simulation example is applied to a region of the city of Tamanrasset, the global load data, wind speed, solar radiation and fuel cost are used as entered for the software. The results obtained favor the installation of wind turbines and photovoltaic panels, with the presence of batteries and diesel generator as a perfect solution for the generation of energy in this precise place.
REFERENCES
[1] Deshmukh, M. K., S.S (2008) “Modelling of hybrid renewable energy systems. Renewable and sustainable energy reviews, 12(1), 235-249.
[image:6.595.40.287.211.483.2]© 2017, IRJET | Impact Factor value: 5.181 | ISO 9001:2008 Certified Journal
| Page 7
[3] Ekren, O,B. Y. (2008) ‘Size optimisation of a PV/windhybrid energy conversion system with battery stocage using response surface methodology’ Applied energy , 85(11), 1086-110
[4] Afif.b , T.Allaoui,A.Chaker, A.Benamou” Numerical Simulation of Solar on Grid Plan in Tamanrasset”
International Review of Automatic Control (I.RE.A.CO.), Vol. 8, N.3
[5] Acakpovi, A., Hagan, E. B. 2013. Novel Photovoltaic
Module Modeling using Matlab/Simulink,
International Journal of Computer Applications (IJCA)
Vol. 83, No.16,pp 27-32.
[6] Villalva, M., G., Gazoli, J.R., and Filho. E.R. 2009.Comprehensive Approach of Modeling and Simulation of a Photovoltaic Arrays. IEEE Transaction on Power Electronics. Vol.24. No.5. pp. 1198-1208. [7] Ramos-Paja, C.A., Perez, E., Montoya, D.G.,
Carrejo,C.E., Simon-Muela, A., Alonso, C. 2010. Modelling of Full Photovoltaic Systems applied to Advanced Control Strategies. Columbia: Universidad Nacional de Columbia.
[8] Tsai, H.L., Tu, C.S., and Su, Y.J. 2008. Development of
Generalized Phottovoltaic Model Using
MATLAB/SIMULINK. Proceedings on the world
congress on Engineering and Computer
Science.WCECS, ISBN: 978-988-98671-0-2, 6p. [9] Khajuria, S., and Kaur, J. 2012. Implementation of
Pitch Control of Wind Turbine using Simulink (Matlab). International Journal of Advanced Research in computer Engineering and technology (IJARCET),
vol.1, ISSN: 2278-1323.
[10]Abbas, F. A. R., Abdulsada, M. A. 2010. Simulation of
Wind-Turbine Speed Control by MATLAB.
International Journal of Computer and Electrical Engineering. Vol. 2, No. 5, 1793-8163p.
[11]Acakpovi, A., Hagan, E. B. 2014. A Wind Turbine System Model Using a Doubly-Fed Induction Generator (DFIG). International Journal of Computer Applications (IJCA). Vol. 90, No.15, pp 6-11.
[12]Fuchs, E.F., Masoum, M.A.S. 2011. Power Conversion of Renewable Energy Systems. Springer. ISBN 978-1- 4419-7978-0.
[13]Hernandez, G.A.M., Mansoor, S.P., Jones, D.L. 2012. Modelling and Controlling Hydropower plants. Springer.DOI 10.1007/978-1-4471-2291-312. [14]Naghizadeh, R.A., Jazebi, S., Vahidi, B. 2012. Modelling
Hydro Power Plants and Tuning Hydro Governors as an Educational Guideline. International Review on Modelling and Simulations (I.RE.MO.S), Vol. 5, No. 4.
BIOGRAPHIES
Benameur Afif was born in Tiaret in Algeria, in 1976. He received his BS degree in electronics engineering from University of Tiaret (Algeria) in 2001, the MS degree in engineering control from University of Tiaret (Algeria) in 2008, and the PhD degree in engineering control from ENSET (Algeria) in 2012. His research interests are non linear control and observers applied in induction motor.
Elhamrani Eamamadan University of Grenoble
France 1988, Department of Eeletrical and Eletronic Engineering Magisterial 2003, university of Tatarstan Kazan Russia.
And 2013 Polythic Military schools Algeria.
Amina Benhamou: born in Tlemcen , Algeria,
June.08th ; 1974, Organization: Boumerdes
University, Algeria. Doctor; maitre de conference; chief of groups; research Laboratory
Experience: Large experience in research, CDER , UDES, engineering in Sonatrach