© 2018, IRJET | Impact Factor value: 6.171 | ISO 9001:2008 Certified Journal | Page 2248
Evaluation and Comparision of Response Reduction Factor (R Value)
by Pushover Analysis and Response Spectrum Analysis of Irregular
Buildings
L.R.Wankhede
1, Prateek Nikose
21Assistant Professor, Department of Applied Mechanics, Government College of Engineering, Amravati, Maharashtra, India
2P. G. Student, Department of Applied Mechanics, Government College of Engineering, Amravati, Maharashtra, India
---***---Abstract: Design of the building to remain elastic during strong ground motion is not economical. Hence some inelastic/non-linearity is introduced in building by considering Response Reduction Factor (R value). Various countries' seismic representation codes include the nonlinear reaction of a structure by introducing Response reduction factor (R value). There is no justification given for the value of R adopted in seismic representation codes in India(IS: 1893-2000) hence it is challenging to advance the practice of force-based seismic design without such basis. In terms of ductility and over strength, IS 1893 (2000) does not segregate the components of R explicitly. Also, it does not particularize any devaluation in the response reduction factor in consequence of any deviation (in elevation or in the plan). Presently, efforts have made in evaluating the actual value of Response Reduction Factor (R) of reinforced concrete special moment resisting frame (SRMF) with an exception in elevation by using Nonlinear Analysis and Linear dynamic Analysis and compare it with IS code values. Results of nonlinear analysis and linear dynamic analysis show that the value of (R) response reduction factor was smaller than the values defined in the IS 1893 seismic codes. Thus, it needs a strong observed evaluation of R values which will result in moderate design.
KEY WORDS: Vertical, Plan irregularity, Over strength factor, Ductility factor, Response Reduction Factor, Pushover analysis, Response Spectrum analysis.
1. INTRODUCTION :
An element that counters the seismic force in a building is acknowledged as lateral force resisting system (L.F.R.S.). The L.F.R.S of a building has different models; most common of them in a structure are the special moment resisting frames, shear walls, and the frame shear wall dual systems.
Generally, the damage in a structure occurs at a location of the structural weak planes exists in the building system, which in turn triggers the structural deformation leading to structural collapse. These weaknesses often transpire due to the presence of the structural inconsistencies in stiffness, strength, and mass in a building system.
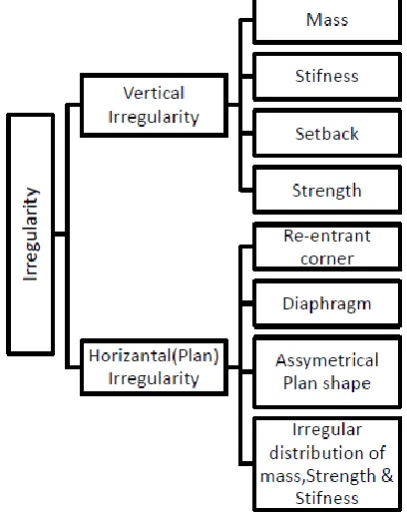
The structural anomaly can be categorized as plan and vertical irregularities. In fact, many existing buildings contain irregularity and some of them have designed to be irregular to fulfill different functions. Example, basements were created by eliminating central columns for commercial purposes. Also, resulted in irregular distributions of stiffness, mass and strength along the building height due to the devaluation in the size of beams and columns in the upper storeys to fulfill functional requirements and for different commercial purposes such as storing heavy mechanical appliances etc.
[image:1.595.323.527.468.728.2]Auxiliary, many other buildings are concluded irregular due to a variety of reasons like discrepancies in construction practices and material used. Such a case can be considered as the horizontal irregularity in a building. The detailed classification of structural inconsistency is presented in Fig-1
© 2018, IRJET | Impact Factor value: 6.171 | ISO 9001:2008 Certified Journal | Page 2249
2. RELATED WORK :
Bholebhavi Rahul and Inamdar (2016) has estimated the actual value of response reduction factor (R) of G+10 storied Special moment resisting frame RC buildings with irregularity in elevation and plan by using non-linear static pushover analysis and compared it with IS code values. Conclusions were made such that, the evaluated value of “R” of building with horizontal irregularities were comparatively lesser than the value specified in the IS 1893. Higher the percentage of horizontal irregularities, lower the response reduction factor. Same goes for the percentage of vertical irregularities.A structure with gradual irregularities in elevation does not show considerable deviation in response reduction factor.
Divya Brahmavrathan and C. Arunkumar (2016) have focused on the evaluation of the actual value of R for stepped buildings. Stepped buildings having 3,6 and 9 storeys having both ordinary RC moment resisting frame and special RC moment resisting frame are considered for the Nonlinear static pushover analysis. Conclusions were made such that, the actual value of the R factor was comparatively lesser than the value assumed during the design process and the value decreases with the increase in the number of storeys. Certain percentage devaluation in the response reduction factor has to be considered for irregular buildings.
Tia Toby and Ajesh K. Kottuppillil (2015) considered two types of frame models; Irregular frames and Regular frames. Each of them was modeled for SMRF and OMRF. The nonlinear static analysis was directed on regular and irregular RC frames considering OMRF and SMRF to determine the response reduction factor. Conclusions made by him were such that, the SMRF frames shows the highest R-value which is close to the IS 1893(2002) proposed the value of 5 also OMRF gives a value almost closer to 3 for the frame having mass irregularity. The impact of considering confinement mainly drives to the design of SMRF and OMRF.
Apurba Mondal, Siddhartha Ghosh, G.R. Reddy In this paper author concentrates on estimating the original value of R for realistic RC frame building design and described following the Indian standard for that they make the model of G+2, 4,8,12 storeys RC frames and analysis was carried out with a nonlinear static method using static pushover analysis. The results conclude that the Indian standard recommendation for a higher value R than definite value of R is potentially less.
3. RESPONSE REDUCTION FACTOR:
An earthquake releases the high measure of energy in a short period hence the structures outlined to resist mediocre temblors must be able to dissolve the considered amount of imported energy by the ductile behavior and also restrain the deformations via
transferring force by lateral stiffness in ground movements to the foundation. Braced frame systems have elastic properties which provide stiffness and strength in order to satisfy multiple design aspirations that are determined by the performance of non-structural elements. The codes anticipated by the current force-based design procedure causes an inelastic deformation of the structures in strong seismic events, therefore, such inelastic behavior is usually incorporated into the design by dividing the elastic spectra by a factor R reducing the spectrum from its original elastic demand level to a design level. Structural ductility and over strength capacity is the crucial constituent in defining the response reduction factor. The response reduction factor can be expressed
R= Rs* Rµ* Rr* Rξ
Where, Rs is the strength factor, Rµ is the ductility factor, Rξ is the damping factor, and Rr is the redundancy factor. Components of “R” are discussed in following sections.
3.1 Strength factor (Rs)
The additional strength beyond the design strength is called the overstrength. Most structures display considerable overstrength. Sequential compliance of critical regions, material overstrength, strain hardening, capacity reduction factors are the origins of overstrength (Rs). Overstrength can be employed to degrade the forces used in the design, hence leading to more economical structures. Confinement of concrete, strength contribution of non-structural elements and special ductile detailing are also the sources of overstrength.
𝑅𝑠= 𝑉𝑢/𝑉𝑑
where Vu is the maximum base shear and Vd is the design base shear
3.2 Ductility factor (Rµ)
Ductility of a structure or its members, is the capacity to support large inelastic deformations without significant loss of strength or stiffness. For seismic load structures, ductility is a crucial property. Ductile structures perform better than the brittle structures. Structures with high ductility can withstand large deformations and allow the structure to move under high potential strength, in turn, dissolving a large amount of energy. The amount of inelastic deformation encountered by the structural system subjected to a given ground motion or a lateral loading is given by the displacement ductility ratio “µ” and it is represented by the ratio of maximum absolute displacement to its yield displacement.
𝜇=Δ𝑢/Δ𝑦
Rμ = 1 for T < 0.2 s
© 2018, IRJET | Impact Factor value: 6.171 | ISO 9001:2008 Certified Journal | Page 2250
Rμ = μ for T > 0.5 s
3.3 Damping factor (Rξ)
The damping factor (Rξ) deems the impact of ‘added’ adhesive damping and is essentially applicable for structures provided with additional energy dissipating devices. If such devices do not exist then the value for damping factor is considered equal to 1.0 and is eliminated from the explicit components of response reduction factor used in force-based design procedures.
3.4 Redundancy factor (Rr)
The redundancy factor Rr is a measure of repetitions in a lateral load resisting system. The moment resisting frames, shear walls or their aggregates are the most chosen lateral load resisting systems in RC structures. Central frames are constructed for gravity loads, at times and perimeter frames are constructed as lateral load resisting systems hence the repetition in lateral load resisting system rely upon the structural system chose. The reinforced concrete structural system with multiple lines of lateral load resisting framing systems is generally considered in the category of redundant structural systems because the frames are outlined and described to transfer the earthquake-induced inertia loads to the foundation.
[image:3.595.348.506.80.221.2]The lateral load is yielded by different frames relying on the relative stiffness and strength characteristics of respective frames for redundant framing systems. When uncorrelated (independent) the reliability of framing system is higher for a structure with multiple lines of frames but reduces when resistance parameters are perfectly correlated. ASCE 7 recommends a redundancy factor Rr = 1.0 for systems with parallel frames and the corresponding is adopted for this work as the case study structures fall in this category.
Table 1: Redundancy factor (Rr) from ATC.
Lines of vertical framing Drift Redundancy factor
2 0.71
3 0.86
4 1.0
4. STRUCTURAL MODELLING :
Three reinforced concrete 3D framed structures having the same number of bays, but different number of storeys are considered in this study as shown in fig. 2
Fig 2. Shows the plan of all the 3 structures
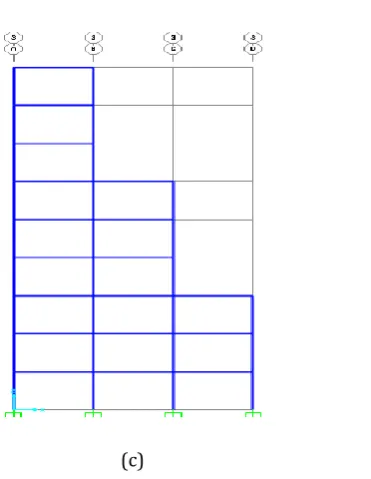
Three, six and nine storey models were created for SMRF case. Each storey height is 3 m and the total width of the building in X-direction is 15 m and the total width in Y-direction is 12 m. The building elevation for 3, 6 and 9 storey models is shown in Figure 4.1. For the 6 storey model, the number of storeys within each step increases to 2 and similarly for 9 storey model, the number of storeys within each step increases to 3. The plan views at each step level changes as there is a reduction in the number of bays in the X –direction as the height of the building increases as shown in fig. 3
(a)
[image:3.595.38.282.557.657.2]© 2018, IRJET | Impact Factor value: 6.171 | ISO 9001:2008 Certified Journal | Page 2251
(c)
[image:4.595.95.281.78.318.2]Fig. 3 shows the elevation of (a) 3 storey, (b) 6 storey and (c) 9 storey
Table - 2 : Properties
Type of soil Hard Soil
Grade of concrete M25
Grade of reinforcing steel Fe-415 Imposed load on storeys 4 kN/m2
Live Roof 1.5 kN/m2
Unit weight of RCC 25kN/m3
Response spectra IS 1893(I) 2002
Seismic zone V
Response reduction factor 5
Importance factor 1
Elastic material properties are taken as per IS 456:2000
Sectional properties :
Table – 3 Sectional properties
3
Storey(mm) Storey(mm) 6 Storey(mm) 9
Beam 300x400 300x450 300x450
Column 400x400 450x450 550x550
Slab 150 150 150
5. SEISMIC ANALYSIS
It is mandatory to accomplish the seismic analysis of a structure to conclude the seismic responses. External action, the behavior of structure, and the kind of structural design selected is the key to this analysis. Also, on the basis of external action and the behavior of the structure, the analysis is further categorized as (1) Linear Static Analysis, (2) Nonlinear Static analysis, (3) Linear Dynamic analysis, and (4) Nonlinear Dynamic analysis. The linear static method is applied in the analysis of the regular structures with limited height and linear dynamic analysis can be accomplished by response spectrum method. The differentiation of linear static and linear dynamic analysis is done on the basis of the level of forces and their distribution along the height of the structure, hence nonlinear static analysis is introduced that allows the inelastic behavior of the structure and also it is solely responsible to describe the tangible behavior of structures during an earthquake. The approach is based on the direct numerical integration of the differential equations of the motion by acknowledging the elasto-plastic disfigurement of the structural element.
5.1 Non-Linear Static Analysis (Pushover Analysis):
The static nonlinear analysis shows the interpretation of permanent vertical loads and gradually developing lateral loads.
The corresponding static lateral loads closely represent the earthquake-induced forces hence any premature failure or weakness in a structure would be signified by nonlinear analysis as it obtains a plot of total base shear versus the top displacement in a structure. The analysis was not that successful as it enables the certainty of collapse load and ductility capacity. The plastic rotation is monitored on a building frame and the lateral inelastic force versus displacement response is computed analytically allowing the analysis of weakness in the structure. On the basis of such studies, the decision to reconstruct can be taken.
Seismic analysis of buildings can be characterized on the basis of the refinement of modeling adopted for the analysis. Nonlinear static analysis can be used to analyze the buildings that are loaded beyond the elastic range, but it will not be suitable for capturing the dynamic responses especially the higher mode effects. Reliability of building strength can be determined by the nonlinear analysis as in this analysis the capacity curve can be compared with the design spectrum.
5.2 Linear Dynamic (Response Spectrum):
[image:4.595.38.286.375.564.2]© 2018, IRJET | Impact Factor value: 6.171 | ISO 9001:2008 Certified Journal | Page 2252
choose the response of any linear system, given its natural frequency of oscillation as in evaluating the peak response of the buildings to the earthquake. Some values of the ground response spectrum (calculated from recordings of surface ground motion from seismographs) can be used in the study of strong ground motion for the correlation with the seismic damage. The steady-state result is recorded, if the input used in calculating a response spectrum is steady-state periodic.
The response will be infinite if damping is not present. The peak response is recorded for temporary input such as seismic ground motion. Some level of damping is usually assumed, but the value must be taken even with no damping. Response spectra can also be employed in evaluating the response of linear systems with multiple modes of oscillation (multi-degree of freedom systems), however, they are majorly accurate for low levels of damping.
Modal analysis helps in identifying the modes and the response can be accumulated from response spectrum in that mode hence total response is determined via combining these peak responses. If the modal frequencies
are not close then the square root of the sum of the squares (SRSS) method is being used. The results would be different from the results obtained directly from an input as the phase information is lost in the process of generating the response spectrum. The major bottleneck of response spectra is that it could only be universally applicable for linear systems. Response spectra have created for non-linear systems with the same nonlinearity. For generating non-linear seismic spectra attempts were made with the broader structural application, but the results could not be associated with the multi-mode response.
6. RESULTS AND DISCUSSION :
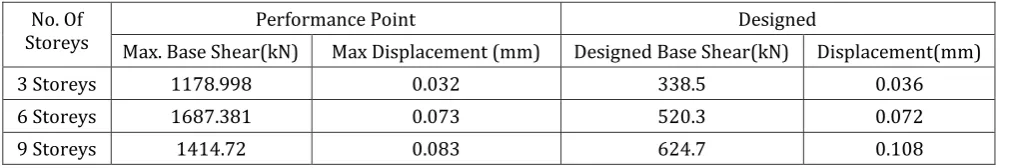
[image:5.595.48.554.397.481.2]The Non-Linear Static and Linear Dynamic Analysis was performed on a set of models for special moment resisting frame models (each with 3, 6 and 9 storeys). The performance point for each case was obtained as per ATC-40. Using this performance point, an approximate value of the response reduction factor was estimated The values obtained for SMRF models in both the cases that are Non-Linear Static and Non-Linear Dynamic are shown in Table 4 and Table 5.
Table 4. Results obtained by Non-Linear Static Analysis
No. Of
Storeys Max. Base Shear(kN) Performance Point Max Displacement (mm) Designed Base Shear(kN) Displacement(mm) Designed
3 Storeys 1178.998 0.032 338.5 0.036
6 Storeys 1687.381 0.073 520.3 0.072
9 Storeys 1414.72 0.083 624.7 0.108
Table 5: Results obtained Linear Dynamic Analysis
No. Of Storeys
Performance Point Designed
Max. Base Shear(kN) Max Displacement (mm) Designed Base Shear(kN) Displacement(mm)
3 Storeys 517.3 0.01313 338.5 0.036
6 Storeys 636.286 0.027 520.3 0.072
9 Storeys 723.4 0.0426 624.7 0.108
Table 6 : Value of R factor for SMRF models studied
No. Of
Storeys Over Strength Factor (Rs) Ductility Factor (Rμ) Redundancy Factor (Rr) Factor (Rξ) Damping
Response Reduction Factor (R)
Non-Linear Static Analysis
3 Storeys 3.5 1.118 1 1 3.913
6 Storeys 3.243 0.986 1 1 3.198
9 Storeys 2.27 1.3 1 1 2.945
Linear Dynamic
Analysis
3 Storeys 1.53 2.74 1 1 4.19
6 Storeys 1.22 2.63 1 1 3.211
© 2018, IRJET | Impact Factor value: 6.171 | ISO 9001:2008 Certified Journal | Page 2253
7. CONCLUSIONS:
Following are the salient conclusions obtained from the present study:
1. A constant value of “R” for any case of building cannot be justified. Well-defined methods are required to find out the “R” value accounting for strength, ductility, redundancy and damping for any particular building; present work takes efforts in the same line of action.
2. The response reduction factor (R) is overestimated in indian standard code, which leads to the potentially dangerous underestimation of the design base shear.
3. With the increase in the number of stories, The value of the response reduction factor decreases.
4. The values of R provided in IS 1893 for SMRF structures is much greater than the actual value of the response reduction factor for stepped building frames
5. There is a need to reduce the R factor given in IS 1893 for irregular buildings. The corresponding ductility and over strength factors also need to be mentioned.
6. A response reduction factor for structures having sudden vertical irregularities are less than those specified in the IS 1893.
REFERENCES
[1] Divya Brahmavrathanand C. Arunkumar “Evaluation of Response Reduction Factor of Irregular Reinforced Concrete Framed Structures” IJRET: International journal of research in engineering and technology. June 2016
[2] Bholebhavi Rahul D., Inamdar V.M. “ An Evaluation of Seismic Response Reduction Factor for Irregular Structures Using Non Linear Static Analysis” IJRET: International journal of research in engineering and technology. May 2016.
[3] Rutvik K. Sheth, Dr. Devesh P. Soni, Minoli D. Shah “Adaptive Pushover Analysis of Irregular RC Moment Resisting Frames” ICRISET2017. International Conference on Research and Innovations in Science, Engineering &Technology 2017
[4] Tia Toby and Ajesh K. Kottuppillil “ Evaluation of Response Reduction Factor using Nonlinear Analysis” IJIRST –International Journal for Innovative Research in Science & Technology| Volume 2 November 2015
[5] Anil K. Chopra; and Rakesh K. Goel “A modal pushover analysis procedure to estimate seismic demands for unsymmetric-plan buildings” Earthquake Engng Struct. Dyn. 2004
[6] Shinde D.N, Nair Veena V, Pudale Yojana M, “Pushover analysis of multi-story buildings” IJRET: International journal of research in engineering and technology. May 2014.
[7] Mondal. A., Ghosh. S. Reddy. G.R “Performance-based evaluation of the response reduction factor for ductile RC frames”, Engineering Structures, 56 (2013) 1808–1819, 2013.
[8] Tande. S.N, Ambekar. R.V,” An Investigation of Seismic Response Reduction Factor for Earthquake Resistance Design” International Journal of Latest Trends in Engineering and Technology (IJLTET) ISSN: 2278-621X Vol.2 Issue 4 July 2013.
[9] Kim, J., and Choi, H., “Response Modification Factors of Chevron-Braced Frames” Engineering Structures, 27, 2005.
[10] Devesh P, Bharat B. Qualitative review of seismic response of vertically irregular building frames. ISET Journal of Earthquake Technology. 2006 Dec; 43(4):121–32.
[11] Mr. Bhavin Patel and Mrs. Dhara Shah “Formulation of Response Reduction Factor for RCC Framed Staging of Elevated Water Tank using Static Pushover Analysis” Proceedings of the World Congress on Engineering 2010 Vol 3 WCE 2010
[12] ATC 40 (1996),“Seismic Evaluation and Retrofit of existing concrete buildings”, Applied Technical Council, Redwood City (CA), 1996
[13] I.S. 456: Plain and reinforced concrete – code practice, New Delhi (India), 2000