http://dx.doi.org/10.4236/jcc.2016.43017
Radar Imaging of Sidelobe Suppression
Based on Sparse Regularization
Xiaoxiang Zhu, Guanghu Jin, Feng He, Zhen Dong
Institute of Space Electronic and Information Technology, School of Electronic Science and Engineering, National University of Science and Technology, Changsha, China
Received 21 January 2016; accepted 26 February 2016; published 2 March 2016
Abstract
Synthetic aperture radar based on the matched filter theory has the ability of obtaining two-di- mensional image of the scattering areas. Nevertheless, the resolution and sidelobe level of SAR imaging is limited by the antenna length and bandwidth of transmitted signal. However, for sparse signals (direct or indirect), sparse imaging methods can break through limitations of the conven-tional SAR methods. In this paper, we introduce the basic theory of sparse representation and re-construction, and then analyze several common sparse imaging algorithms: the greed algorithm, the convex optimization algorithm. We apply some of these algorithms into SAR imaging using RadBasedata. The results show the presented method based on sparse construction theory out-performs the conventional SAR method based on MF theory.
Keywords
Matched Filtering, Sparse Representation, Sparse Reconstruction, Convex Optimization, Greed Algorithm
1. Introduction
Due to the properties of all weather and day-night imaging [1], Synthetic aperture radar (SAR) plays an impor-tant role in military and civilian applications, such as earth observation, topographic mapping, target recognition, remote sensing and flight navigation etc [2]-[4]. The basic theory can be easily demonstrated that the radar emits a sequence of pulses along its moving path and receives the echoes (raw data) scattered from the interested tar-gets. And then, we can complete the high resolution imaging of the scattered areas by managing with the raw data.
filtering (MF) theory have some apparent disadvantages:
1) The bandwidth of original transmitted signal decides the resolution of the range direction. The antenna length decided by the radar system determines the resolution of the azimuth direction. Therefore, we have great difficulty to achieve the high resolution SAR images with a low bandwidth signal and a short synthetic aperture length.
2) Limiting by the Nyquist rate, a large amount of SAR raw data will be collected which brings to a heavy burden to the radar system naturally.
3) The radar images obtained by conventional SAR imaging algorithm have a severe sidelobe which is a con-siderable problem to overcome.
In recent years, with the development of compressed sensing (CS) theory [7] [8], it provides an opportunity to image the sparse signals and break through the limitation of conventional SAR algorithm. Inspired by the CS theory, many methods for SAR imaging have been reported. The CS method to construct sparse signals has at-tracted more and more attention recently. The imaging process of SAR based on CS theory can be that firstly using matched filter method to complete image construction and lastly removing the convolution kernel based on sparse characteristics of scattering coefficients of the target in the scene. The pre-condition of exact recovery by sparse construction is that the signal is sparse or compressible in some domain, including time, frequency, space etc.
Some of the applications in radar field are listed as following. Compressive sensing data acquisition and im-aging system had been applied in Ground Penetrating Radar (GPR). Through-wall radar imim-aging with the simi-lar theme had been presented. By transmitting a noise-like signal (specially designed signal), the theory of CS with random convolution was used and high resolution radar was proposed. We can realize the fact that CS has got more and more attention and been more and more popular in radar applications, including relaxation of re-quired measurements, improvement the resolution of radar system, reduction of sidelobe, and suppression of noise.
In some special applications (such as detection of ship on the sea, lights along the airline roads, and distribu-tion of scattering points of warhead etc.), the main scattering targets appear in a sparse way over a big observed scene. The number of dominant scatters is much smaller than the total size of observed scene. In such a situation, SAR raw echo can be regarded as a sparse signal. Obviously, sparse construction method can be applied in SAR imaging widely. In order to explain what kind of method is more accurate, we apply the conventional method and sparse construction method into SAR imaging. The conventional MF method and the sparse construction method are compared in the same situation. The sparse construction method includes OMP, CoSaMP, LASSO, BP etc. Some numerical simulations are presented to evaluate the best method for SAR imaging. The indicators we take to evaluate the quality of SAR imaging include resolution of azimuth and range, sidelobe level and computation complexity etc.
The reminder of the paper is organized as follows. In Section 2, we give a brief description of basic theory of sparse representation and reconstruction. In Section 3, sparse SAR signal imaging through conventional method and sparse method is implemented and we analyze the imaging quality of different method. In Section 4, we get a conclusion that sparse method of BP is a good method for improving resolution and reducing the sidelobe ob-viously. At the same time, we propose some directions to discover in the following days.
2. Basic Theory of Sparse SAR Imaging
2.1. Sparse Representation and ReconstructionIf the signal only has a small number of nonzero vectors, then we consider it as a sparse signal. Usually, some signals is sparse in time domain, but in some transformdomain.
Considering a discrete signal vector s∈RN, we say that it is K-sparse if (the number of nonzero coefficients) at most K<<N in orthonormal basis or over-complete dictionary φ∈CN N× .
Therefore, the true information contained in signal s lives in at most K dimensions rather than N. The sparse signal s can be expressed as following.
r r r
s α φ
∈Γ
=
∑
(Γ ={1, 2,,M},αr) (1)s=Dα=M×N (D={ ,φr r∈ Γ}) (2)
where vector N
R
α ∈ is the weighting coefficient. Due to the signal s has a sparse representation in D, s can be approximated by the best sparse K term expression.
According to the CS theory, the signal to be measured is acquired by linear projections y= Φs. It will also make sense when the number M of signal s to be measured is smaller than N. Considering a linear measurement
matrix M N
C ×
Φ ∈ with M < N, the measured signal y can be described as following.
y= Φ = Φs Dα = Θα (3)
where Θ = ΦD is a M×N matrix. It is indeed possible to reconstruct the sparse signal by CS when the ma-trix Φ obey the Restricted Isometry Property (RIP) rule. The RIP rule requires that
2 2 2
2 2 2
(1−δk) ||α|| ≤ Θ|| α|| ≤ +(1 δk) ||α|| (4)
where α is a vector with k nonzero coefficients, and δ ∈k (0,1). The smaller the value of δk is, the better
the sparse signal can be recovered.
According to the existed theory, the k-sparse α can be recovered from the solution of an optimization prob-lem based on l0 norm.
0
ˆ arg min || ||
α = α s.t. y= Θα (5)
where l0 is the l0 norm of vector and represents the nonzero number of the vector.
However, the minimum l0 norm question is a NP-hard question. It is very difficult to list out all of the
k N
C chances of the nonzero value of α exhaustively. For this reason, a series of algorithms to solve the optimiza-tion quesoptimiza-tion appears, includes match pursuit (MP) method, iterative threshold method and the minimum
l
1 norm method etc.If the observed vector y and the measured matrix Θ are known, the signal s can be recovered from the solu-tion of a convex optimizasolu-tion problem based on l1 norm.
1
ˆ arg min || ||
α= α s.t. y= Θα (6)
If the noise is taken into consideration, the modified convex problem can be described as follows.
1
arg minλ α|| || s.t. ||y− Θα||2<ε (7)
where λ is a weighted coefficient and ε bounds the amount of noise in the measured data.
Recently, there are several sparse approximation algorithms to recover the sparse signal α from the mea-surement y with some noise. Such algorithms include basis pursuit (BP) and orthogonal matched pursuit (OMP) etc.
2.2. SAR Imaging through Sparse
The template is used to format your paper and style the text. All margins, column widths, line spaces, and text fonts are prescribed; please do not alter them. You may note peculiarities. For example, the head margin in this template measures proportionately more than is customary. This measurement and others are deliberate, using specifications that anticipate your paper as one part of the entire journals, and not as an independent document. Please do not revise any of the current designations.
In order to use sparse theory, a linear measurement model of SAR should be created. According to (7), in dis-crete scenarios the raw echo signal of SAR can be expressed as
[
]
2 1 2 2 0 0 2 0 0 1 1 ( ; ) ( ; )( , ) exp ( 2 ) 4
( ) ( )
2 2
exp ( 2 ) 4
exp ( , )
N
i i
c i dr
c i
N
i dr c
i
N
i i
i
R n P R n P
S t n j f t j f
C C
x vn x vn
R R
R R
j f t j f
C C
j t n
σ π π
σ π π
So, (8) can be expressed in vector form as
c i i
S =Aσ =Aϕα (9)
{
exp[ 1( , )], exp[ 2( , )],..., exp[ ( , )]}
i N
A = −jφ t n −jφ t n −jφ t n (10)
where Ai is interpreted as N×1 measurement vector at the slow-time n and fast time t.
Due to the matrix Θ, vector S and α are all complex, in order to apply the sparse theory into the complex SAR raw data, (9) should be rewritten as
Re( )S +Im( )S =[Re( )A + jIm( )][Re( )A σ + jIm( )]σ (11)
The real and imaginary part of measured signal can be calculated respectively as
Re( )S =Re( ) Re( )Θ α −Im( ) Im( )Θ α (12)
Im( )S =Re( ) Im( )Θ α +Im( ) Re( )Θ α We define the signal Sˆ ˆ ˆ, ,Θα as
Re( ) Im( )
Re( ) Re( )
ˆ ,ˆ , ˆ
Im( ) Re( )
Im( ) Im( )
T T
T T
S S
S
α α
α
Θ − Θ
= Θ = =
Θ Θ
(13)
Then (13) can be further replaced as
ˆ ˆ ˆ
S= Θ +α n (14)
3. Methodology and Results
In order to explain what kind of method is more accurate, we apply the conventional method and sparse construc-tion method into SAR imaging. The convenconstruc-tional MF method and the sparse construcconstruc-tion method are compared in the same situation. We take two most common kinds of sparse construction methods, including OMP, BP. Si-mulations are all based on complex image in frequency domain.
3.1. SAR Imaging through IFFT and Sparse Method
Some numerical simulations with these three methods are presented to find the merits and drawbacks of sparse method and conventional method in SAR imaging. The indicators we have taken to evaluate the qual-ity of SAR imaging include resolution of azimuth and range, side lobe level. Simulation data is a series of complicated point targets generated from RadBase.
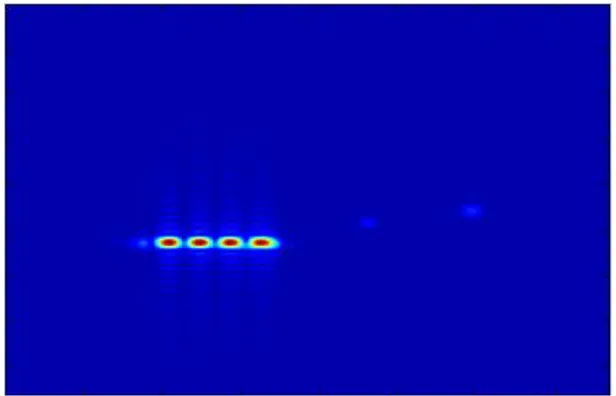
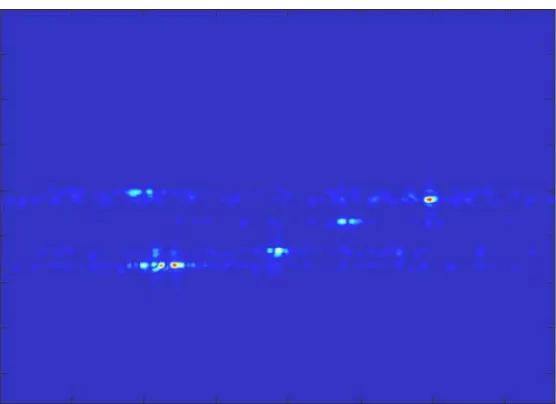
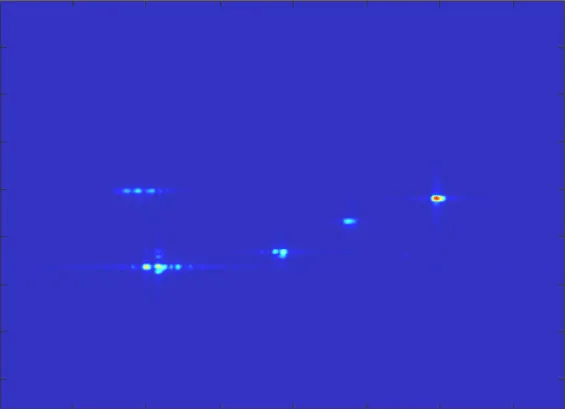
[image:4.595.160.468.505.703.2]AS is shown in Figures 1-6, BP method has a more clear imaging result and better resolution over FFT and
Figure 2. Imaging result through IFFT (Data 2).
Figure 3. Imaging result of OMP (Data 1).
[image:5.595.175.453.501.703.2]Figure 5. Imaging result of BP (Data 1).
Figure 6. Imaging result of BP (Data 2).
OMP. Imaging result with OMP carry more noise than BP and imaging result by FFT has a high side lobe. Ob-viously, targets can be distinguished from each other in BP. Convex optimization method outperforms over OMP method and FFT. In Data 1, the regularization parameter λ is set as 0.21. In Data 2, the regularization parameter λ is set as 0.1.
3.2. Profile-Map Analysis of Imaging Quality
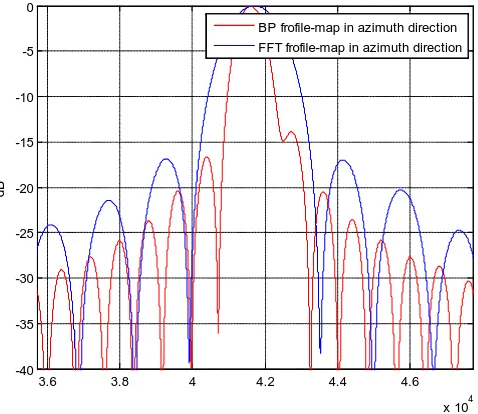
In order to judge the imaging quality more intuitively, we choose the BP algorithm (Data 2, the regularization parameter λ is set to be 0.1 in this section) to analyze the imaging quality with the conventional FFT method in the same situation furthermore, and conduct profile-map analysis in the range and azimuth direction. We draw both of the profile-map figures in two directions in the same figure. The imaging results are shown in Figure 7 and Figure 8.
[image:6.595.173.459.324.530.2]Figure 7. Profile-map in range direction.
Figure 8. Profile-map in azimuth direction.
4. Conclusion
The paper presents a series of sparse reconstruction method for SAR imaging. Compared with traditional MF method, the convex optimization method outperforms in high resolution and side lobe suppression and greatly improves the imaging quality. The pre-condition is that the signal is sparse in some domain (such as time, fre-quency, space etc.). Through a simple new strategy we proposed, we can easily find the best regularization pa-rameter of sparse construction. Results show the effectiveness and feasibility of our method. However, there are still some challenges demanded to overcome in SAR imaging with sparse method. The computation complexity and robustness of sparse construction needs to be improved with noise. How to find a better dictionary D is also an interesting problem for us to solve.
Acknowledgements
This study we research for the moment is supported by the National Natural Science Foundation of China.
5.4 5.6 5.8 6 6.2 6.4 x 10⁴ -40
-35 -30 -25 -20 -15 -10 -5 0
dB
BP frofile-map in range direction FFT frofile-map in range direction
3.6 3.8 4 4.2 4.4 4.6 x 10⁴ -40
-35 -30 -25 -20 -15 -10 -5 0
dB
[image:7.595.195.434.328.535.2]References
[1] Cumming, I.G., Dettwiler, M. and Wong, F.H. (2004) Digital Signal Processing of Synthetic Aperture Radar Data: Algorithms and Implementation. ArtechHouse, Norwood.
[2] Candes, E.J. and Wakin, M. (2008) An Introduction to Compressive Sampling. IEEE Signal Processing Magazine, 25, 21-30. http://dx.doi.org/10.1109/MSP.2007.914731
[3] Romberg, J. (2008) Imaging via Compressive Sampling. IEEE Signal Processing, 25, 14-20.
[4] Bruckstein, A.M., Donoho, D.L. and Elad, M. (2009) From Sparse Solutions of Systems of Equations to Sparse Mod-eling of Signals and Images. SIAM Review, 51, 34-81.
[5] Cumming, I.G. and Wong, F.H. (2005) Digital Processing of Synthetic Aperture Radar Data: Algorithm and Imple-mentation. Artech House Publishers.
[6] Soumekh, M. (1999) Synthetic Aperture Radar Signal Processing with Matlab Algorithms. Wiley, New York.
[7] Donoho, D. (2007) Compressed Sensing. IEEE Trans. Inf. Theory, 52, 118-121. [8] Baraniuk, R. (2007) Compressive Sensing. IEEE Signal Processing, 24, 118-121.