The Effects of Mobile Phone Usage on Human Brain
using EEG
Gurlovleen Singh
Department of Electronics and Communication Engineering
Dr. B R Ambedkar National Institute of Technology, Jalandhar (Punjab)-144011,India
ABSTRACT
There is ongoing discussion whether cellular or mobile phone has any effects on brain. The aim of this research is to investigate the effects of mobile phone use on left and right ear using electroencephalograph (EEG). The brain waves are analyzed using Wavelet transform and Fast Fourier Transform. Twenty subjects are studied after recording their EEG signals using International 10/20 system of EEG recording. Findings show that beta upper band (20-30Hz) had dominant effect as compared beta lower band (12-20Hz). In addition, the total power of beta waves during mobile phone usage on right ear is more than left ear. This High power of beta waves leads to anxiety, stress and other physical and mental discomforts.
Keywords
EEG; brain waves; International 10/20 system
1. INTRODUCTION
Cellular technology is advancing day by day. Invention of mobile phones and their usage has many health consequences. In many countries, more than half the population uses mobile phones nowadays [1]. It is quite necessary to investigate, understand and analyze the consequences of harmful mobile electromagnetic radiations on human brain[1-2].It is well known that EEG signals are the imprints of brain activity and changes according to the task performed by a person. These changes are reflected in different frequency bands of EEG waveform named as delta, theta, alpha, beta and gamma [3-4]. Delta wave is the lowest frequency rangestarting from almost zero and can be only up to 4 Hz. It is higher during sleeping mode, whereas Theta ranges from 4 to 7 Hz. It is dominant when someone is feeling tired and depressive [5-6].The frequency of alpha wave is from 8 to 12 Hz and mainly occurs when the person is in a relaxed condition or reflecting with closed eyes [5-6].Under this stage, a person is still awake yet resting. Beta wave frequency extends from 12 to 30 Hz. Beta wave is indicative of active, busy or anxious thinking and active concentration [5]. Thus, related to the alert or working state.
EEG is the electrical activity produced by the neurons in the brain. EEG test is harmless and can be repeated on the subject any time [3]. EEG electrodes are placed onto the scalp and impulses from the brain are recorded. The electrodes convert ionic current from cerebral tissues into electrical current used in EEG preamplifier [8].
EEG pre-amplifier detects and amplifies the electrical signals and records them in the software of a computer. Cellular phones may reversibly influence the human brain, as their use induced abnormal slow waves in EEG of awake persons[8].Electromagnetic radiations alters EEG frequency bands in power spectrum of alpha, theta, delta, beta and gamma bands[9].
1.1 International 10/20 system
In 1958, International Federation in Electroencephalography and Clinical Neurophysiology adopted standardisation for electrode placement called 10-20 electrode placement system [3]. This system standardized physical placement and designations of electrodes on the scalp. The head is divided into proportional distances from prominent skull landmarks (nasion, preauricular points, inion) to provide adequate coverage of all regions of the brain. Label 10-20 designates proportional distance in percents between ears and nose where points for electrodes are chosen. Electrode placements are labelled according adjacent brain areas: F (frontal), C (central), T (temporal), P (posterior), and O (occipital). The letters are accompanied by odd numbers at the left side of the head and with even numbers on the right side (Figure 1). Left and right side is considered by convention from point of view of a subject. The combination of all active electrodes with reference and ground electrode compose channels [11]. Electrode placements and the different ways of combining electrode pairs to measure potential differences on the head constitute the electrode montage [3].
Figure1 10/20 Electrode system for EEG acquisition [22]
2. METHODOLOGY
2.1 EEG Recording
other. Frontal lobe points FZ-Ref, FZ-A2 are taken as the montage for the EEG data. In addition, one or two reference electrodes (often placed on ear lobes) and a ground electrode (often placed on the nose or forehead to provide amplifiers with reference voltages) are required. The recorded data for three cases is shown in table 7.
Figure 2 Flow diagram of the experiment
2.2 Discrete Wavelet Transform (DWT)
DWT is an important tool for analyzing the time varying non stationary signals like EEG signals. Wavelet transform was applied at sampling frequency of 250 samples/sec. EEG signal can be decomposed using orthogonal and biorthogonal wavelets. EEG signal is then decomposed using daubechies 4 with fifth level decomposition. Each level decomposes signal into subbands corresponding to gamma, beta, alpha, theta and delta. Beta waves are dominant in case of mobile usage [5]. Beta coefficients are extracted at third level of decomposition. DWT consists of coefficients of expansion of original signal with respect to a basis 𝜓𝑗 .𝑘 𝑡 each element of which is a dilated and translated version of function 𝜓 called motherwavelet. In DWT time scale space is sampled at discrete levels by using discrete steps for scale and translation parameters. Expression 1 for DWT is given as
𝜓𝑗 .𝑘 𝑡 = 1 𝑠0𝑗
𝜓 𝑡−𝑘𝜏0𝑠0𝑗
𝑠0𝑗 , 𝑗, 𝑘ℇ𝑍 (1)
[image:2.595.313.551.176.333.2]In (6), j and k are integers, Z is asset of integers and so is a dilation parameter with so>1. For the dyadic sampling of the frequency axis so= 2.
Figure 3 showing a subject with the experimental set up
2.3 Analysis of EEG signal
The frequency content of EEG signal provides useful information than time domain representation. The wavelet transform gives us multi-resolution description of anon-stationary signal. EEG is non anon-stationary signal hence wavelet is suited for EEG signals [23].
At high frequencies it represents a good time resolution and for low frequencies it represents better frequency resolution. This multi-scale feature of the Wavelet allows the decomposition of a signal into a number of scales, each scale representing a particular coarseness of the signal under study [23]. The procedure of multiresolution decomposition of a signal x[n] is shown in figure 4.The wavelet coefficients were computed using daubechies wavelet of order 4 because its smoothing features are more suitable to detect changes in EEG signal.
[image:2.595.70.530.547.711.2]
Figure 4 Discrete wavelet transform block diagram [21]
EEG recording
Discrete wavelet transform
Fast fourier transform
Power spectral density
Feature extraction
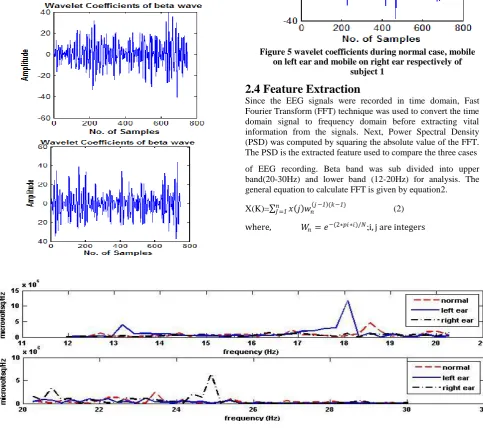
In the present study, the EEG signals were decomposed into fifth level of decomposition. The decomposition of the signal leads to set of coefficients called wavelet coefficient. Down sampled outputs of high pass filters produces detail wavelet coefficient(D1) and that of low pass filters produces approximation wavelet coefficients(A1)[16]. Each level decomposes signal into sub bands corresponding to gamma, beta, alpha, theta and delta.
[image:3.595.328.533.70.251.2]Beta coefficients are obtained at the third level of decomposition. Beta coefficients results for the three cases are then obtained for the all of the 20 subjects. The obtained wavelet coefficients of beta waves of three cases are shown in figure 5
Figure 5 wavelet coefficients during normal case, mobile on left ear and mobile on right ear respectively of
subject 1
2.4 Feature Extraction
Since the EEG signals were recorded in time domain, Fast Fourier Transform (FFT) technique was used to convert the time domain signal to frequency domain before extracting vital information from the signals. Next, Power Spectral Density (PSD) was computed by squaring the absolute value of the FFT. The PSD is the extracted feature used to compare the three cases of EEG recording. Beta band was sub divided into upper band(20-30Hz) and lower band (12-20Hz) for analysis. The general equation to calculate FFT is given by equation2. X(K)= 𝑛𝐽 =1𝑥 𝑗 𝑤𝑛 𝑗 −1 (𝑘−1) (2)
[image:3.595.61.545.206.634.2]where, 𝑊𝑛= 𝑒−(2∗𝑝𝑖 ∗𝑖)/𝑁;i, j are integers
Figure 6 Power spectrums of beta upper band and lower band respectively, of subject 1
Power spectrum is used to calculate the power of selected bandwidth range. The spectrum is obtained using FFT method which is a non-parametric method of calculation of power spectral density [24]. Nonparametric methods are those in which the PSD is estimated directly from the signal itself. Power is calculated using the equation 3.
Power = PSD*BW (3)
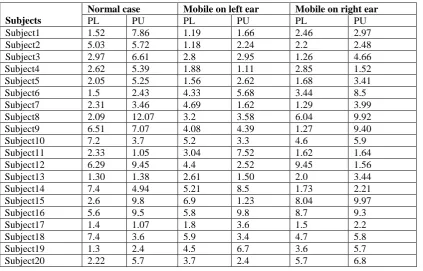
Table 7 Power calculations for three cases in beta lower and beta upper band.
*PU=power in upper band; PL= power in lower band; all values in microwatts
3. RESULTS AND DISCUSSIONS
In this study, EEG data is acquired from Frontal lobe according to 10/20 system using FZ point as main consideration [11]. Beta waves have predominant location mainly on frontal lobe of the brain[10].Power of upper band in case of mobile phone usage on right ear is more in majority of the cases in comparison to left ear phone usage in majority of the cases. Total power (beta upper band + beta lower band) in case of mobile usage on left ear was found lesser in contrast to right ear as shown in table 4.1. Power contribution of upper Beta band was more as compared to lower band in both the cases of mobile usage. Total power in beta band in case of mobile usage is less compared to normal recording without using mobile.
4. CONCLUSIONS
Beta waves tend to occur in people who are alert and focused [2]. Alertness is detected with increase in beta frequency power within higher band (20-30Hz).
Mobile phone usage needs mental effort and runs the brain into active stage that results in beta waves. The increase in beta waves concentration leads to stress, anxiety, muscle tension, paranoia, insomnia and negative thinking [15]. Mobile phone effects when it is used on left and right ear are compared and their results are then compared with the data without mobile phone usage. The performance of higher-frequency components (20-30Hz) suggests that the alertness level of the subjects was higher when they used the mobile phone on right ear and left ear in contrast to without the use of phone. So it can be concluded that the alertness or awareness of the brain increases with mobile phone usage. Secondly, the total power of the beta waves in case of mobile used on right ear was more than when it is used on left ear. Thus, it can be concluded that using mobile phone on right ear can lead to physical and muscular discomfort that include stress, anxiety and other physical and mental effects. So it is advisable to use the mobile phone on the left ear.
5. FUTURE SCOPE
The field of biomedical signal processing has been growing at very fast pace [23]. Another interesting experiment is to compare the effect on the brainwaves due to the different type of mobile phones (2G, 3G, iphone, GSM, CDMA). The methodology is not limited to EEG signals, same experiment can be extended to large classes of signals such as ECG and EMG signals. The proposed framework can be extended to people who are left handed and used mobile on left ear for a long time with those who are right hand users. The proposed work can be extended with EMG artifacts removed.
6. REFERENCES
[1] http://www.who.int/mediacentre/factsheets/fs193/en/index .html,Fact sheet No.193, “Electromagnetic fields and public health: mobile phones”, May 2010.
[2] S. Kovach, “Report: The Hidden Dangers of Cell Phone Radiation”, Life Extension Magazine, August 2007. [3] Sanei, S and Chambers, J.A, EEG signal processing, John
Wiley & Sons Ltd. 2007.
[4] Pfurtschellera, G. Lopes, F.H Silva, “Event-related EEG/MEG synchronization and desynchronization: basic principles”, vol.11, pp.1842-1857, 1999.
[5] A. S. Gevins and A. Remond, “Methods of Analysis of Brain Electrical and Magnetic Signals”, Elsevier, Amsterdam, vol.18, pp.49-65, 1987.
[6] M. Teplan, “Fundamentals of EEG Measurement”, Measurement of Science Review, vol. 2, pp.1-11, 2002. [7] Fathy El-Komey, “Effects Of Mobile Phones Radiation On
The EEG And EMG Of Human Users” The Egyptian Journal of Hospital Medicine , vol. 20, pp.177 – 195, 2005.
Subjects
Normal case Mobile on left ear Mobile on right ear
PL PU PL PU PL PU
Subject1 1.52 7.86 1.19 1.66 2.46 2.97
Subject2 5.03 5.72 1.18 2.24 2.2 2.48
Subject3 2.97 6.61 2.8 2.95 1.26 4.66
Subject4 2.62 5.39 1.88 1.11 2.85 1.52
Subject5 2.05 5.25 1.56 2.62 1.68 3.41
Subject6 1.5 2.43 4.33 5.68 3.44 8.5
Subject7 2.31 3.46 4.69 1.62 1.29 3.99
Subject8 2.09 12.07 3.2 3.58 6.04 9.92
Subject9 6.51 7.07 4.08 4.39 1.27 9.40
Subject10 7.2 3.7 5.2 3.3 4.6 5.9
Subject11 2.33 1.05 3.04 7.52 1.62 1.64
Subject12 6.29 9.45 4.4 2.52 9.45 1.56
Subject13 1.30 1.38 2.61 1.50 2.0 3.44
Subject14 7.4 4.94 5.21 8.5 1.73 2.21
Subject15 2.6 9.8 6.9 1.23 8.04 9.97
Subject16 5.6 9.5 5.8 9.8 8.7 9.3
Subject17 1.4 1.07 1.8 3.6 1.5 2.2
Subject18 7.4 3.6 5.9 3.4 4.7 5.8
Subject19 1.3 2.4 4.5 6.7 3.6 5.7
[8] D'Costa H, Anderson V, Hamblin DL, McKenzie R, Cosic I. “ Effects of EEG electrode leads on the specific absorption rate of radiofrequency exposure from mobile phones, Biological Effects of EMFs” 3rd
International Workshop, Kos, Greece, vol.134, pp.91-100, 2004. [10] Uwe Herwig, Peyman Satrapi, and Carlos
Schönfeldt-Lecuona, “Using the International 10-20 EEG System for Positioning of Transcranial Magnetic Stimulation”, Brain Topography, 2003.
[11] D. G. Brunet and G. B. Young, "Co-Chair Electroencephalography Task Force," Guidelines for Clinical Practice and Facility Standards Electroencephalography. The College of Physicians and Surgeons of Ontario, Canada, vol.81, pp.479-486, 2000. [12] K. Mann and J. Röschke, "Sleep under Exposure to
High-Frequency Electromagnetic Fields," Sleep Medicine Reviews, vol. 8, pp. 95, 2004.
[13] H. D'Costa, "Influence of mobile phone electromagnetic fieldexposures on nervous function in the human brain and heart."School of Electrical &Computer Engineering Portfolio, vol.32, pp.192-199,December 2008.
[14] M. M. R. Moussa, "Review on health effects related to mobilephones. Part II: results and conclusions," The Journal Of The Egyptian Public Health Association, vol. 86, pp.79-82, 2010.
[15] A. Johansson, S. Nordin, M. Heiden and M. Sandstrom,“Symptoms, Personality Traits and Stress in People with Mobile Phone-related Symptoms and Electroencephalographic Phenomena within the Alpha Band", Neurophysiologie Clinique/Clinical Neurophysiology, vol.32, pp. 54-71, 2002.
[16] Jont B. Allen "Short Time Spectral Analysis, Synthesis, and Modification by Discrete Fourier Transform" IEEE Transactions on Acoustics, Speech, and Signal Processing, vol.25, pp. 235–238, 1997.
[17] Jung, T.P., Makeig, S., Stensmo, M., Sejnowski, T.J., “Estimating Alertness from EEG power spectrum”, IEEE Transaction on Biomedical Engineering, vol.44, pp.60-69, 1997.
[18] Luzheng, Bi., Zhang, R., Zhilong, “Study on Real-time Detection of Alertness Based on EEG”, IEEE/ICME International Conference on Complex Medical Engineering, vol.23, pp.1490-1493, 2007.
[19] Zhang, A., Yang, B. and Huang, L, “Feature Extraction of EEG Signals Using Power Spectral Entropy”, Paper Presented at the BioMedical Engineering and Informatics Conference BMEI, vol.2, pp.435-439, 2008.
[20] Elif Derya Übeyli, “Statistics over Features: EEGsignals analysis”, Computers in Biology and Medicine, vol.39, pp.733-741, 2009.
[21] http://en.wikipedia.org/wiki/Discrete_wavelet_transform [22] http://www.thethinkingbusiness.com/brain_zone/brain-tour [23] R. Quian Quirogaa, O.W. Sakowitz, E. Basarc, M. Schu¨rmannd, “Wavelet Transform in the analysis of the frequency composition of evoked potentials”, Brain Research Protocols, vol.8, pp.16-24, 2001.
![Figure 4 Discrete wavelet transform block diagram [21]](https://thumb-us.123doks.com/thumbv2/123dok_us/8030430.768566/2.595.70.530.547.711/figure-discrete-wavelet-transform-block-diagram.webp)