Efficient Bandwidth Management and Implementation of
Cross-Layer Queuing Model in a Wireless Campus Area
Network
Garba S.
Department of Electrical and Computer Engineering, Ahmadu Bello University, Zaria
Abdulmalik M.
Department of Electrical and Computer Engineering, Ahmadu Bello University, Zaria
Tekanyi A.M.S.
Department of Electrical and Computer Engineering, Ahmadu Bello University, Zaria
ABSTRACT
This paper investigates the use of an efficient bandwidth management scheme by implementing cross-layer M/M/1 queuing model. Strict Open System Interconnection (OSI) layer to layer communication problem is solved by introducing a common database that automatically synchronizes the status of each OSI layer to all the other layers. First-In-First-Out (FIFO) queuing data structure and Priority Queuing (PQ) were deployed to the model to reduce data loss and congestion in low bandwidth interfaces respectively. The integrated model caters for the burst arrival into the system. Application of this model to a Wireless Campus Area Network (WCAN) show that 95 % and 95.26 % were the generated packets in the wireless channel and accounted packets respectively. Subsequently, 22.19 % of bandwidth has been saved using Real Time Packets (RTP) and Non-Real Time Packets (NRTP).
Keywords
FIFO, NRTP, OSI, PQ, RTP, and WCAN.
1.
INTRODUCTION
Wireless Campus Area Network (WCAN) utilizes two types of packets that are sent across from the sending end to the receiving end. These packets are Real Time Packets (RTP) and Non Real Time Packets (NRTP). RTP are packets sent in real time that requires no delay in reaching their destination otherwise they become unusable, such as teleconferencing. On the other hand, in NRTP delay is tolerable, such as email messages [1]. Wireless communications involve the interaction of all layers in the OSI protocol and a good cross-layer model would be suitable in sharing information between different layers [2]. WCAN transmission are associated with problems such as Signal-to-Noise-Ratio (SNR) and delay problems which due results in packets delivery error that will require retransmission. Consequently resulting in Bandwidth consumptions [1].
WCAN utilizes dynamic nodes to communicate over a wireless channel. The objective of such a design structure is to avoid any centralized infrastructure which limits mobility because each mobile node acts as a host and router at the same time. The network also has its setbacks caused by resources not residing in the network or mobile nodes and dynamic network topology thus making routing in such networks difficult due to frequent link failures. Therefore, if the radio link layers (physical and Media Access Control (MAC) layers) are not able to satisfy the demand of throughput from upper layers, a queuing condition is generated. This occurs due to bad channel conditions, network congestion or because the amount of data sent to the lower layers is greater than the peak rate offered by the communication technology. This
queuing condition introduces delay and reduces the actual throughput perceived by the upper layers. If the channel conditions vary, the size of the queues will also vary, generating more jitter. Hence, if data rate is dynamically assigned to meet the offered throughput, queue’s size is kept at minimal levels, reducing delay, jitter and decreasing losses in the communication process [2].
This work involves the use of a Graphical User Interface (GUI) simulation software which implements cross-layer M/M/1/ queuing model applicable in a physical WCAN to free the network from unusable packets. Subsequently, save bandwidth.
2.
OSI LAYERS AND
COMMUNICATION FLOWS
[image:1.595.316.546.432.713.2]The Open System Interconnection (OSI) model is a conceptual architectural model of seven layers shown in Figure 1.
Figure 1: Network Architecture of OSI Layers and Communication Flows [3].
how messages are transferred from the sending computer software application to that of receiving computer. To move this information between interconnected computers, each of the seven OSI layers is independently assigned separate smaller manageable tasks to carry out. This makes the design and update of respective functions of each layer possible without affecting others.
All layers from application right through to data-link, add control bits (instructions) to the data as it is transferred from one layer to another. When data gets to the physical layer, it is then passed to the physical layer of the receiving computer as shown in Figure 1 [3].
The goal of using cross-layer design is to improve the whole communication process, emphasizing on the optimization and exchange of state parameters between non-adjacent layers, but in an opposite way to the traditional Open Systems Interconnection (OSI) inter-layer communication [2].
3.
WCAN QUEUEING CONCEPT
A queue is the number of entities waiting for limited service (or resources). The theory of queuing involves the analysis of such queuing situations to get the balance between cost and Quality of Service (QoS) right. Queuing situations, as shown in Figure 2, are associated with uncertainty (stochastic in nature) of inter-arrival times and service times because of the random and unpredictable nature of queues [4], [5].
[image:2.595.61.277.365.466.2]Figure 2: Relationships of Parameters of Queuing System
[4].
According to Stallings (2000), as illustrated in Figure 2, the system’s utilization
is defined as the ratio of average arrival rate
to that of average service rate
of the system. Other relevant parameters in the analysis are the average number of entities resident in the system
N
R
andthose in the queue waiting for service
N
W , as well as the average response time of the system
T
R and averagewaiting time for service
T
W . Also, the service time
T
S is the average time taken by the system to process requests.The relationships of the parameters in queuing analysis is thus given as [4]:
T
N
(1)Information on the present capacity of a queuing system is important in approximating the load requirements of new systems in different areas (or for upgrade of existing systems). For this reason, queuing analyses to achieve good performance projections are based on the following [6]:
i. Ability to plan for some changes in the system, such as:
a. Expected load increase on a system where it is good to know if the existing system (WCAN, LAN) can handle load increase or where it cannot, a new separate system be provided with an interconnecting device (router/bridge) to link it to the old system for increased capacity.
b. When facilities are not available, a design change could be another option to accommodate load increase by configuring all additional users (PCs, laptops) into the existing system through the file server, since the load generated by each use can be estimated.
ii. Ability to address concerns of a system performance based on parameters such as:
a. System response time, particularly, interactive real-time applications.
b. System throughput, for example, non-interactive applications.
The standard notation to represent the elements of a queuing system is given as [6]:
A/B/N/Q/E (2)
Where,
A is arrival process probability distribution;
B is service process probability distribution;
N is the number of servers available;
Q is the maximum number of entities in the queue for service; and
E is the maximum number of entities in the system
Hence, taking elements Q and E to be infinite, equation (2) can be reduced to equation (3) as:
A/B/N (3)
Where, the elements A and B can be represented by any of these three parameters:
i. G = General independent arbitrary probability distribution for arrival or service at a time with a known mean and variance.
ii. M = Markovian negative exponential distribution probability density for a Poison at an inter-arrival or service time.
iii. D = Deterministic same length of arrivals or constant length of service times for all items.
However, if Q and E of equation (2) are not specified as in equation (3), then it is assumed that they are infinite. Hence, based on equation (3), examples of different queuing models available are M/M/1, M/D/1, M/G/1, M/G/N/, M/M/N, etc. Each of these queuing models represents the characteristics of a queuing system which can be analyzed mathematically.
Three elements are required for any queuing model:
i. Input (arrival) process which is the manner in which entities arrive;
iii. Service mechanism which outlines the way in which entities in the queue are being served.
These elements are key in deciding which system best meets certain measures of effectiveness required, such as:
i. Probability distribution of the number of entities waiting for service so that the state and speed of the service facility can be determined, as well as the waiting space required to avoid overflow.
ii. Probability distribution of waiting time of entities so that the average waiting time and the proportion of entities waiting longer than specified time is found.
The M/M/1 model is a single server queuing system with both its queue capacity and population unlimited. Also, the entities service times are totally independent of their arrival rates. Amongst the queuing models mentioned, M/M/1 is found to be the most appropriate model for the analysis of a WCAN because of the following reasons [4], [7], [8]:
a. Single server queue is the most experienced queuing scenario suitable for estimating accurately practical queuing systems.
b. It fits well with real life situations and results are never far from those exhibited by real systems.
c. Single server queue is simple because it is a straight forward one queue system.
d. The system has well defined distributions of Poisson arrivals and exponentially service times.
e. It is more tractable (easy to deal with) and efficient than the analysis of multi-server queue.
4.
METHODOLOGY
Queue in WCAN involves the number of entities waiting for limited service (or resources). The methodology for the M/M/1 model queuing involves the analysis of such queuing situations to get the balance between cost and Quality of Service (QoS). As the following are looked at:
i. Priority Queuing (PQ)
ii. First-In-First-Out Queuing (FIFO)
iii. Server Common Database
i. Priority Queuing (PQ)
This is a scheme that classifies arriving traffic into different queues, each queue with its own priority level depending on defined parameters. The levels of priority can be high, low or medium, meaning all traffic of high priority are serviced first to ensure their timely delivery, then medium and lastly low-priority traffic. When congestion occurs, dropping starts with low priority traffic, then medium and ends up with high priority traffic.
Priority queuing is highly significant to low bandwidth interfaces due to their prone to congestion as a result of the burst nature of packet arrivals into such systems. It is most effective on RTP of WCAN.
ii. First-In-First-Out Queuing (FIFO)
In a single server queuing system, it is the packet that first enters the queuing system which is serviced first and dispatched. Whenever congestion occurs at full capacity of the system, any new arrival is dropped irrespective of the type. This is the main disadvantage of this scheme. But this limitation can be resolved by employing Random Early
Detection (RED) as a queue management process. Also, FIFO depends on end systems to control congestion via congestion control mechanisms such as admission control [9].
With FIFO, the buffer is not partitioned and no data is lost. This makes it effective for large links that have little congestion and delay. Also, since there is no priority attached to packets in the queue, the issue of unbalance resource allocation is also avoided.
iii. Server Common Database
This is responsible for housing information on the status of each of the OSI layers, network status and resources which can be accessed by other layers such as bandwidth, congestion status, and error rate.
OSI individual layers are connected to the Server Common Database in order to have prior information on other layers and the network so as to be able take quick appropriate decisions with regards to layers’ activities.
First-In-First-Out (FIFO) queuing data structure and Priority Queuing (PQ) were deployed to the model strictly to avoid data loss and reduce congestion in low bandwidth interfaces respectively. The integrated model caters for the burst packets arrival into the system.
5.
SIMULATIONS, RESULTS AND
DISCUSSIONS
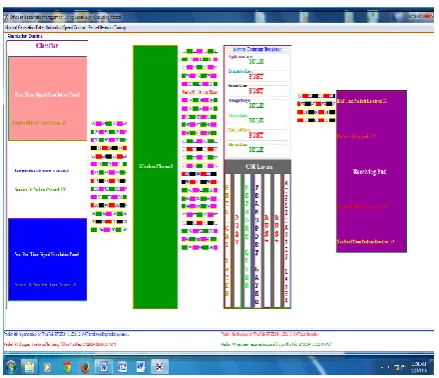
[image:3.595.314.534.485.674.2]The developed controlled software program as shown in Figure 2 is able to track down the activities of every single packet in the network from the time it is generated to the time it is either received or dropped. In Figure 2, packet drop is due to some conditions not being met such as packet expiry time, retransmission limit and errors as well. It also monitors and prevents congestion or overflow of the buffer by sending back a signal to the generator to either slow down or stop transmission and resumes transmission once congestion is cleared or buffer is freed. In addition, the program is able to distinguish real time packets from non-interactive packets which are not sensitive to delay.
Figure 3: A detail Report of Controlled Program after 7 Minutes.
the reverse happens when the model is ridded off these valuable control parameters thereby causing poor bandwidth utilization.
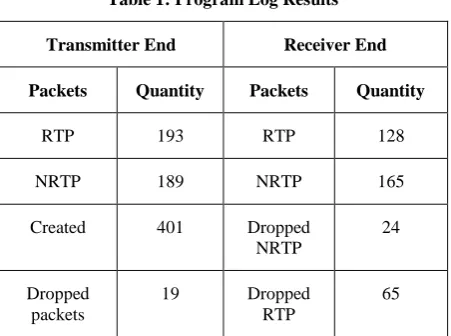
Table 1: Program Log Results
Transmitter End Receiver End
Packets Quantity Packets Quantity
RTP 193 RTP 128
NRTP 189 NRTP 165
Created 401 Dropped
NRTP
24
Dropped packets
19 Dropped
RTP
65
The results on packet numbers tabulated in Table 1 were obtained from its log (record) shown in APPENDIX A, when the controlled program was run for about seven (7) minutes and then terminated.
During the seven minutes time duration, packets activities were recorded at both the transmitter and receiver ends, respectively.
It can be deducted from Table 1 that, at the transmitter end that a total of 382 (193 + 189) packets succeeded to go through into the wireless channel. But, nineteen (19) (401 – 382) of the total generated packets were dropped due to either unsatisfactory signal-to-noise (SNR) ratio, or the lack of request-to-send/clear-to-send (RTS/CTS) control information between the transmitter and the receiver, etc.
Also, at the receiver end, a total of 382 packets were expected to pass through the wireless channel; i.e. sum of RTP and NRTP. Rather, 365 passed instead of 382, due to integration of First-In-First-Out (FIFO) queuing data structure and Priority Queuing (PQ). They abruptly terminates and drop any packets that did not meet the strict rules set. Since the number of delayed RTP dropped is 65, the combined unprocessed RTPs and NRTPs dropped is 89 (65+24) packets.
i. Transmitter end:
Out of the total packets generated, the percentage of packets which enter through into the wireless channel PPC is given by:
𝑷𝑷𝑪=𝑹𝑻𝑷+𝑵𝑹𝑻𝑷𝑷𝑮 ∗ 𝟏𝟎𝟎 % (4)
Where PG = Generated Packets
𝑃𝑃𝐶=
193 + 189
401 ∗ 100 %
𝑃𝑃𝐶= 95 %
ii. Receiver end:
The percentage of packets accounted, PPA, in the channel is
given by:
𝑷𝑷𝑨=𝑹𝑻𝑷+𝑵𝑹𝑻𝑷+𝑷𝑫𝑷𝑪 ∗ 𝟏𝟎𝟎 % (5)
Where PD = Packets dropped
PC = packets created
𝑃𝑃𝐴=
128 + 165 + 24 + 65
401 ∗ 100 %
𝑃𝑃𝐴= 95.26 %
From this 95.26 % of packets accounted for, the percentage of packets unprocessed PPUP is:
𝑷𝑷𝑼𝑷=𝑷𝑫𝑷𝑪∗ 𝟏𝟎𝟎 % (6)
𝑃𝑃𝑈𝑃 =
24 + 65
401 ∗ 100 %
= 22.19 %
Application of this model to a Wireless Campus Area Network (WCAN) show that 95 % and 95.26 % were the generated packets in the wireless channel and accounted packets respectively. The 22.19 % demonstrates that packets are necessarily dropped from the queue. This shows that significant bandwidth has been saved based on screening.
6.
CONCLUSION
Efficient bandwidth management and congestion control was also achieved. Only qualified packets which were useful at the receiver end were processed and received at the destination. Delayed packets and unprocessed ones were dropped from the wireless channel, thus saving the bandwidth by 22.19 %.
7.
REFERENCES
[1] Elliotte R. H. (2014), “Java Network Programming 4th edition”. O’Reilly Media Inc. ISBN 978-1-449-35767- 2, Chapter One-Basic Network Concepts.
[2] Rivera-Rodriguez, R., Olivares- Dominguez, O. E. and Serrano- Santoyo, A., (2010), “Cross-layer Optimization of Packet Loss Rate in Mobile Video conferencing applications”. Universidad Autonoma de Baja California, Mexico, 8(1):130-141.
[3] Ahmad, A., (2003), “Data Communication Principles for Fixed and Wireless Networks”. ISBN: 978-0306-47793-5, Kluwer Academic Publishers, New York, USA: 17-130.
[4] Stallings, William, (2000), “Queuing Analysis”.http://WilliamStallings.com/StudentSupport.ht ml, 21-11-2011.
[5] Bobarshad, H. and Shikh-Bahaei, M., (2009), “M/M/1 queuing Model for Adaptive Cross-Layer Error Protection in WLANs”. IEEE, 978-1-4244-2948-06/2009, Division of Engineering, King’s College, London, UK.
[6] Kleinrock, L. (1973). "Scheduling, Queuing and Delays in Time-Shared Systems and Computer-Communication Networks”. Abramson, N. and Kuo, F. Eds. Englewood Cliffs, NJ Prentice-Hall: 95-141.
[7] Murdoch, J., (1978). “Queuing Theory, Worked Examples and Problem”. Macmillan Press Ltd, London, ISBN: 0-333-217202-0: 15-45.
[8] Sharma Sanjay (2010). “Computer networks (principles, technologies and protocols)”. S. K. Kataria & Sons Publishers, New Delhi-110002, India. : 652-689
Telecommunications Systems, (15): 185-201.
Appendix A
************************* Packet 04 *************************
1. Packet 04 created but dropped due to failed RTS on Tue Mar 04 2014 08:23:00 WAT
************************* Packet 25 *************************
1. Packet 25 created but dropped due to unfavourable SNR on Tue Mar 04 2014 08:23:23 WAT
************************* Packet 35 *************************
1. Packet 35 created but dropped due to failed CTS on Tue Mar 04 2014 08:23:36 WAT
************************* Packet 37 *************************
1. Packet 37 created but dropped due to unfavourable SNR on Tue Mar 04 2014 08:23:37 WAT
************************* Packet 44 *************************
1. Packet 44 created but dropped due to failed CTS on Tue Mar 04 2014 08:23:48 WAT
************************* Packet 76 *************************
1. Packet 76 created but dropped due to failed RTS on Tue Mar 04 2014 08:24:37 WAT
************************* Packet 77 *************************
1. Packet 77 created but dropped due to unfavourable SNR on Tue Mar 04 2014 08:24:38 WAT
************************* Packet 81 *************************
![Figure 1: Network Architecture of OSI Layers and Communication Flows [3].](https://thumb-us.123doks.com/thumbv2/123dok_us/8022312.766464/1.595.316.546.432.713/figure-network-architecture-osi-layers-communication-flows.webp)
![Figure 2: Relationships of Parameters of Queuing System [4].](https://thumb-us.123doks.com/thumbv2/123dok_us/8022312.766464/2.595.61.277.365.466/figure-relationships-parameters-queuing.webp)