International Journal of Emerging Technology and Advanced Engineering
Website: www.ijetae.com (ISSN 2250-2459,ISO 9001:2008 Certified Journal, Volume 4, Issue 7, July 2014)
509
Estimating the Lung Tumor size in CT images using Image
Segmentation Techniques
Faleh H. Mahmood
1, Wafaa A. Abbas
2, S. M. Ali
31,3
Remote sensing Research Unit, College of Science, University of Baghdad, Baghdad, Iraq 2College of Pharmacy, University of Baghdad, Baghdad, Iraq.
Abstract— With the fast development of the technology of
computed tomography (CT) technology, medical test images become one of the most efficient examination method to detect clinically the lung disease. The use of digital processing techniques like automatic segmentation for those images can help the Radiologist and the Surgeons to detect and remove lung tumors easily and efficiently. The main objective of this research is to use the Computer-Aided Diagnosis (CAD) algorithm to help the early detection of lung tumors. The propose method is started with pre-processing of the lung (CT) image to enhance its contrast and removing the undesired noise in order to make the image suitable for further processing. Linear filtration, background clipping, and image normalization have been adopted to perform the pre-processing operations on the CT images. The segmentation process is performed by using the K-mean clustering algorithm. The resulted segmented CT images, and then used to extract the tumor region from lung's image by introducing the seeded region growing algorithm. Defining the tumor volume (size) is not an easy task, because the 2D tumor shape in the CT slices are not regular. To overcome the problem of calculating the area of the convex shape of the hull of the tumor in each slice, we have used the frustum model for the fragmented data.
Keywords— CT image segmentation, Lung tumor detection,
K-mean clustering, and Seeded region growing.
I. INTRODUCTION
Early detection of the cancer is extremely important for successful treatment. However, it is not easy for the radiologists to quickly and accurately diagnose the pathological changes by using the original medical images in which the abnormal changes are buried in surrounding tissue. Therefore, it is important to explore techniques to enhance desired components and filter out undesired components of the medical images so that the radiologists can easily make a diagnosis and prescribe treatment [1]. Image analysis involves manipulating the image data to determine exactly the information required to develop the computer imaging system [2]. The modern applications of processing medical images include many useful techniques for the diagnosis of diseases and appointing the location of the dieses besides the exploration of the patient's condition.
Among these useful applications are; re-constructing 3D images from set of 2D segments, improving image contrast and removing noise and blurriness, performing quantitative analysis useful for pathogens, as well as a superior ability for early diagnosis. The most frequently steps used in the medical image processing methods are image registration, which aims at aligning image data from different modalities, subjects, or points of time, as well as image segmentation which localize and delineate the relevant objects in 2D projections and transform them into 3D visualization [3].
The X-ray computerized axial tomography (CT) provides a 2D map of the line attenuation coefficient mirroring morphological details of the organs under study. It has high spatial resolution and wide dynamic range of imaging modalities, so, even small density abnormalities can be detected. A CT image can be obtained within one breath hold which makes CT the modality of choice for imaging the thoracic cage [4]. However, image segmentation is an important tool in medical image processing, and has a very useful impact in many applications. The applications include detection of the coronary border in angiograms, multiple sclerosis lesion quantification, surgery simulations, surgical planning, measurement of tumor volume and its response to therapy, etc. The segmentation methods are, frequently, divided into different classes, depending on classification scheme:
Manual, semiautomatic, and automatic,
Pixel-based and region-based methods,
Manual delineation (e.g. thresholding, region growing),
Classical ( edge-based, and region-based techniques); e.g. statistical, fuzzy, and neural network techniques. The most commonly used segmentation techniques thus are classified into two broad categories [5]:
Region segmentation techniques that look for the regions satisfying a given homogeneity criterion, and
International Journal of Emerging Technology and Advanced Engineering
Website: www.ijetae.com (ISSN 2250-2459,ISO 9001:2008 Certified Journal, Volume 4, Issue 7, July 2014)
510
The image slices can then be stacked on top of one another, creating a 3D image volume. Using physical spacing information inherent in the image slices, it is possible to reconstruct the tumor from the segmented data as well as estimate the tumor volume [6].
II.LUNG IMAGING
Imaging plays a vital role in the diagnosis of lung cancer. The most common modalities including Chest Radiography, Positron Emission Tomography (PET), Magnetic Resonance Imaging (MRI(, Radionuclide Bone Scanning (RBS), and the X-ray computerized axial tomography (CT). In this work, we have used the CT images for the detection of the lung tumors, because it has the ability to determine the tumor in the presence of lymph node metastases. In fact, by the CT imaging one can easily distinguish between the tumor and normal tissues, especially when the pathology knowledge is present. Recent advances in Computed Tomography (CT) technology have enabled its use in diagnosing and identifying different diseases. In particular, the expanding volume of thoracic CT studies along with the increase of image data bring in focus the need for Computer-Aided Diagnosis (CAD) algorithms to assist the radiologists. Several lung diseases are diagnosed by investigating the patterns of lung tissue in pulmonary CT images, therefore segmentation and analysis is one of the important parts of CAD systems [7].
III.WORKING COMPUTER AXIAL TOMOGRAPHY (CT)
CT or computer axial tomography uses special X-ray tube to produce image data from different angles around the human body; it works in similar way to X-ray. All the tissues that are passed by the X-ray will be overlapped on an image. The CT scan works around this limitation by capturing one narrow slice of the scanned body at a time. Inside the CT machine, the X-ray tube circles around the patient taking pictures as it rotates. These slices can be viewed 2D images or added back together to create a 3D image of a body structure. A cross section of body tissues and organs can then shown by using computer processing of the data. Some of the basic ideas underlying CT are reconstructed from the projections; i.e. the patient data is getting measured at many positions and angles [7]. Multiple slices which constitute a 3D volume of the patient can be obtained using two methods: i.e. conventional CT scans take pictures of slices of the body, while helical CT scans take pictures as the X-ray tube helically circles the patient [8], as shown in figure (1). CT modalities can show various types of body structures; e.g. various tissues, lung, and bones. The images produced by CT scanner can reveal some body structures that cannot be seen by the utilizing of the conventional X-rays [7].
Figure (1): illustrates the working technology of the spiral scan tomography [9]
IV. X-RAY COMPUTED TOMOGRAPHY MATERIALS AND
METHODS
It is a technology that uses computer-processed X-rays to produce Tomographic of specific areas of the scanned object, allowing the user to see what is inside it without cutting it open. The CT scanning operations involve the following;
A. Digital Geometry Processing
[image:2.612.182.431.473.590.2]International Journal of Emerging Technology and Advanced Engineering
Website: www.ijetae.com (ISSN 2250-2459,ISO 9001:2008 Certified Journal, Volume 4, Issue 7, July 2014)
511
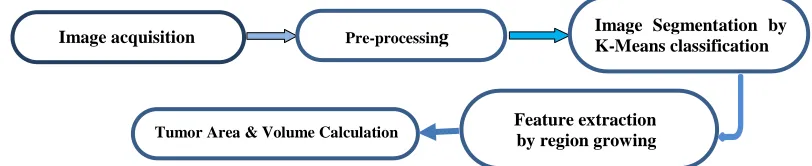
In this research the image analysis steps followed is shown in fig.(2) includes; Acquisition of a sample image database and examination of these images for the application is the first step in development of an imaging solution. Image analysis represents manipulation of the image data to determine the exact information required to develop the computer imaging system [2].
The simple toward image interpretation and analysis is segmentation process; it may be performed by utilizing certain image classification method (e.g. K-means) and followed feature extraction which is a crucial step toward identifying the image component parts. The collected features for the tumor can be used to delineating the tumor region, which is in turn used to extract the tumor and then used to calculate the tumor volume parameters.
Figure (2): represents the block diagram of the processes followed in this research.
B. Image Pre-Processing
The image Pre-processing stage starts with image enhancement which tend to improve the interpretability or perception of information included in them for human viewers, or to provide better input for other automated image processing techniques. Image enhancement techniques can be divided into two broad categories: Spatial domain methods and frequency domain methods. Unfortunately, there is no general theory for determining what “good” image enhancement is when it comes to human perception. However, when image enhancement techniques are used as pre-processing, the quantitative measures can determine which techniques are most appropriate. For Lung Cancer Detection using image pre-processing as tools for other consecutive image pre-processing, the quantitative measures can determine which techniques are most appropriate. Here, it is worth mentioning that the samples of images used in this research were provided by
Ghazi Hariri Hospital for specialized surgery. They have
been acquired in X-ray computed tomography (Siemens
Soma tom definition AS/ 64 Slice CT scanning) as a series
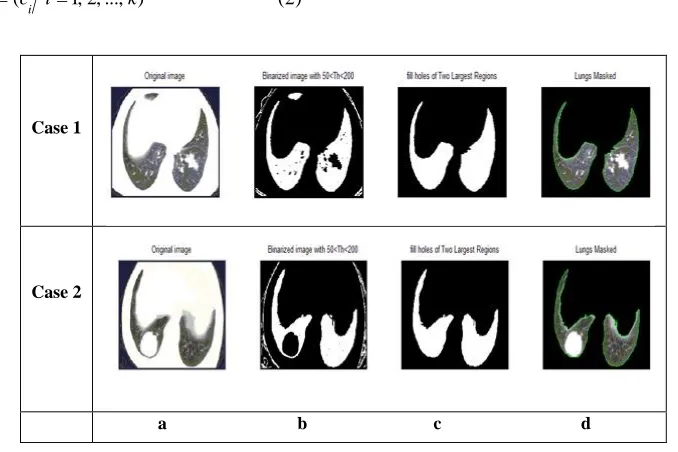
of X-ray transmission profiles through a cross-sectional plane of the patient. Every image is digitized at size 512x512 pixels, 9-bits radiometric resolution, of 5mm slice's thickness. Each slice image experienced a pre-processing operation due to their features [10]; e.g. utilizing linear filtration operation to remove their noise and clipping out their background and normalizing their density values [11]. In this research, the pre-processing process is performed by the steps illustrated in fig.(3):
Step1: The CT images have sizes 512×512 pixels, of 8-bits radiometric accuracy (i.e. 512 gray level), shown in fig. (3-a).
Step2: Converting the gray images into binary, using threshold (50< Th < 200), shown in fig (3-b).
Step3: Labeling the binary image to define the number of objects.
Step4: Calculating the labeled object's area, and sorts them in descending order.
Step5: Extract objects of largest area and eliminate the residual.
Step6: Fill holes of the binary images, fig (3-c).
Step7: Extract the lung's region by multiplying images of Step6×Step1.
C. Segmentation Process (K-Mean Classification)
The K-Means unsupervised classification calculates initial class means evenly distributed in the data space then iteratively clusters the pixels into the nearest class using a minimum distance technique. The means are recalculated in each iteration, the pixels are reclassified with respect to the new means. All pixels are classified to the nearest class unless a standard deviation or distance threshold is specified, in which case some pixels may be unclassified if they do not meet the selected criteria. This process continues until the number of pixels in each class changes by less than the selected pixel change threshold or the maximum number of iterations is reached.
Image acquisition Pre-processing Image Segmentation by K-Means classification
Feature extraction by region growing
[image:3.612.104.510.245.328.2]International Journal of Emerging Technology and Advanced Engineering
Website: www.ijetae.com (ISSN 2250-2459,ISO 9001:2008 Certified Journal, Volume 4, Issue 7, July 2014)
512
In fact, the K-means clustering algorithm is one of the most common used unsupervised classification methods used to determine the natural spectral groupings present in a data set. The process involves of grouping data points with similar feature vectors into a single cluster and grouping data points with dissimilar feature vectors into different clusters. The feature vectors derived from l
clustered data is given by [12]:
X = (xi| i = 1, 2, .., l) (1)
The generalized algorithm initiates k cluster centroids C C = (c
i| i = 1, 2, ..., k ) (2)
By randomly selecting k feature vectors from X, and grouping them into k clusters using a selected distance measure such as Euclidean distance;
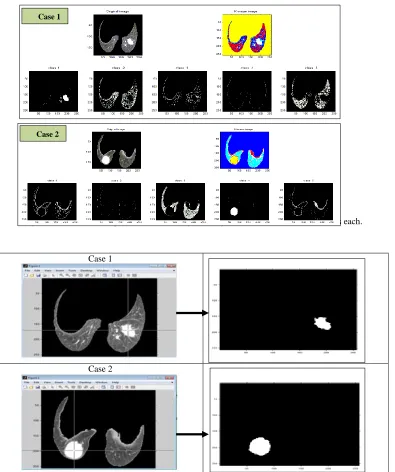
d = | xi - c j | (3) Figure (4) shows examples of K-means classification performed on two different lung's regions had cancer. Five classes have been assumed, including cancerous tissue. As is evident from the figures, the cancerous tissue (tumor) has been featured by different class number (i.e. class number one in case1, and class number four in case2).
Figure (3): illustrates the pre-processing steps performed to extract the lung's region.
D. Feature Extraction
Feature extraction concerns finding shape in digital images. To be able to recognize certain shape automatically, one approach is to extract the component features of the shape to be recognize. Shape extraction implies finding their position, their orientation and their size. In this research, we present the characterization of objects by utilizing region growing which is performed by examining properties of each block and merging them with adjacent blocks that satisfy some criteria. One criterion is to look at the max-min difference and combine adjacent regions whose max-min difference is within a tolerance of the seed block. The new region become the seed and the process is repeated, examining adjacent regions, comparing max-min differences, and adding blocks that are within the tolerance specified by the user.
Alternatively, the mean values of the blocks can be used to determine which blocks should be merged. However, the region growing process is stopped when no more pixels satisfy the criteria for inclusion in that region, [5]. The tumor region extraction by our region growing method is started by defining the coordinates of a point (within the tumor region) by clicking on it, then looking and merging the nearby points satisfying the region merging criterion (i.e. differ by absolute value 0.2). The merging process is stopped when no more points are existed that satisfy the merging criterion. Figure (5) the tumor region extraction process for the two patients cases shown in fig.(4).
Case 1
Case 2
[image:4.612.55.488.143.502.2] [image:4.612.137.476.278.504.2]International Journal of Emerging Technology and Advanced Engineering
Website: www.ijetae.com (ISSN 2250-2459,ISO 9001:2008 Certified Journal, Volume 4, Issue 7, July 2014)
513
Figure (4): Two cases of patients, classified by utilizing K-means method of five classes each.
Figure (5): Tumor region extraction of the two patient cases shown in fig.(4), using region growing merging method.
E. Area Calculation
The area of the extracted tumor region can be computed by counting the number of pixels enclosed by the tumor region and multiplying them by the size of the pixels. The pixel's size (i.e. area) can be determined from [13]:
2
) (
Size Matrix
DFOV (Area)
Pixel Size (4)
Where: DFOV is the Display Field of View (refer to how much of the scan field of view is reconstructed into an image), and Matrix Size represents the 2D grids of pixels used to compose the scanned images on display monitor.
Case 1
Case 2
Case 1
[image:5.612.113.508.133.605.2]International Journal of Emerging Technology and Advanced Engineering
Website: www.ijetae.com (ISSN 2250-2459,ISO 9001:2008 Certified Journal, Volume 4, Issue 7, July 2014)
514
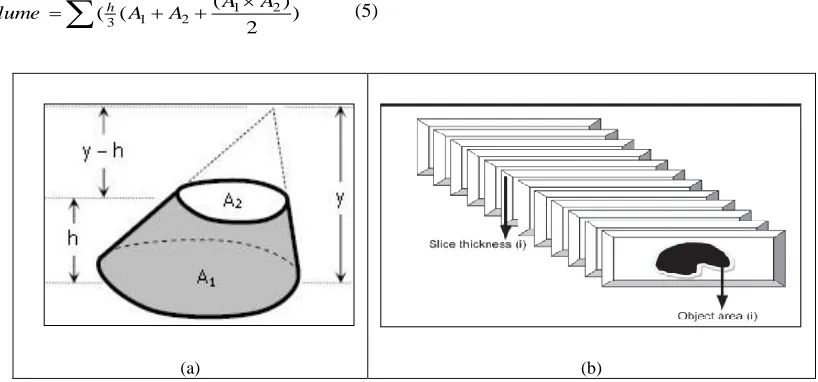
F. Volume CalculationThe extracted tumor volume can be calculated using frustum model (illustrated in figure (6)), using [13]:
) 2
) (
( (
1 2
2 1 3
A A A A
Volume h (5)
Where: h (Height) = slice thickness + slice separation, the volume of the tumor is given by the summation of volumes of two consecutive slices, A1 and A2 denote the areas of the two consecutive slices having tumor.
Figure (6): show (a) the frustum model, (b) the CT Slices
G. Area and Volume Calculation
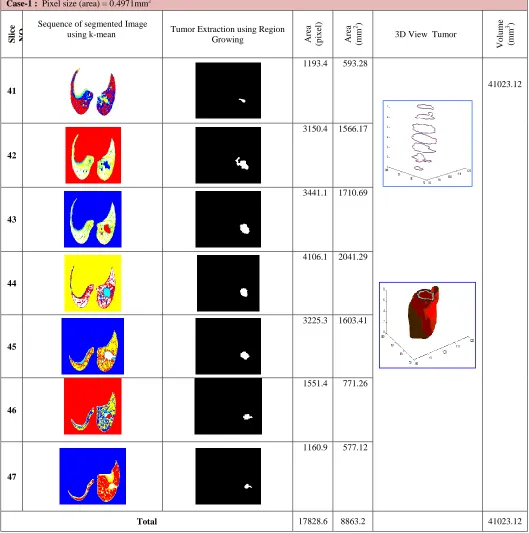
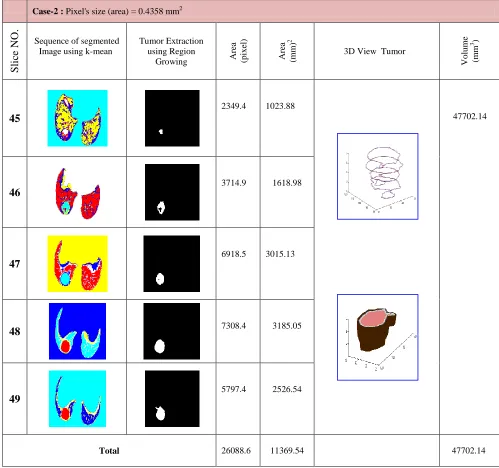
Tables (I and II) illustrate the 3D tumor reconstruction processes for the patient's cases 1&2. In table (I), the reconstruction process slices number 4147, while in table (II) the slices 4549 have been adopted for the reconstruction processes. The tumor extracted areas by the region growing method (represented by pixel's number and in mm2) using eq.(4). The matrix size of CT images was 512×512 elements, and the DFOVs were, respectively, 361mm and 338mm cases 1 &2. Finally, the reconstructed volume of the tumor from the extracted consecutive slice areas, using frustum model eq.(5).
V. CONCLUSIONS
In this paper, a semi-automatic segmentation algorithm for lung's tumor detection and extraction is presented. The extracted tumor areas from the CT slice is measured by a method based on the Display Field OF View (DFOV).
To provide physicians with volumetric data, the lung CT images have been pre-processed by enhancing their contrast to make them ready for segmentation by implementing the K-means classification algorithm. As the segmentation is performed on lung region, the tumor features have been determined and isolated by performing the seeded region growing algorithm. The tumor areas of the image slices have been calculated and used to determine the tumor volume by stacking the extracted tumors on top of one another. Finally, using physical spacing information inherent in the image slices the proposed method does, efficiently, 3D visualization of the tumor which we think it will be very useful as initial diagnosis which assisting the physicists in testing the response of the treatments. It is our opinion that; despite the successful results achieved by the introduced method, it is still more trends are required to make it run in fully automatic manner and in real-time by developing a hardware interface to analyzing and interpreting the CT images directly on the X-ray computerized axial tomography (CT) monitoring device.
[image:6.612.99.508.185.376.2]
International Journal of Emerging Technology and Advanced Engineering
Website: www.ijetae.com (ISSN 2250-2459,ISO 9001:2008 Certified Journal, Volume 4, Issue 7, July 2014)
[image:7.612.42.571.167.700.2]515
Table I
Region growing method used for tumor extraction, illustrate the 3D tumor reconstruction processes (area and volume of tumor calculation).
Case-1 : Pixel size (area) = 0.4971mm2
S
li
ce
NO
. Sequence of segmented Image
using k-mean Tumor Extraction using Region Growing Are
a
(p
ix
el)
Are
a
(m
m
2 )
3D View Tumor
Vo
lu
m
e
(m
m
3 )
41
1193.4 593.28
41023.12
42
3150.4 1566.17
43
3441.1 1710.69
44
4106.1 2041.29
45
3225.3 1603.41
46
1551.4 771.26
47
1160.9 577.12
International Journal of Emerging Technology and Advanced Engineering
Website: www.ijetae.com (ISSN 2250-2459,ISO 9001:2008 Certified Journal, Volume 4, Issue 7, July 2014)
[image:8.612.55.554.160.628.2]516
Table II
Region growing method used for tumor extraction, illustrate the 3D tumor reconstruction processes (area and volume of tumor calculation).
Case-2 : Pixel's size (area) = 0.4358 mm2
Sli
ce NO
.
Sequence of segmented Image using k-mean
Tumor Extraction using Region
Growing Are
a
(p
ix
el)
Are
a
(m
m
)
2
3D View Tumor
Vo
lu
m
e
(m
m
3 )
45
2349.4 1023.88
47702.14
46
3714.9 1618.98
47
6918.5 3015.13
48
7308.4 3185.0549
5797.4 2526.54
International Journal of Emerging Technology and Advanced Engineering
Website: www.ijetae.com (ISSN 2250-2459,ISO 9001:2008 Certified Journal, Volume 4, Issue 7, July 2014)
517
REFERENCES
[1] Pengfei Wu and D.V. G. L. N. Rao, "Medical Image Processing with
Optical Fourier Techniques,” Proceedings SBMO/IEEE
MTT-SIMOC, p.689,2003.
[2] Scott E. Umbaugh,"Digital Image Analysis and Processing”,
introduction to digital image analysis, second edition, by Taylor and Francis group, LLC, p77, 2011.
[3] Thomas M., Deserno, Til Aach, Katrin Amunts, Walter Hillen,
Torsten Kuhlen, Ingrid Scholl,”Advances in medical image processing”, Computer Science Research Development, Vol.26, p1, 2011.
[4] Sonali Patil, Dr. V. R. Udupi, "Preprocessing to be Considered For
MR and CT Images Containing Tumors”, IOSR Journal of Electrical and Electronics Engineering (IOSRJEEE), Vol.1, Issue 4, p54, 2012.
[5] Isaac H. Bankman, "Handbook of medical image processing and
analysis,” Jadwiga Rogowska “Overview and fundamentals of medical image segmentation,” Harvard Medical School, Elsevier Inc., p73, 2009.
[6] Alexander S. Behnaz, James S., Chibuzor E., Giuseppe E.,
Emmanuel W., Ziv Y., Emil C., Kevin C, "Quantitative CT for Volumetric Analysis of Medical Images: Initial Results for Liver Tumors,” Medical Imaging: Image Processing, Proc. of SPIE , Vol. 7623, p1, 2010.
[7] Mythily.A , Veena.M.U, "Segmentation and Classification of Lung
Tumor using Chest CT Image for Treatment Planning," International Journal of Engineering Trends and Technology (IJETT) , Jan 2014,Vol. 7, No. 2, p85, 2014.
[8] Jinghao Zhou, "Computer Aided Diagnosis of Lung Ground Glass
Opacity Nodules and Large Lung Cancers in CT," New Brunswick, New Jersey October, p2, 2008.
[9] Graham Brooker, "Sensors and Signals, Tomography and 3D
Imaging," University of Sydney, 2007.
[10] Hong Zhu, Weizhen S., Minhua Wu, Guixia G., Yong G.,
"Pre-Processing of X-ray Medical Image Based on Improved Temporal
Recursive Self-Adaptive Filter," The 9th International Conference for
Young Computer Scientists, IEEE computer society, 2008.
[11] Amir Rajaei Zhu Elham Dallalzadeh, Lalitha Rangarajan,
"Segmentation of Pre-processed Medical Images: An Approach Based on Range Filter,” I.J. Image, Graphics and Signal Processing, 9, 8-16, 2012.
[12] Anil Z Chitade, "Color Based Image Segmentation using K-Means
Clustering,” International Journal of Engineering Science and Technology, Vol. 2,NO.10, p5319-5325, 2010.
[13] Shally HR and Chitharanjan K, "Tumor volume calculation of brain
![Figure (1): illustrates the working technology of the spiral scan tomography [9]](https://thumb-us.123doks.com/thumbv2/123dok_us/8711990.882150/2.612.182.431.473.590/figure-illustrates-working-technology-spiral-scan-tomography.webp)