Assessment of the Effect of
Climate Change in Anticipated Water
Resources Availability in Arid Climate
Zones
A thesis submitted in partial fulfillment of the requirements for the degree of
Doctor of Philosophy
By
Ruqayah Kadhim Mohammed
B.Sc., M.Sc.
School of Computing Science and Engineering
University of Salford
Manchester
UK
i
Table of Contents
Table of Contents ... i
List of Figures ... iv
List of Tables ... x
Acknowledgements ... xii
Dedication ... xiii
Published Journal Papers Declaration ... xiv
Submitted Journal Papers Declaration ... xvii
Conferences Declaration ... xviii
Abbreviations ... xx
Abstract ... xxv
Chapter 1: INTRODUCTION ... 1
1.1 General Background ... 1
1.2 Problem Statement ... 2
1.3 Aim and Objectives ... 3
1.4 Thesis Outline ... 7
Chapter 2: CRITICAL LITERATURE REVIEW ... 9
2.1 Overview ... 9
2.2 Hydro-Climatic Data Trend Analysis ... 10
2.3 Drought Analysis ... 12
2.4 Hydrograph Analysis ... 17
2.5 Hydrologic Alteration ... 21
2.6 Anthropogenic Interventions Evaluation ... 26
2.7 Climate Change Scenarios ... 29
2.8 Climate Change Evaluation ... 33
2.9 Climate Forecasting System Reanalysis Data ... 35
Chapter 3: METHODS, MODELS, AND APPLICATIONS ... 36
ii
3.2 Representative Case Study ... 36
3.3 Data Availability and Collection ... 40
3.4 Tools Implemented ... 43
3.5 Methodology ... 45
3.5.1 Hydro-Climatic Data Trend Analysis ... 45
3.5.2 Potential Evapotranspiration Estimation ... 46
3.5.2.1 Hargreaves Method ... 47
3.5.2.2 Thornthwaite Method ... 47
3.5.2.3 Blaney–Criddle Method ... 48
3.5.2.4 Food and Agriculture Organization: Penman-Monteith Method ... 49
3.5.3 Basin Average Precipitation Computation ... 49
3.5.4 Drought and Aridity Identification ... 50
3.5.4.1 Standardised Precipitation Index ... 50
3.5.4.2 Reconnaissance Drought Index ... 52
3.5.4.3 Standardised Precipitation Evapotranspiration Index ... 53
3.5.4.4 Stream Drought Index ... 55
3.5.5 Hydrograph Analysis ... 56
3.5.6 Hydrologic Alteration ... 58
3.5.7 Normal Years Identification ... 59
3.5.8 Rainfall-Runoff Simulation ... 60
3.5.8.1 Hydrologic Sensitivity Analysis Method ... 62
3.5.8.2 Multi-Regression Method ... 63
3.5.8.3 Separation Effect Framework ... 64
3.5.8.4 Climate Change Impact ... 65
3.5.8.5 Model Performance Criteria ... 65
3.5.9 Climate Change Scenarios ... 66
3.5.10 Long Ashton Research Station Weather Generator Model ... 67
3.5.11 Reservoir Capacity-Yield-Reliability Relationship ... 73
Chapter 4: RESULTS AND DISCUSSION ... 76
4.1 Hydro-Climatic Data Trend Analysis ... 76
4.2 Hydro-Climatic Data Change Point Detection ... 82
4.3 Basin Average Precipitation Computation ... 86
4.4 Drought Analysis ... 88
4.4.1 Drought Identification ... 88
4.4.2 Reconnaissance Drought Index Sensitivity Analysis ... 92
4.4.2.1 Impacts of Potential Evapotranspiration Methods ... 94
4.4.2.2 Reconnaissance Drought Index as a Climatic Index ... 102
4.4.2.3 Drought and Aridity Trends, and Future Scenarios ... 107
4.4.3 Relationships between Meteorological and Hydrological Drought ... 112
4.5 Hydrograph Analysis ... 113
4.5.1 Flow Duration Curve Linked to Digital Filtering Algorithms ... 114
iii
4.5.1.2 Downstream Sub-Basin ... 115
4.5.2 Anthropogenic Intervention Impact on the Hydrograph ... 117
4.5.3 Climate Change and Drought Episode Impact on the Hydrograph ... 119
4.5.4 Seasonal Variations of the Baseflow Index ... 123
4.6 Hydrologic Alteration ... 124
4.6.1 Overview ... 124
4.6.2 Anthropogenic Intervention Impact of on the Streamflow ... 126
4.7 Anthropogenic Interventions Evaluation ... 130
4.7.1 General... 130
4.7.2 Rainfall-Runoff Models Calibration and Validation ... 131
4.7.3 Multi-Regression Equation ... 131
4.7.4 Methods of Hydrologic Sensitivity Analysis... 133
4.7.5 Methods of Hydrological Simulation ... 133
4.7.6 Comparison of Simple Average Method and Single Model Predictions... 135
4.8 Climate Change Evaluation ... 139
4.8.1 Rainfall-Runoff Simulation ... 140
4.8.2 LARS-WG5.5 Calibration and Validation ... 142
4.8.3 Meteorological Variables ... 148
4.8.4 Drought Identification ... 150
4.8.5 Hydrologic Alteration ... 154
4.8.5.1 Delta Perturbation Scenario ... 154
4.8.5.2 General Circulation Model Scenario ... 165
4.8.6 Reservoir Inflow ... 167
4.8.7 Reservoir Capacity-Yield-Reliability Relationships ... 171
Chapter 5: CONCLUSIONS AND RECOMMENDATIONS ... 176
5.1 Conclusions ... 176
5.1.1 Drought Analysis ... 176
5.1.2 Hydrograph Analysis ... 178
5.1.3 Streamflow Alteration ... 180
5.1.4 Anthropogenic Interventions Evaluation ... 181
5.1.5 Climate Change Evaluation ... 182
5.2 Recommendations for Future Research ... 183
5.3 Limitations of the Study ... 185
References... 186
Appendix A Climate Forecasting System Reanalysis Datasets and Land-Based
Datasets Correlation ... A-1 Appendix B Published Journal Papers ... B-1
iv
List of Figures
Figure 1.1 The advancement of the objectives to achieve the main research aim ... 5
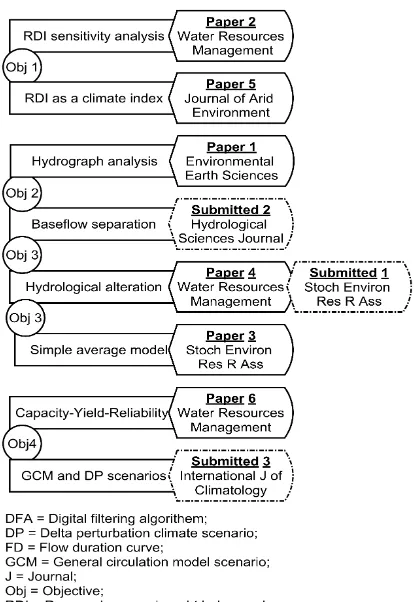
Figure 1.2 Flowchart lists the published and the submitted journal papers based on the research objectives .. 6
Figure 2.1 Constant flow rate graphical method for baseflow separation ... 18
Figure 2.2 Flow duration curve for the Lower Zab River at the Dokan hydrological station for the water years from 1989 to 2001 ... 19
Figure 2.3 Recession curve, period, and segment ... 20
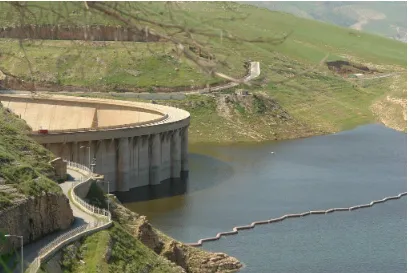
Figure 2.4 Dokan dam (35°57'14'' N and 44°57'10'' E), northern Iraq, represents an anthropogenic intervention on a river ... 27
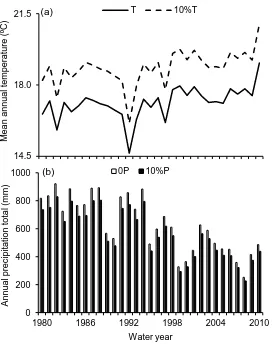
Figure 2.5 Application of the synthetic climate change scenario to the (a) Annual mean air temperature (T); and (b) Reduction in the annual precipitation (P) (mm), over the Lower Zab River Basin, northern Iraq ... 33
Figure 3.1 (a) The hydrographical network of the region studied is located in (b) Iraq, which is shown on the (c) world map ... 39
Figure 3.2 Mean annual discharges at the two main gauging stations along the Lower Zab River for the time-period between 1932 and 1987 ... 40
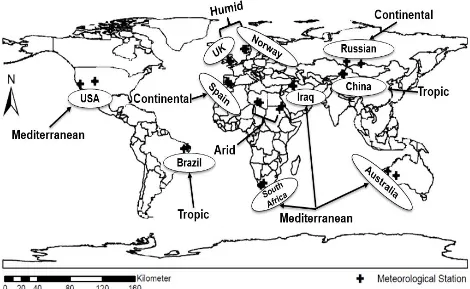
Figure 3.3 The locations of the selected gridded meteorological stations, Climate Forecast System Reanalysis (CFSR, 2015; Retrieved 05th September 2015 from http://globalweather.tamu.edu/home/) ... 41
Figure 3.4 Water level-surface area-capacity relationships for the Dokan Reservoir; (a) Water level-capacity relationship; and (b) Surface area-capacity relationship ... 71
Figure 4.1 Annual values and trends of (a) Mean air temperature and precipitation, and (b) Potential evapotranspiration (PET) Lower Zab River Basin for the time-period between 1979 and 2013 ... 79
Figure 4.2 The long-term spatial distribution of the mean air temperature over the Lower Zab River Basin 80
Figure 4.3 Spatial distribution of the long-term precipitation over the Lower Zab River Basin ... 81
Figure 4.4 Annual runoff coefficient for the 1979–2014 period in Lower Zab River Basin ... 82
Figure 4.5 Pettitt test for detecting a change in the annual: (a) precipitation; and (b) runoff ... 84
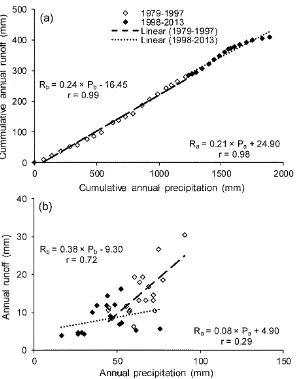
Figure 4.6 (a) Precipitation-runoff double cumulative curve (PR-DCC) of annual precipitation and runoff in the Lower Zab River basin; and (b) correlation between precipitation and runoff for the two considered time-period ... 85
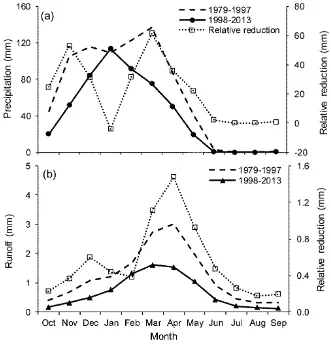
Figure 4.7 Average monthly (a) precipitation; and (b) runoff for the baseline (1979–1997) and the altered periods between 1998 and 2013 ... 86
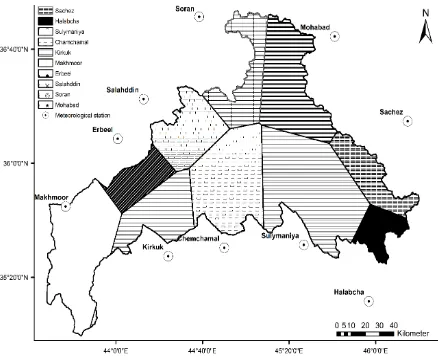
Figure 4.8 The sub-basins areas based on the application of Thiessen network analysis to compute the basin average precipitation ... 87
Figure 4.9 Predicted annual streamflow drought index (SDI) equations based on (a) the standardised precipitation index (SPI); (b) the standardised reconnaissance drought index (RDIst); and (c) the standardised
v
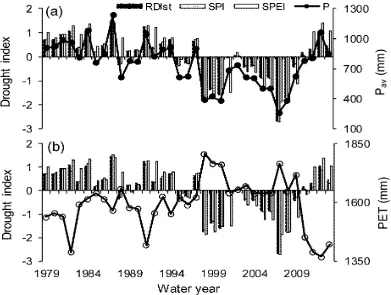
Figure 4.10 Temporal variations of the standardised reconnaissance drought index (RDIst), standardised
precipitation index (SPI), and standardised precipitation evapotranspiration index (SPEI) coupled with the long-term average; (a) precipitation (Pav) for the Lower Zab River Basin (LZRB) for the period from 1979 to
2014; and (b) potential evapotranspiration (PET) for the LZRB for the period from 1979 to 2014 ... 90
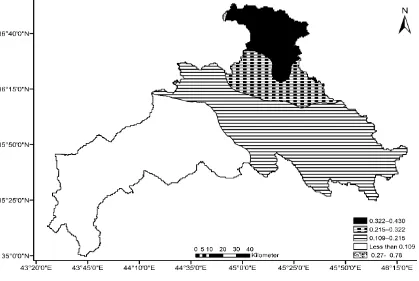
Figure 4.11 The spatial distribution of the worst drought that occurred over the Lower Zab River Basin during the water year 2007/2008 ... 91
Figure 4.12 The spatial distribution of the long-term aridity over Lower Zab River Basin during the water year 2007/2008 ... 91
Figure 4.13 The locations of the selected gridded meteorological stations based on the Climate Forecasting System reanalysis dataset (CFSR, 2015) (http://globalweather.tamu.edu/home/) ... 93
Figure 4.14 Potential evapotranspiration (PET) estimated by Hargreaves (HG), Thornthwaite (ThW) and Blaney-Criddle (BC) methods with the results of FAO Penman-Monteith (PM) methodology for reference for different climatic conditions: (a) Mediterranean, (b) tropical, (c) continental, (d) Sahara, and (e) humid ... 97
Figure 4.15 The alpha reconnaissance drought index (RDIα12) values estimated by Hargreaves (HG),
Thornthwaite (ThW), and Blaney-Criddle (BC) potential evapotranspiration methods with the results of FAO Penman-Monteith (PM) methodology for reference for two different elevations each in (a) and (b) West Australia, (c) and (d) South Africa, (e) and (f) North Iraq, and (g) and (h) UK ... 101
Figure 4.16 (a) The annual reconnaissance drought index alpha form (RDIα12) form values for Mediterranean
(MD), tropical (TR), conventional (CN), Sahara, and humid climatic conditions; (b) different elevations;(c) The normalised annual reconnaissance drought index (RDIn) values for different elevations; and (d) The
standardised annual reconnaissance drought (RDIst) index values for different elevations ... 102
Figure 4.17 The time series of 35 water years of the alpha form of the reconnaissance drought index (RDIα12)
representing Mediterranean (MD), tropical (TR), conventional (CN), Sahara, and humid climate conditions ... 104
Figure 4.18 Time series for 35 water years of the alpha form of the reconnaissance drought index (RDIα6)
seasonal values for (a) South Africa; (b) North Iraq; (c) West Australia; (d) South USA; (e) East China; (f) East Brazil; (g) South-East Spain; and (h) South Russia ... 105
Figure 4.19 Time series of 35 water years of the alpha form of the reconnaissance drought index (RDIα6)
seasonal values, representing arid and humid climates: (a)Libya; (b) Al-Sudan; (c) the United Kingdom; and (d) Norway ... 106
Figure 4.20 The normalized reconnaissance drought index (RDIn) concerning a time series of 35 water years
for (a) an annual reference period; (b) the winter season (October to March); and (c) the summer season (April to September) ... 107
Figure 4.21 Annual values and trends of aridity index (RDIα12) and precipitation (P) for (a) Mediterranean;
and (b) tropical; (c) conventional; and (d) humid, climatic conditions for the time-period between 1979 and 2014 ... 111
Figure 4.22 Annual values and trends of aridity index (RDIα12) and potential evapotranspiration (PET) for (a)
Mediterranean; and (b) tropical; (c) conventional; and (d) humid, climatic conditions for the time-period between 1979 and 2014 ... 111
Figure 4.23 Annual streamflow drought index (SDI) forecasting equations based on the standardised reconnaissance drought index (RDIst) for the reference time-periods of 12, 6, and 3 months: (a) RDIst (12
months) – SDI (12 months), (b) RDIst (6 months) – SDI (12 months) and (c) RDIst (3 months) – SDI (12
vi
Figure 4.24 New methodology for assessing the impacts of river damming as well as climate change and drought events on the groundwater contribution to river flow, which belongs to objectives four and five .. 113
Figure 4.25 Linear regression models for the relationships between the separated baseflow using Eckhardt and Chapman methods, and the total runoff at upstream (US) and downstream (DS) sub-basins for (a) pre-damming; (b) post-pre-damming; and (c) integrated, time-periods; and (d) annual baseflow index (BFI) variability as a function of time for US and DS sub-basins, estimated by the Eckhardt recursive digital filtering algorithms coupled with the flow duration curve ... 116
Figure 4.26 Long-term monthly variation of total flow (TF), baseflow (BF), and the baseflow index (BFI) estimated by the Eckhardt filtering algorithm coupled with the flow duration curve (FDC) for the pre-alteration and post-alteration time-periods at (a) Dokan hydrometric station and (b) Altun Kupri-Goma Zerdela station ... 119
Figure 4.27 Long-term baseflow index (BFI) with both wet and dry year thresholds coupled with long-term average precipitation for the periods between 1979 and 2013 for (a) Dokan and (b) Altun Kupri-Goma Zerdela stations, respectively ... 121
Figure 4.28 Box plot indicating (a) the total runoff; (b) the baseflow; and (c) the baseflow index at the inlet of the basin based on the delta perturbation climate scenario. Note: future F1 to F4 (0% reduction in precipitation
(P) linked with 0,10, 20, and 30% increase in potential evapotranspiration (PET), respectively), F5 to F8 (10%
reduction in P linked with 0,10, 20, and 30% increase in PET, respectively), F9 to F12 (20% reduction in P
linked with 0,10, 20, and 30% increase in PET, respectively), F13 to F16 (30% reduction in P linked with 0,10,
20, and 30% increase in PET, respectively), F17 to F20 (40% reduction in P linked with 0,10, 20, and 30%
increase in PET, respectively). Note: Obs = Observed... 122
Figure 4.29 The standardised reconnaissance drought index (RDI) coupled with the long-term baseflow index (BFI) for the Lower Zab River basin between 1979 and 2013 for (a) Dokan and (c) Altun Kupri-Goma Zerdela stations in this order ... 123
Figure 4.30 Seasonal variations of the BFI estimated by the Eckhardt filtering algorithm coupled with the flow duration curve for the three studied time-periods at (a) Dokan and (b) Altun Kupri-Goma Zerdela stations, respectively ... 124
Figure 4.31 The detailed advancement of the objective five ... 125
Figure 4.32 Annual median anomaly for the period between 1966 and 2014 with both wet and dry year thresholds coupled with long-term average precipitation over the study area for the time span between 1979 and 2014 ... 126
Figure 4.33 The long-term median monthly flows of the pre-altered and the three altered time scales coupled with their anomalies ... 128
Figure 4.34 Comparison of monthly percentiles between pre-damming and post-damming periods coupled with the alteration ratio for the (a) 10th; (b) 25th; (c) 50th; (d) 75th; and (e) 90th percentiles ... 129
Figure 4.35 Monthly relationship between precipitation and runoff for the (a) 1979–1997, and (b) 1998–2013 periods ... 131
Figure 4.36 Monthly observed and simulated runoff by multi-regression method at the Dokan hydrologic station for the (a) 1979–1997; and (b) 1998–2013 periods, respectively ... 132
Figure 4.37 Scatter diagram and correlation of annual actual evapotranspiration (AET) estimated from a water balance equation and predicted using equation (3.29) for the time-period between 1979 and 1997 ... 133
vii
Figure 4.39 Linear regression between observed and simulated runoff: (a) Medbasin, Ge´nie Rural a Daily 4 parameters (GR4J), and Hydrologiska Byråns Vattenbalansavdelning (HBV) models; (b) simple average model (SAM), excluding the best model (B) and the worst model (W) simulation results, for the Dokan hydrological station ... 137
Figure 4.40 Monthly observed (Obs) and simulated runoff using Medbasin, Ge´nie Rural a Daily 4 parameters (GR4J), and Hydrologiska Byråns Vattenbalansavdelning (HBV) models at the Dokan hydrological station for the (a) 1979–1997; and (b) 1998–2013 periods ... 138
Figure 4.41 Monthly observed (Obs) and simulated runoff using simple average method (SAM), excluding the best model (B) results and eliminating the worst model results (W) for the Dokan hydrological station for the (a) 1979–1997; and (b) 1998–2013 periods ... 139
Figure 4.42 The detailed advancement of the objective seven ... 140
Figure 4.43 The selected time-period that represented (on average) the normal climatic conditions during which no extreme RDIst values were recorded and when (on average) the RDIst value is close to zero ... 141
Figure 4.44 Observed against simulated streamflow time series using the Hydrologiska Byråns Vattenbalansavdelning model for (a) and (b) calibration period (1988/1989–1999/2000); and (c) and (d) validation period (1979/1980–1986/1987), respectively ... 141
Figure 4.45 Observed against simulated streamflow time series using the Hydrologiska Byråns Vattenbalansavdelning model (Note that there was an outlier (1570 m3/s), which has been removed ... 142
Figure 4.46 (a) Lower Zab River Basin (LZRB) anticipated relationship of the standard reconnaissance drought index (RDIst) and RDI alpha form; (b) LZRB anticipated relationship of streamflow drought index
(SDI) and runoff ... 142
Figure 4.47 Comparison between observed monthly (mean and standard deviation (SD)) precipitation (P) and the corresponding values that generated by LARS-WG5.5 at each meteorological station within the studied basin for the time-period 1980–2010 ... 146
Figure 4.48 Comparison between observed mean monthly (maximum (Tmin) and minimum (Tmax)) temperature
and the corresponding values that generated by LARS-WG5.5 at each meteorological station within the studied basin for the baseline (1980–2010) ... 147
Figure 4.49 Mean monthly (a) minimum temperature (Tmin); (b) maximum temperature (Tmax); and (c)
precipitation (P), for the baseline (1980–2010), 2010–2030, 2046–2065, and 2080–2099 time-periods that downscaled for seven ensemble general circulation models ... 149
Figure 4.50 Box plot shows the changes in (a), (b), and (c) minimum temperature (Tmin); (d), (e), and (f)
maximum temperature (Tmax); and (g), (h), and (i) precipitation over the studied basin downscaled from seven
GCM using LARS-WG5.5 during the time horizon 2011–2030, 2046–2065, and 2080–2099 compared to the baseline period (1980–2010) ... 150
Figure 4.51 The Lower Zab River Basin anticipated (%) streamflow change for selected delta perturbation climatic scenarios. Note: PET is the potential evapotranspiration ... 151
Figure 4.52 Anticipated: (a) standardised reconnaissance drought index (RDIst); (b) streamflow drought index
(SDI); and (c) relationship between RDIst and SDI, for Lower Zab River Basin for each delta perturbation
scenario. Note: PET is the potential evapotranspiration ... 151
Figure 4.53 Temporal variations of the annual standardised reconnaissance drought index (RDIst) and annual
streamflow index (SDI) coupled with the long-term average precipitation (Pav) (left graphs) and potential
viii
(f) 2046–2065; and (g) and (h) 2080–2099 time horizons, respectively, under the General Circulation Models, over the representative basin ... 153
Figure 4.54 Comparison of monthly percentiles between the baseline (1988―2000) and two future climate change scenario examples, which are F9 (20% reduction in precipitation (P) linked with 0% increase in
potential evapotranspiration (PET)) and F13 (30% reduction in P linked with 0% increase in PET) coupled with
the alteration ratio for the (a) 10th; (b) 25th; (c) 50th; (d) 75th; and (e) 90th percentiles ... 157
Figure 4.55 (a) Comparison of the long-term monthly median flows between the baseline and some climate change scenario examples, and (b) Anticipated alteration in the long-term mean monthly flow, in the Lower Zab River, due to a reduction in precipitation (P). Note: future F5 and F6 (10% reduction in P linked with 0 and
10% increase in potential evapotranspiration (PET), respectively), F9 and F10 (20% reduction in P linked with
0 and 10% increase in PET, respectively), and F13 and F14 (30% reduction in P linked with 0 and 10% increase
in PET, respectively) ... 159
Figure 4.56 (a) Sensitivity analysis for the separated baseflow (BF), with respect to the impact of precipitation (P) reduction; (b) Sensitivity analysis for the separated BF, with respect to the impact of the potential evapotranspiration (PET) increase, using the separation technique that has been proposed by Mohammed and Scholz (2016); and (c) Sensitivity analysis of the BF alteration concerning the impact of the P reduction. Note: Future scenarios F5 (10% reduction in P linked with 0% increase in PET); and F6, F7, and F8 (10% reduction
in P linked with 10, 20, and 30% increase in PET, respectively); and F9 (20% reduction in P linked with 0%
increase in PET) ... 161
Figure 4.57 Box-whisker plot for the minima and maxima (a) and (e) 1-day; (b) and (f) 3-day; (c) and (g) 7-days; and (d) and (h) 30-days, respectively. Note: future F1 and F3 (0% reduction in precipitation (P) linked
with 0 and 20% increase in potential evapotranspiration (PET), respectively), F5 and F7 (10% reduction in P
linked with 0 and 20% increase in PET, respectively), F9 (20% reduction in P linked with 0% increase in PET),
F11 and F15 (20 and 30% reduction in P, respectively, linked with 20% increase in PET), F17 and F19 (40%
reduction in P linked with 0 and 20% increase in PET, respectively) ... 163
Figure 4.58 The sensitivity analysis of the significance account and the deviation factor for the precipitation (P) reduction and potential evapotranspiration (PET) increase for the (a), (b), (e), and (f) median as well as (c), (d), (g) and (h) coefficient of distribution, respectively. Note: future F5 and F9 (10 and 20% reduction in P,
respectively, linked with 0% increase in PET), F10 and F11 (20% reduction in P linked with 10 and 20% increase
in PET, respectively), F12 (20% reduction in P linked with 30% increase in PET), F13 and F17 (30 and 40%
reduction in P, respectively, linked with 0% increase in PET) ... 164
Figure 4.59 Comparison of monthly percentiles between the baseline 1980–2010 and future climate change scenario for the (a) 10th; (b) 25th; (c) 50th; (d) 75th; and (e) 90th percentiles... 167
Figure 4.60 The proposed new modeling approach for the evaluation of the potential impacts of climate change on the water resources system, which belongs to the objective eight. Note: HBV is the Hydrologiska Byråns Vattenbalansavdelning hydrological model ... 169
Figure 4.61 Changes in the timing and magnitude of the predicted monthly average inflow to the Dokan reservoir, under the global circulation models (GCM) scenarios (left figures): (a) 2011–2030; (c) 2046–2065; and (e) 2080–2099; time horizon and (g) comparison of the three future time horizons, compared to baseline (1980–2010) values; and delta perturbation scenarios (right figures) (b) 10% increase in precipitation (P); (d) 20% increase in P; (f) 30% increase in P; and (h) 40% increase in P compared to the baseline (1988–2000) values ... 170
Figure 4.62 Box-plot of the Dokan reservoir; (a) operational probability of failure (OPOF, %); and (b) required storage (106×m3) under the collective impacts of climate change scenarios. Note: future F
1 and F3 (0%
reduction in precipitation (P) linked with 0 and 20% increase in potential evapotranspiration (PET), respectively), F5 and F7 (10% reduction in P linked with 0 and 20% increase in PET, respectively), F9 and F11
ix
20% increase in PET), F17 and F19 (40% reduction in P linked with 0 and 20% increase in PET, respectively)
x
List of Tables
Table 3.1 The Tigris river tributaries with their important properties (UN-ESCWA, 2013) ... 37
Table 3.2 Address of the meteorological stations that are distributed over the Lower Zab River Basin ... 41
Table 3.3 Categories of the selected gridded meteorological stations from different climatic conditions throughout the world ... 42
Table 3.4 Dokan reservoir topographic features ... 43
Table 3.5 Drought and aridity classifications based on the standardised reconnaissance drought index (RDIst)
and the alpha reconnaissance drought index (RDIα12) values ... 53
Table 3.6 Drought classifications based on the streamflow drought index (SDI) values ... 56
Table 3.7 Precipitation (P) for normal hydrological years ... 60
Table 3.8 Global climate models (GCM) from Intergovernmental Panel on Climate Change (IPCC) fourth assessment report (AR4) integrated into the Long Ashton Research Station Weather Generator (LARS-WG5.5); T1: 2011–2030; T2: 2046–2065; T3: 2081–2100 (Adapted from: Semenov and Stratonovitch, 2010)
... 68
Table 3.9 Carbon dioxide (CO2) concentrations for selected climate scenarios specified in the Special Report on Emissions Scenarios (SRES) (Adopted from Semenov and Stratonovitch, 2010) ... 69
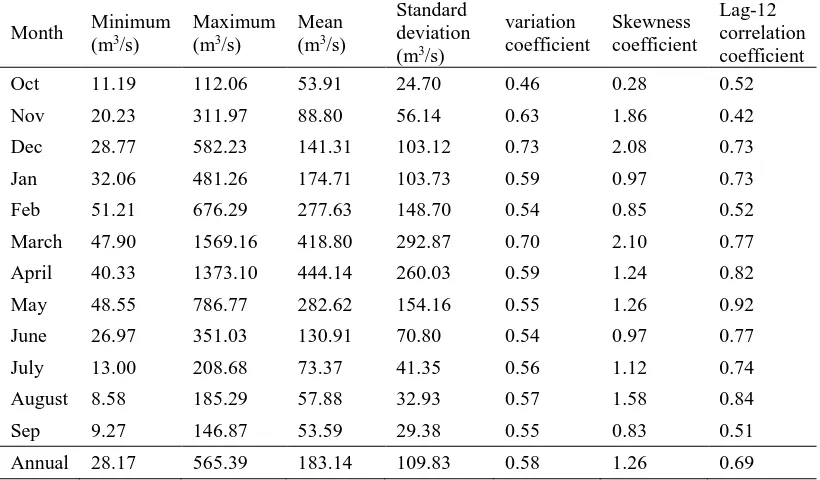
Table 3.10 Statistical properties of the Dokan reservoir inflow ... 72
Table 4.1 Statistical properties of meteorological variables representing the non-parametric test for different climatic conditions, in addition to the Lower Zab River basin (LZRB) as semi-arid representative case study ... 78
Table 4.2 Long-term average monthly to long-term annual precipitation ratios ... 81
Table 4.3 Changes in mean annual precipitation, potential evapotranspiration, and runoff during recent hydrological periods ... 85
Table 4.4 Station addresses with corresponding average precipitations and the sub area sizes ... 87
Table 4.5 The distribution-free analysis for the three of the widely used meteorological drought indices in addition to the person correlation coefficient r, over the studied basin ... 88
Table 4.6 Statistical performance indicators of the annual reconnaissance drought index (RDIn) for the
normalised values estimated by various potential evapotranspiration methods against the reference method, for different locations all over the world ... 94
Table 4.7 Statistical performance indicators of the annual reconnaissance drought index for the standardised values (RDIst) estimated by various potential evapotranspiration methods against the reference method for
different locations throughout the world ... 98
Table 4.8 Statistical performance indicators of the annual reconnaissance drought index for the initial values αk at k=12 months (RDIα12) estimated by various potential evapotranspiration methods against the reference
xi
Table 4.9 Trend analysis representing climate change impact on drought index calcification for different climate conditions throughout the world, in addition to the Lower Zab River Basin (LZRB) as a specific semi-arid case study ... 109
Table 4.10 Trend analysis representing climate change impacts on the aridity calcification (RDIα12) for
different climate conditions throughout the world, in addition to the Lower Zab River Basin (LZRB) as a specific semi-arid case study ... 110
Table 4.11 The developed linear regression models for the upstream and downstream sub-basins at the three considered periods using both the Eckhardt algorithm linked to the flow duration curve and the Chapman digital algorithm ... 117
Table 4.12 Annual river flows, storages, means of changed to unchanged storage ratios, and median anomalies between the periods from 1979–1980 to 1987–1988 and from 1998–1999 to 2008–2009 ... 128
Table 4.13 The alteration ratio for the annual median, minima, and maxima flow for the pre-damming and post-damming periods ... 130
Table 4.14 Performance measures for the calibration and validation time-periods using the Ge´nie Rural a Daily 4 parameters (GR4J), Medbasin, and Hydrologiska Byråns Vattenbalansavdelning (HBV) simulation models ... 135
Table 4.15 Climate change and anthropogenic interventions impacts on mean annual runoff (R) during recent hydrological periods using different rainfall-runoff simulation methods ... 135
Table 4.16 The Long Ashton Research Station Weather Generator (LARS-WG5.5) validation results including Kolmogorov-Smirnov (K-S) test (see section 3.5.10) for seasons of wet and dry years series distributions during baseline period of 1980–2010 ... 144
Table 4.17 The Long Ashton Research Station Weather Generator (LARS-WG5.5) validation results including Kolmogorov-Smirnov (K-S) test (see section 3.5.10) for daily rain distributions during the baseline period of 1980–2010 ... 145
Table 4.18 Hydrologic alteration for the middle range of variability approach (RVA) category of the Lower Zab River ... 156
Table 4.19 Comparison of some monthly parameters between the baseline (1988―2000) and two of the selected climate change scenarios ... 160
Table 4.20 Hydrologic alteration for the middle range of variability approach (RVA) category of the Lower Zab River for the three future time-periods compared to baseline 1980–2010 ... 166
Table 4.21 Summary of water resources system performance under the collective impacts of precipitation (P) and potential evapotranspiration (PET) for 82% yield ... 173
Table 4.22 Statistical relationships between yield (Y, %) and operational probability of (reservoir) failure (OPOF, %) and reservoir capacity (C, 106 m3) and yield for different reduction (%) in precipitation (P) and
increase (%) in potential evapotranspiration (PET) using delta perturbation climate change scenarios ... 175
Table 4.23 Compared the results of the statistical relationships between the water yield (Y, %) and the operational probability of (reservoir) failure (OPOF, %) and the reservoir capacity (C, 106 m3) and the Y %
xii
Acknowledgements
I thank the most gracious, the most merciful ALLAH for giving me the ability and the patience to complet this study.
Primarily, I would like to express my special appreciation to my supervisor Professor Miklas Scholz, you have provided exceptional academic guidance. I would like to thank you for encouraging my research from the start, and your support throughout the study period has been priceless. I am grateful for the opportunity to have worked under your supervision on this subject, through which I have learnt so much in addition to the Ph.D. itself. You have supported my development in the research community through our publications in (peer-reviewed) journals and have supported my papers in many regional and international conferences.
xiii
Dedicated
To
My Mother
Who passed away recently
A strong and gentle soul who taught me to trust in Allah, believe in hard work, and that so
xiv
Published Journal Papers Declaration
Six papers have been published in the following (peer-reviewed) journals as a part of the
current research achievements:
Paper 1 Mohammed R, Scholz M (2016) Impact of climate variability and streamflow alteration on groundwater contribution to the baseflow of the Lower Zab River (Iran and Iraq). Environmental Earth Science 21(75):1–11. doi:10.1007/s12665-016-6205-1
Authors contributions: The first author undertook the data collection and analysis and prepared the paper draft, which was revised by Miklas Scholz.
Paper 2 Mohammed R, Scholz M (2017a) Impact of evapotranspiration formulations at various elevations on the reconnaissance drought index. Water Resources Management 31(1):531‒548. doi:10.1007/s11269-016-1546-9
Authors contributions: Ruqayah Mohammed pledged the data collection and analysis, results visualisation and discussion, in addition to preparing the paper draft, which was revised by Miklas Scholz.
Paper 3 Mohammed R, Scholz M, Nanekely MA, Moktari Y (2017a) Assessment of models predicting anthropogenic interventions and climate variability on surface runoff of the Lower Zab River.
Stochastic Environmental Research and Risk Assessment. doi.10.1007/s00477-016-1375-7 (in press)
xv
revised by Miklas Scholz. Nanekely helped in collecting some required data, and Moktari undertaking part of the hydrological models.
Paper 4 Mohammed R, Scholz M, Mohammad ZK (2017b) Temporal hydrologic alterations coupled with climate variability and drought for transboundary river basins. Water Resources Management
31(5):1489–1502. doi:10.1007/s11269-017-1590-0
Authors contributions: Ruqayah Mohammed undertook the data (hydrological and meteorological) collection, investigation, and analysis, results visualisation and discussion, and prepared the paper draft. Miklas Scholz revised the paper draft. Kermani provided an article regarding the study area.
Paper 5 Mohammed R, Scholz M (2017b) The reconnaissance drought index as a climatic index for the detection of climatic variability for various geographical areas but with particular reference to arid environments. Journal of Arid Environments 144:181–191. doi:10.1016/j.jaridenv.2017.03.014
Authors contributions: Ruqayah Mohammed undertook the meteorological data collection, investigation, and analysis, results visualisation and discussion and prepared the draft paper, which was revised by Miklas Scholz.
xvi
Additional Published Journal Paper Outside the Current Research Topic
Paper 4
Mohammed R, Scholz M (2017) Review of salinity intrusion in rivers and estuaries: Potential impacts of freshwater flow and tidal mixing, human interventions and sea level rise. Journal of Water and Climate Change. doi:10.2166/wcc.2017.334.
xvii
Submitted Journal Papers Declaration
Four papers have been submitted for publication in the following
(peer-reviewed) journals as a part of the current research achievements:
Paper 1 Mohammed R, Scholz M (2017) Integration of the flow duration curve into digital filtering algorithms simulating climate variability and human-induced impacts on the river baseflow. Hydrological Sciences Journal
Authors contributions: Ruqayah Mohammed undertook the paper work, such as data exploration and examination, results visualisation and discussion, and organised the paper draft. Whereas, Miklas Scholz revised the paper draft.
Paper 2 Mohammed R, Scholz M (2017) Evaluation of the climate variability and human-induced impacts on the hydrologic anomalies and river-groundwater exchange in a semi-arid area. Stochastic Environmental Research and Risk Assessment
Authors contributions: Ruqayah Mohammed undertook the paper work, such as the data exploration and examination, results visualisation and discussion and organised the paper draft. Miklas Scholz revised the paper draft.
Paper 3 Mohammed R, Scholz M (2017) Water resources in arid and semi-arid regions: climate change scenarios for impact assessment and adaptation strategies. International Journal of Climatology
xviii
Conferences Declaration
The author participated in the following (local and international) conferences:
1. Ajman 4th International Environment Conference 2016
Mohammed R, Scholz M (2016) Impact of potential evapotranspiration methods at various altitudes on the reconnaissance drought index alpha form for arid and semi-arid regions
2. Shanghai 2016 International Conference on Water Resource and Environment (WRE2016)
Mohammed R, Scholz M (2016) The Reconnaissance Drought Index as a Climatic Index for the Detection of Climatic Variability for Various Geographical Areas
3. Salford Postgraduate Annual Research Conference (SPARC) 2016
Mohammed R, Scholz M, Yu Wang (2016) Assessment of the Potential Impact of Climate Variability Linked to Drought on the Temporal Hydrologic Alterations Shared River Basins. The University of Salford, Salford, Greater Manchester, United Kingdom, Salford Postgraduate Annual Research Conference (SPARC 2016) Book of Abstracts, 14‒15 June 2016, MediaCityUK, ISBN: 978-1-907842-85-6
4. Computing Science and Engineering-Postgraduate Symposium (CSE-PGSym16)
xix
Manchester, United Kingdom, Proceeding of CSE 2016 Annual PGR Symposium (CSE-PGSym16), 27th April 2016, ISBN:978-1-907842-83-2
5. The Ninth Manchester Metropolitan University Postgraduate Research Conference (9th MMU PGR)
Mohammed R, Scholz M (2016) Evaluation the climate change and streamflow alteration impacts on groundwater involvements to the base flow of the Lower Zab River. The Ninth Manchester Metropolitan University Postgraduate Research Conference (9th PGR), Manchester Metropolitan University, Greater Manchester,
United Kingdom, Wednesday, 22nd February 2017. 09:00 to 17:30 (GMT)
6. Computing Science and Engineering-Postgraduate Symposium 2017 (CSE-PGSym 17)
Mohammed R, Scholz M (2017) Evapotranspiration Techniques Impacts at Different Elevations on the Reconnaissance Drought Index. The University of Salford, Salford, Greater Manchester, United Kingdom, Proceeding of CSE 2017 Annual PGR Symposium (CSE-PGSym17) 17th March 2017, ISBN:978-1-1907842-94-8
7. Salford Postgraduate Annual Research Conference (SPARC) 2017
xx
Abbreviations
AET The long-term average annual actual evapotranspiration ai Meteorological station area
ANOVA One-way analysis of variance
BC Blaney-Criddle method
bcm Billion Cubic Meters
BF Baseflow
BFI Baseflow Index
BFImax Maximum baseflow index
C Coefficient of deep percolation Ca Reservoir active capacity
CD Coefficient of Dispersion
CFSR Climate Forecasting System Reanalysis CMI Crop Moisture Index
CN Continental
Cv Coefficient of variation
DF Direct runoff
dP Delta perturbations in precipitation
dPET Delta perturbations in potential evapotranspiration DF The Deviation Factor
DrinC Drought Indices Calculator
Dt The actual water yield over the period t
DP Delta Perturbation
EFC Environmental Flow Component ETo Reference evapotranspiration
FAO Food and Agricultural Organization of the United Nations
FDC Flow Duration Curve
G(x) Cumulative probability of gamma distribution GADM Global Administrative Areas Datasets
GCM General Circulation Models
xxi GIS Geographic Information System GLCF Global and Land Cover Facility
GR4J Ge´nie Rural a Daily 4 parameters model H(x) Cumulative probability
HadCM3 Hadley Centre Coupled Model, version 3
HBV Hydrologiska Byråns Vattenbalansavdelning (The Water Balance Department of the Hydrological Bureau)
HG Hargreaves method
HL Highland
IHA Indicators of Hydrologic alterations
IoA Index of Agreement
IPCC Intergovernmental Panel on Climate Change
LL Lowland
LARS-WG Long Ashton Research Station Weather Generator LZRB Lower Zab River Basin
mcm million cubic meters MAE Mean Absolute Error
MBE Mean Bias Error
MD Mediterranean
Medbasin-D Medbasin rainfall runoff Daily model Medbasin-M Medbasin rainfall runoff monthly model M–K Mann–Kendall analysis
NDVI Normalised Difference Vegetation Index NCEP National Centres for Environmental Prediction NOAA National Oceanic and Atmospheric Administration NSCE Nash–Sutcliffe Coefficient of Efficiency
OPOF Reservoir Operational Probability of Failure
P Precipitation
Pa Anthropogenic intervention period precipitation
Pav Basin average precipitation
Pb Observed precipitation of the baseline period
xxii PET Potential evapotranspiration
PETa Anthropogenic intervention period potential evapotranspiration
PETb Observed potential evapotranspiration of the baseline period
PHDI Palmer Hydrological Drought Index
Pi Average value of the station polygon precipitation
Pij Precipitation of the j-th month of the i-th water year
Pij Precipitation of the j-th month of the i-th water year
PM FAO Penman-Monteith methodology Pm Average value of the basin precipitation
Pr Probability that a particular flow will be equivalent to or greater than a
particular time ratio
PR-DCC Precipitation-Runoff Double Cumulative Curve r Coefficient of correlation
R Streamflow
R2 Coefficient of determination
Ra Observed streamflow subject to anthropogenic interventions period
RAI Rainfall Anomaly Index
Rar Rebuild runoff series for the anthropogenic interventions period
Rb Observed streamflow of the baseline period
RCM Regional Climate Models RCY Reservoir Capacity Yield RDI Reconnaissance Drought Index
RDIn Normalised Reconnaissance Drought Index
RDIst Standardised Reconnaissance Drought Index
RDIαk Initial Reconnaissance Drought Index
Re Reservoir Reliability
RMSE Root Mean Square Error
Rn Net radiation at the crop surface
Robs(i) Observed streamflow
RRV Reliability, resilience, vulnerability
RSAMt multi-model streamflow simulated by the simple average model (SAM) at
xxiii Rsim(i) Predicted streamflow at time step i
Rsimi,t Model streamflow simulation for i model and t time
RVA Range of Variability Approach SAI Standardised Anomaly Index
SAM Simple Average Method
SD Standard Deviation
SDI Streamflow Drought Index SDM Statistical Downscaling Models
Sik Aggregate streamflow storage for the i-th water year and the k-th reference
period
Smax Total capacity of the soil storage
SMDI Soil Moisture Drought Index SPI Standardised Precipitation Index SPSS Statistical Program for Social Sciences
St Reservoir storage volumes at the beginning of a time-period t
St+1 Reservoir storage volumes at the end of a time-period t
SWSI Surface Water Supply Index
t Time step
TF Total flow
TFPW Trend free pre-whitening
ThW Thornthwaite
Tm Mean air temperature
TR Tropical
u2 Wind speed at 2-m elevation
UNECE United Nations Economic Commission for Europe
UNESCO United Nations Educational, Scientific and Cultural Organization UN-ESCWA United Nations Economic and Social Commission for Western Asia Vij Streamflow storage time series of j-th month for a i-th water year
WG Weather Generator
WMO World Meteorological Organization
Y Yield
xxiv
α Filter parameter
αk Initial value of reconnaissance drought index (RDI) index
β Scale parameter
γ Psychrometric constant
Γ(γ) Gamma function
Δ Slope vapour pressure curve
φ Reservoir Resilience
υ Vulnerability
xxv
Abstract
1
Chapter 1:
INTRODUCTION
1.1
General Background
One of the most serious environmental issues facing the world today is climate change, it is widely accepted that global warming has the potential to affect many humans dramatically and adversely because of both natural and anthropogenic changes in temperature, precipitation, sea level, storms, air quality, and other climatic conditions (IPCC, 2014). The fifth assessment report of the intergovernmental panel on the climate change, IPCC, explained that the impacts of global warming on natural and human systems are observed on all continents and across the oceans (IPCC, 2014). Hydrological cycle alterations are considered to be one of the most climate change impacts, for example, floods, drought, and storms (IPCC, 2007; Suen, 2010; Ludwig et al., 2014; Doll and Zhang, 2010; Mittal et al., 2016). By the end of the 21st century, it is more likely that global mean air temperature will increase by 1.4 °C to nearly 5.8 °C (IPCC, 2001). However, the Middle East and North Africa (MENA) will likely encounter a decrease in rainfall and runoff between 10 and 25% and between 10 and 40%, respectively, and an increase in evaporation between 5 and 20% (Jagannathan et al., 2009).
2
The third report of the IPCC confirmed that there are critical limitations in existing adaptation options assessment and the current knowledge of adaptation and adaptive capacity to climate variability is inadequate. Developing storage reservoirs and irrigation schemes, inter-basin water transfers by networks of pipes and canals, and further development of groundwater resources are some of the traditional adaptation strategies for arid and semi-arid areas (Ragab and Prudhomme, 2002; Wan et al., 2015). A precise evaluation of the implications of a wide range of potential climate change scenarios is needed to effectively handle possible climate alterations (Stagl and Hattermann, 2016). Additionally, adaptation to such change in a shared river catchment is not limited to the nation and sub-nation-based capacities but should be treated as an on-going and long-term process to be incorporated in all levels of planning and operation or implementation (Gibson et al., 2005).
1.2
Problem Statement
Climate change impacts and uncertainties have become a major concern facing water resources managers and decision makers, in particular in arid and semi-arid areas in developing countries. Increased population growth and a growing demand for water have noticeably worsened the disproportional and intense competition among transboundary river basins. Literature has highlighted gaps in the knowledge and the urgent need to develop a set of methodologies and equations to help water resources managers and policy makers to make informed and robust decision in facing many uncertainties about the future, which can help them to cope with and mitigate the potential adverse effects of climate change on water resources availability. The impact of climate change associated with a spectrum of uncertainties has become a growing concern, which presses heavily on water resources managers and decision makers, on how to handle and mitigate the present and the anticipated adverse effects on water resources availability.
3
In addition, how well would the water resources managers’ decisions work across a spectrum of climate change uncertainty?
In order to study the problem and achieve the main research aim, the Lower Zab River Basin (LZRB) shared between Iraq and Iran has been selected as a case study. The magnitude of problems plaguing the LZRB has a great deal in common with other watersheds, such as Rhine, Volta, and Senegal, where the problems of shared water resources utilisation in a sustainable manner is expected to exacerbate under the collective impact of uncertainty surrounding climate change.
The drainage area of the LZRB occupies about 20,604.95 km2, of which 76% is located in Iraq and 24% in Iran. In the latter region, substantial water withdrawal is currently taking place. There has been a noticeable growth in water storage facilities, and plans for additional control arrangements upstream. The basin covers a range of relatively large watershed and a wide range of climatic and hydrologic conditions. The upstream and downstream developments vary widely. This suggests a wide range of uncertainties in climate change impacts on water resources availability, which can be assessed. The proposed study aims at developing a set of practical methodologies and equations for integrated water management in river basin under future climate change storylines.
Findings are expected to significantly contribute to the knowledge of integrated water resources management in developing countries, in particular, arid and semi-arid areas under climate change uncertainties.
1.3
Aim and Objectives
4
1. To evaluate the sensitivity of the reconnaissance drought index to the potential evapotranspiration formulations at various elevations and climatic conditions and highlight the use of the reconnaissance drought index as an aridity and climatic index.
2. To assess the link between a flow duration curve and an Eckhardt (2005) digital filtering algorithm to overcome the limitations of the traditional approaches of baseflow separation. 3. To evaluate the spatiotemporal hydrologic alterations coupled with climate variability and drought events in a river basin.
4. To evaluate and compare the results of the general circulation models and the delta perturbation scenarios, to investigate how these scenarios differ from each other in terms of their ability to simulate streamflow and reservoir performance.
5
6
7
1.4
Thesis Outline
This thesis has been organised into five Chapters as listed in the following:
Chapter 1: INTRODUCTION
The introduction represents the basis of the thesis as it presents the focus points of the research. The chapter involves the following sections: General Background, Problem Statement, Aim and Objectives, and Thesis Outline.
Chapter 2: CRITICAL LITERATURE REVIEW
Chapter two presents the research literature survey that has been critically reviewed. The chapter covers Overview, Hydro-Climatic Data Trend Analysis, Drought Analysis, Hydrograph Analysis, Hydrologic Alteration , Anthropogenic Interventions Evaluation, Climate Change Scenarios, Climate Change , Climate Forecasting System Reanalysis Data.
Chapter 3: METHODS, MODELS,AND APPLICATIONS
This chapter explores the details of the materials and the methodology. This chapter encompasses the following sections and sub-sections: Overview, Representative Case Study, Data Availability and Collection, Tools Implemented, Methodology (Hydro-Climatic Data Trend Analysis, Potential Evapotranspiration Estimation, Basin Average Precipitation Computation, Drought and Aridity Identification, Hydrograph Analysis, Hydrologic Alteration, Normal Years Identification, Rainfall-Runoff Simulation, Hydrologic Sensitivity Analysis Method, Multi-Regression Method, Separation Effect Framework, Climate Change Impact, Model Performance Criteria, Climate Change Scenarios, Reservoir Capacity-Yield-Reliability, and Long Ashton Research Station Weather Generator Model.
Chapter 4: RESULTSANDDISCUSSION
8
Evapotranspiration Methods, Reconnaissance Drought Index as a Climatic Index, Drought and Aridity Trends, and Future Scenarios, Relationships between Meteorological and Hydrological Drought), Hydrograph Analysis (Flow Duration Curve Linked to Digital Filtering Algorithms (Upstream Sub-Basin and Downstream Sub-Basin), Impact, Climate Change and Drought Episode Impact on the Hydrograph, Seasonal Variations of the Baseflow Index), Hydrologic Alteration (Overview and Anthropogenic Intervention Impact of on the Streamflow), Anthropogenic Interventions Evaluation (General , Rainfall-Runoff Models Calibration and Validation, Multi-Regression Equation, Methods of Hydrologic Sensitivity Analysis, Methods of Hydrological Simulation, Simple Average Method and Single Model Predictions ), Climate Change (Rainfall-Runoff Simulation, LARS-WG5.5 Calibration and Validation, Meteorological Variables, Drought Identification and Hydrologic Alteration (Delta Perturbation Scenario andGeneral Circulation Model Scenario), Reservoir Inflow, and Reservoir Capacity-Yield-Reliability Relationships.
Chapter 5: CONCLUSIONS AND RECOMMENDATIONS
9
Chapter 2:
CRITICAL
LITERATURE REVIEW
2.1
Overview
Climate change affects the function and operation of existing water infrastructure as well as water management practices. Current water management practices are likely to be unable to reduce the negative impacts of climate change on water supply reliability, flood risk, health, energy, and aquatic ecosystems (Park and Kim, 2014). Considering the importance of basin storage reliability and its potential sensitivity to climate change, many studies have addressed these issues (Fowler et al., 2003; Li et al., 2010; Raje and Mujumdar, 2010; Watts et al., 2011; Bardsley et al., 2013; Chatterjee et al., 2014; Kiparsky et al., 2014; Park and Kim, 2014). They have investigated the hydrological regime alterations due to climate change impacts on water supply reliability. However, the majority of studies have only analysed the direct effect of such change on the hydrologic cycle, rather than assessing the impacts in terms of water resources management or developing methodology(s) and/or equation(s) that can help water resources policy makers in making an effective and robust decision in facing many uncertainties about the future.
10
investigated how well would the water resources managers’ decisions work across a spectrum of climate change uncertainty.
Therefore, the current research aims to bridge the gap in decision makers’ understanding of climate change on surface water systems in arid climate zones by developing a set of methodologies and equations, considering the uncertainties involved in climate change projections. In order to study the problem and achieve the main research aim, the Lower Zab River Basin (LZRB) has been selected as a representative case study; this is located in the north of Iraq. The basin covers a relatively wide range of climatic and hydrological conditions. This suggests a wide range of uncertainties in climate change impacts on water resources availability.
Findings are expected to significantly contribute to knowledge in the field of water resources, by incorporating adaptation measures into a water resource model (supply and/or demand-side), in arid climate zones. Based on the research results, an adaptable operational approach can be implemented, where the decision makers adjust the operational rules on the basis of inflow prediction and the existing state of reservoir storage at each given time step, leading to more efficient and sustainable management of the basin storage system.
2.2
Hydro-Climatic Data Trend Analysis
Based on the non-normal distribution attributes of datasets, which is common in hydro-climatic datasets, two widespread distribution-free or non-parametric techniques (Mann– Kendall analysis – M-K – and the Pettitt test) are normally applied to identify the variations in hydro-climatic time series. The former is utilised for identifying monotonic trends or slow trends, whereas the latter is applied to identify sudden changes in the average level. A brief description of these two tests can be found below.
11
applied instead of a parametric linear regression test, which can be used to analyse if the slope of the computed linear regression line is different from zero. The regression test requires that the residuals from the fitted regression line are normally distributed. Such an assumption is not required by the M-K test. Previous studies (Gedikli et al., 2008; Gedikli et al., 2010; Robaa and Al-Barazanji, 2013; Seibert and Vis, 2012) have detailed the M-K method and were referred to in the development of this thesis. The M–K test requires time series to be free of autocorrelation/serial correlation. The existence of serial correlation in the datasets will increase the possibility that the M-K analysis identifies a significant trend (Shadmani et al., 2012). This caused a disproportionate rejection of the null hypothesis of no trend, while the null hypothesis is true. Therefore, pre-whitening of the original dataset before applying the M–K test is recommended (Oguntunde et al., 2011; Shadmani et al., 2012).
Secondly, the Pettitt test is applied for change point identification. Change point identifications are considered as important in the analysis of runoff datasets for studying the impacts of anthropogenic interventions and climate change. The Pettitt test is also a distribution-free method to calculate the existence change point(s) for the average of a time series if the specific change time is unidentified. This analysis is commonly applied to assess alterations in hydro-climatic data (Velázquez et al., 2011; Zhang et al., 2001).
Furthermore, the precipitation-runoff double cumulative curve (PR-DCC) can illustrate the consistency of runoff and precipitation data ( Jiang et al., 2011). I n general, the curve is a straight line. A variation in the trend of the curve could deduce that the properties of streamflow or precipitation have altered. The PR-DCC technique can be applied to test the homogeneity of hydrological data and is often seen as an efficient tool for the detection of the hydrological system variations due to anthropogenic interventions (Huo et al., 2008; Velázquez et al., 2011; Zhang at al., 2001). As an auxiliary method for the change point detection in the precipitation and runoff series, the P R - DCC method can be used.
12
on the separated periods, the impacts of anthropogenic intervention and climate change on streamflow can be divided by using streamflow simulation.
2.3
Drought Analysis
One of the main water-related hazards is drought (Giannikopoulou et al., 2014), which should be considered as a three-dimensional event characterised by its severity, duration, and affected area (Tsakiris and Vangelis, 2005; Vangelis et al., 2013; Zarch et al., 2015). Despite the fact that there is no commonly agreed definition of the term drought, a universally acceptable one describes the event as a considerable decline in the water availability during a lengthy time-period and over a spacious region (Tigkas, 2008).
For identifying, quantifying, and monitoring drought, there are different suggested methodologies. One of the most popular methods, which are distinctive collections of indicators involving meteorological, hydrological and other data, is the estimation of drought indices (Tsakiris and Vangelis, 2005; Tigkas, 2008; Vangelis et al., 2013; Giannikopoulou et al., 2014). Drought indices are categorised into two main groups: common indices and ones that are more detailed. The former gives an outline of the drought event and its strength, while the latter is generally beneficial for related drought occurrences to the prospective destruction from drought in different areas of the environment, society, and overall economy (Tigkas, 2008; Tigkas et al., 2012). The indices are vital and practical elements for characterising drought and supporting policy makers for moderating its impact on various water consumption sections since they facilitate intricate interrelationships between several climatic variables. Noticeably, indices make it easier to transfer climate anomaly information to a wide range of audiences and assisting scientists in quantitative weather abnormality evaluations, in terms of their intensity, frequency, areal extent, and duration (Vangelis et al., 2013; Giannikopoulou et al., 2014). Moreover, when drought indices are utilised, the time steps are adapted and the thresholds of each index selected are considered for representing the levels of drought severity.
13
(CMI), deciles, palmer drought severity index (PDSI), palmer hydrological drought index (PHDI), percent of normal, standardised anomaly index (SAI), rainfall anomaly index (RAI), standardised precipitation index (SPI), soil moisture drought index (SMDI), and surface water supply index (SWSI), as well as indices linked to the normalised difference vegetation index (NDVI). Several authors have reviewed the current and potential operational uses of remote sensing to aid decisions on drought assessment over the last few decades, for example, Heim (2002), McVicar and Jupp (1998), and AghaKouchak et al. (2015).
The World Meteorological Organization (WMO) has put forward SPI as a universal drought index because of its capacity to estimate for various reference periods, adapting to the different response times of typical hydrological parameters to precipitation shortages (Vicente-Serrano et al., 2015). The index allows detection of different drought categories affecting different systems and areas. However, there are deficiencies associated with its failure to identify drought conditions determined not by a shortage of precipitation, but by a higher than normal atmospheric evaporative demand. The failure of SPI to capture a raised evaporative demand associated with climate change is challenging (Tsakiris and Vangelis, 2005; Cook et al., 2014). Therefore, recent drought trend studies (Sheffield et al., 2012; Vicente-Serrano et al., 2014) and drought scenarios under potential climate change projections (e.g., Hoerling et al., 2012; Cook et al., 2014) depend on drought indices that take into account precipitation and the atmospheric evaporative demand. Applying such indices, Cook et al. (2014) showed that increased potential evapotranspiration not only intensifies dry weather in areas where precipitation is already decreased, it also drives regions into a drought that would otherwise not have been.
14
When discussing drought, it is important to have an understanding of aridity and the difference between the two events. In terms of meteor-climatology, aridity is defined as the degree to which weather lacks effective moisture. Whereas, drought is defined as the period of abnormally dry climate, adequately extensive enough to cause a serious hydrological imbalance. Generally, aridity is measured by comparing long-term average precipitation to long-term average evapotranspiration. On average, the climate is considered arid if demand is greater than supply. Drought denotes the moisture equilibrium that occurs on a monthly basis. Drought is a temporary phenomenon, whereas aridity is a permanent phenomenon. Drought severity and aridity evaluation are impacted by many factors, such as the potential impact of potential evapotranspiration methods, meteorological station elevation variations, and climate conditions. A growing number of researchers in the field of water resources have recently used RDI as a drought evaluation index (e.g., Tigkas et al., 2012; Vanglis et al., 2013; Giannikopoulou et al., 2014; Cai et al., 2015; Zarch et al., 2015). However, they only used the standardised form without taking into consideration the other forms of the index. In addition, the studies did not consider changes in the drought severity evaluation, which would occur if there are changes in the potential evapotranspiration methods, the different elevations of the weather stations within the same basin, or the impact of the regional climate conditions. For example, although Vangelis et al. (2013) assessed the impact of different potential evapotranspiration methods on the drought severity computed by RDI, they only used data from semi-arid climates of the Mediterranean region and only for two meteorological stations, without taking into consideration other semi-arid climatic conditions, such as tropical and continental, dry climates, such as the Sahara, and humid conditions. Furthermore, Vangelis et al. (2013) only focused on the standardised form of the index (RDIst) without giving any attention to the other forms, such as the initial (alpha) form
(RDIα12). Therefore, to fill the knowledge gap, this study has focused, as one of its objectives
15
Defining the climate of a region is normally based on the long-term pattern of variations in meteorological variables, such as mean air temperature, precipitation, humidity, and wind. The long-term impacts of climate change are expected to affect land use, agriculture, water resources, society, and environmental sustainability. Accordingly, such changes can strengthen present pressure and extreme events, thus increasing water resources system hazards and overall uncertainty (Loukas et al., 2008; Logan et al., 2010).
The fifth assessment report of the Intergovernmental Panel on Climate Change (IPCC) explained that the impacts of global warming on natural and human systems are observed on all continents and oceans (IPCC, 2014). Hydrological cycle alterations are considered one of the greatest climate change impacts, such as floods, drought, and storms (IPCC, 2007; Michel and Pandya, 2009). By the end of the 21st century, it is more likely that the global mean air temperature will increase by 1.4 °C to nearly 5.8 °C (IPCC, 2001). However, the Middle East and North Africa will likely encounter a decrease in rainfall and runoff between 10 and 25%, and between 10 and 40%, respectively, and an increase in evaporation between 5 and 20% (Jagannathan et al., 2009).
16
geographical regions, and it is gaining ground as a result of its high sensitivity and resilience, as well as its low data requirements (Tigkas et al., 2012; Asadi and Vahdat, 2013; Rossi and Cancelliere, 2013; Asadi Zarch et al., 2015; Vicente-Serrano et al., 2015). Tigkas et al. (2012, 2015) published brief explanations of the hypothetical basis for RDI and many other drought-related indices together with some practical applications with a specialised software package named Drought Indices Calculator (DrinC), which was established to provide a simple interface for the drought indices estimations.
Recently, many researchers have discussed and utilised RDI as a drought severity index. In order to detect the probable climatic change, Tigkas et al. (2012) suggested a single index: Alpha and normalised expressions of RDI. Additionally, Vangelis et al. (2013) assessed the potential evapotranspiration estimation methods effect on the characterisation of drought severity resulting from RDI. They compared the RDI outcomes for different reference periods using some widespread empirical PET approaches with low data needs. Based on their research analysis, they argued that no substantial impact on RDI was identified by applying the chosen potential evapotranspiration estimation approaches. Then, Shamsnia (2014) computed the indices of SPI and RDI applying twenty-nine points of weather data from the hydrological year 1981/1982 to 2009/2010 for five geographical regions. They concluded that wet and dry seasons on short time scales depend on precipitation and potential evapotranspiration, in addition to other meteorological variables, and suggested (for drought assessments) utilising the RDI index to select short reference periods, such as 1, 3, and 6 months. Cai et al. (2015) assessed the spatial and temporal drought characteristics based on monthly precipitation data from thirty-three meteorological stations over the time-period from 1960 to 2010. They applied the amended RDI to capture the patterns of drought and to estimate the drought severity for all studied locations.
A growing number of studies in the water resources field have discussed, applied, and explained the theoretical background of the RDI index for drought severity assessment. However, they particularly focused on the RDIst form of the index, but they did not discuss