International Journal of Emerging Technology and Advanced Engineering
Website: www.ijetae.com (ISSN 2250-2459,ISO 9001:2008 Certified Journal, Volume 4, Issue 5, May 2014)
152
Analysis of Key Factors Affecting the Variation of Labour
Productivity in Construction Projects
Shashank K
1, Dr. Sutapa Hazra
2, Kabindra Nath Pal
31
Student MTECH (CEM), 2Associate Professor, Department of civil Engineering, MIT (Manipal), Karnataka, India
3General Manager (Technical), Gopalan Enterprises, Bangalore, Karnataka, India
Abstract— Productivity plays an important role in the construction industry. It helps construction industries to be competitive, to achieve goals and to meet the stakeholder and value propositions. The objectives of this research are; one, identifying the key factors affecting the variation of labour productivity in the construction projects in Bangalore, India, second, assessing the impact of the influenced factors on the variation of labour productivity and lastly, providing recommendations to reduce the variation of labour productivity.
The above objectives have been achieved through the analysis of 53 questionnaires and the result of this analysis shows that, there are six main groups which have significant impact on the labour productivity variation in the construction projects. They are Manpower group, Managerial group, Motivation group, Material/Equipment group, Safety group and Quality group.
Keywords — Construction, Labour Productivity, Labour
Productivity Variation, Multiple Linear Regression,
Influenced factors.
I. INTRODUCTION
Productivity has been generally defined as the ratio of outputs to inputs. Construction projects are mostly labour based with basic hand tools and equipment, as labour costs comprise 30 % to 50 % of overall project cost. Productivity in economics refers to measures of output from production processes, per unit of input. Productivity may be conceived of as a measure of the technical or engineering efficiency of production.
There are many factors that influence the productivity in construction industry. Labour productivity is one of the most important factors that affect the physical progress of any construction project. Construction labourers are responsible to operate a variety of equipment. To perform their jobs effectively, construction labourers must be familiar with the duties of other craft workers and with the materials, tools, and machinery they use.
Construction labour productivity is influenced by various factors whose impact can be quantified in productivity models. These models play an important role in estimating cost, in scheduling, and in planning.
A number of models have been developed using regression analysis to provide a qualitative evaluation of the impact of different factors on construction labour productivity. The present study intends to quantify these factors and to provide a model for predicting labour productivity.
II. OBJECTIVES OF THE STUDY
This study is conducted to achieve the following objectives.
To identify the factors affecting the variation of labour productivity in the construction projects.
To assess the impact of influenced factors on the variation of labour productivity.
To suggest recommendations in order to reduce variation of labour productivity in the construction projects.
III. LITERATURE REVIEW
Productivity in construction is often broadly defined as output per labour hour. Since labour constitutes a large part of the construction cost and the quantity of labour hours in performing a task in construction is more susceptible to the influence of management than are materials or capital, this productivity measure is often referred to as labour productivity. However, it is important to note that labour productivity is a measure of the overall effectiveness of an operating system in utilizing labour, equipment and capital to convert labor efforts into useful output, and is not a measure of the capabilities of labour alone.
Homyun Jang et al (2009) identified 25 critical variables and were grouped into 4 groups, namely work management, work technique, work characteristic and worker component.
International Journal of Emerging Technology and Advanced Engineering
Website: www.ijetae.com (ISSN 2250-2459,ISO 9001:2008 Certified Journal, Volume 4, Issue 5, May 2014)
153
Enshassi (2007) classifies factors affecting productivity in the construction projects into 10 groups, namely: factors associated with the internal workforce, factors associated with leadership, factors associated with work motivation factor associated with time, factors associated with materials and equipment, factors related to supervision, factors related to project characteristic, factors related to security, factors related to quality and external factors.
Soekiman et al (2011) identified 113 variables affecting construction labour productivity and these variables were grouped into 15 groups of factors according to their characteristics, namely: Design, execution plan, material, equipment, labor, health and safety, supervision, working time, project factor, quality, financial, leadership and co-ordination, organization, owner/consultant and external factor.
Nabil Ailabouni et al (2007) identified 32 significant variables affecting the productivity in the construction industry and these were grouped into 4 groups based on their characteristic, namely: environment factors, organizational factors, group dynamics and personal factors.
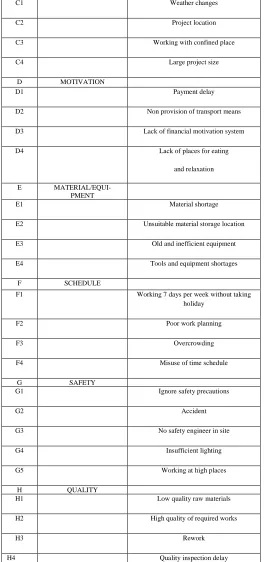
[image:2.612.309.573.137.699.2]In summary, based on the previous research, 34 factors are selected and grouped into 8 groups according to their characteristics, namely: Manpower, Managerial, Environmental, safety, Material/Equipment, Schedule, Motivation, and Quality as shown in the TABLE I.
Table I
Factors Affecting Labour Productivity
SL NO GROUP FACTORS
A MANPOWER
A1 Lack of labour skills
A2 Increase of labourer age
A3 Labour absenteeism
A4 Lack of training
A5 Labour personal problem
B MANAGERIAL
B1 Poor site management
B2 Poor communication
B3 Misunderstanding between labour and supervisor
B4 Lack of periodic meeting with labours
C ENVIRONMENTAL
C1 Weather changes
C2 Project location
C3 Working with confined place
C4 Large project size
D MOTIVATION
D1 Payment delay
D2 Non provision of transport means
D3 Lack of financial motivation system
D4 Lack of places for eating
and relaxation
E MATERIAL/EQUI-PMENT
E1 Material shortage
E2 Unsuitable material storage location
E3 Old and inefficient equipment
E4 Tools and equipment shortages
F SCHEDULE
F1 Working 7 days per week without taking holiday
F2 Poor work planning
F3 Overcrowding
F4 Misuse of time schedule
G SAFETY
G1 Ignore safety precautions
G2 Accident
G3 No safety engineer in site
G4 Insufficient lighting
G5 Working at high places
H QUALITY
H1 Low quality raw materials
H2 High quality of required works
H3 Rework
International Journal of Emerging Technology and Advanced Engineering
Website: www.ijetae.com (ISSN 2250-2459,ISO 9001:2008 Certified Journal, Volume 4, Issue 5, May 2014)
154
Theoretical modelAs shown in Figure 1, theoretical model consisting of 8 hypotheses from H1 to H8, in there, the group factors are independent and quantitative variables, they affect directly on labour productivity variation, a dependent variable.
Manpower group H1+
Managerial group H2+
Environmental group H3+
Motivation group H4+
Material/Equipment group H5+
Schedule group H6+
Safety group H7+
[image:3.612.47.270.198.393.2]Quality group H8+
Figure 1: Theoretical model
Based on the past studies and theoretical concepts. The theoretical model was constructed with eight independent groups including manpower, managerial, environmental, motivation, schedule, material/equipment, safety and quality which have positive impact on the dependent factor of labour productivity variation.
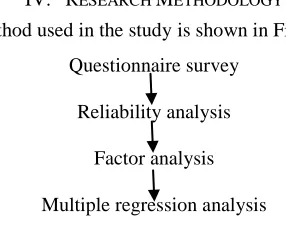
IV. RESEARCH METHODOLOGY
The method used in the study is shown in Figure 2.
Questionnaire survey
Reliability analysis
Factor analysis
Multiple regression analysis
Figure 2: Research method
Questionnaire survey: Data on factors that influences labour productivity in construction projects.
Reliability analysis: This was conducted for each group in order to assess the reliability of the questionnaire. Unreliable factors were discarded.
Factor analysis: Factors were classified into components. At this stage, components classified on the basis of the relevant literature review (manpower, managerial, environmental, motivation, material/equipment, schedule, safety and quality). The components that were properly classified were examined, and those that were not classified were reclassified so that the components could properly represent the factors. Then, a reliability analysis was conducted on the factors in each classified component to verify the reliability of the component.
Regression analysis: This was the last stage of the statistical analysis in which the factors that significantly influenced labour productivity variation in construction were identified. The significance of the components was analyzed and insignificant components were discarded at this stage. In addition, the regression model was evaluated, and the impact of each component was analyzed.
V. RESULTS OF DATA ANALYSIS AND DISCUSSION
A total of 60 questionnaires were distributed to the construction firms in the population. Of these, 53 questionnaires were successfully filled. The response rate was therefore 88.33%.
Once the data was collected the analysis was done as per questionnaires that were used to collect the data.
A. Reliability Analysis
Cronbach‘s alpha method was used for reliability analysis. This method assesses basic consistency on the basis of the average correlation between the data that were measured in an identical manner. This method combines the split-half method and item-total correlation, and calculates the mean value of the reliability, obtained by the split-half method for all the data of the concept. Using this method, the reliability of group level and individual level can be evaluated.
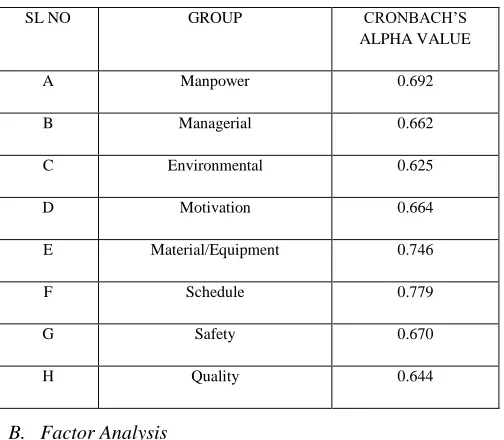
The value of cronbach‘s alpha and item-total correlation must be more than 0.6 and 0.3 respectively. After considering the result of the first reliability analysis, three factors were deleted due to low Item-total correlation. As shown in Table II the final reliability analysis were conducted after deleting 3 factors.
[image:3.612.91.234.490.603.2]International Journal of Emerging Technology and Advanced Engineering
Website: www.ijetae.com (ISSN 2250-2459,ISO 9001:2008 Certified Journal, Volume 4, Issue 5, May 2014)
[image:4.612.42.297.155.375.2]155
Table II
Reliability Analysis Results
SL NO GROUP CRONBACH‘S
ALPHA VALUE
A Manpower 0.692
B Managerial 0.662
C Environmental 0.625
D Motivation 0.664
E Material/Equipment 0.746
F Schedule 0.779
G Safety 0.670
H Quality 0.644
B. Factor Analysis
The main aim of factor analysis is to describe the larger number of variables by the smaller set of composite variables. Factor analysis is a statistical technique that explains the common underlying dimensions that compose variables (which are called ―components‖ in this study) by analyzing the correlation between the variables.
The theoretical model of this study identified 34 independent variables affecting the variation of labour productivity in the construction project. After conducting reliability analysis, three factors were deleted due to low Item-total correlation.
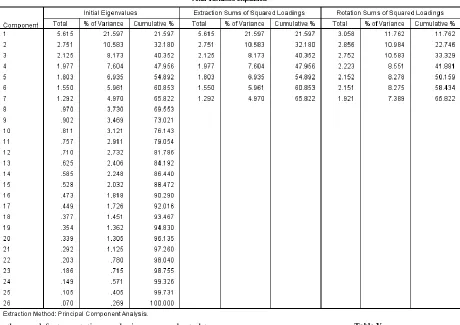
The result of the first factor analysis using rotated component matrix shows that the factors C1, C2, G1 got a blank space because of loading score less than 0.5 and factors A1, F1 did not cluster with any factors. Hence, these variables were deleted.
[image:4.612.44.296.156.376.2] [image:4.612.316.571.277.387.2]As shown in Table III, the KMO value (0.59) is greater than 0.5, which means the data is likely to factor well and in Bartlett‘s test the significant value is lower than 0.05, which indicates that the correlation matrix is different from an identity matrix
Table III KMO And Bartlett’s Test
KMO measure of sampling adequacy 0.590
Bartlett‘s test of sphericity
Approx chi-square 557.5594
Df 325
Sig .000
International Journal of Emerging Technology and Advanced Engineering
Website: www.ijetae.com (ISSN 2250-2459,ISO 9001:2008 Certified Journal, Volume 4, Issue 5, May 2014)
156
Table IV KMO And Bartlett’s Test
An orthogonal factor rotation analysis was conducted to clearly classify the components, and the rotated component matrix was analyzed, as shown in Table V.
The results of reliability analysis and factor analysis showed that three independent factors and one independent group were rejected due to low corrected item- total coefficient and loading score.
[image:5.612.76.536.168.493.2]For the reason above, the theoretical model has been revised and the Hypothesis from H1, H2, H4, H5, H6, H7, and H8 has the same statement that is: There is a positive impact of the influenced factors on the variation of labour productivity. The hypothesis H3 is deleted.
International Journal of Emerging Technology and Advanced Engineering
Website: www.ijetae.com (ISSN 2250-2459,ISO 9001:2008 Certified Journal, Volume 4, Issue 5, May 2014)
157
C. Multiple Regression AnalysisThe coefficient of determination (R2) is equal to 0.822. This shows that manpower group, managerial group, material/equipment group, schedule group, safety group, and quality group can explain 82.2 percent of the variations in labour productivity and 17.8 percent cannot be explained. The P value of 0.000 implies that labour productivity is significant at the 5 percent significance level.
Result in table VI, indicate that about 82.2% of the variation in labour productivity can be explained by the seven independent variables. This indicates that the model is adequate in the prediction of the response of the dependent variable.
As shown in Table VII, F value of 35.380 indicates that the overall regression model is significant and has some explanatory value (P- value p=0.00<0.05). This also indicates that there is a significant relationship between the predictor variables (manpower, managerial, motivation, material/equipment, schedule, safety and quality) and response variable (labour productivity variation).
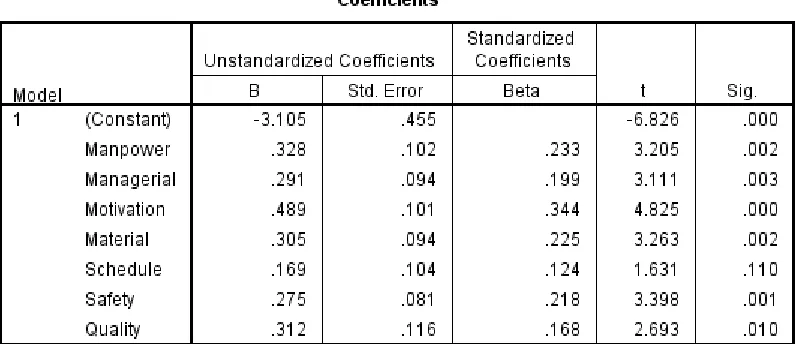
From Table VIII, the following regression model was fitted.
LPF = -3.105 + 0.233F1 + 0.199F2 + 0.344F4 + 0.225F5 + 0.124F6 + 0.218F7+0.168F8
(F1: manpower group, F2: managerial group, F4: motivation group, F5: material/equipment group, F6: schedule group, F7: safety group, F8: quality group)
D. Hypothesis Testing
Hypothesis H1:
Null hypothesis (H0): The manpower group has no impact on Labour Productivity Variation (LPV).
Research hypothesis (H1): The manpower group has significant impact on Labour Productivity Variation (LPV).
Based on the value of Beta and Sig in Table VIII, the testing for Hypothesis was conducted. The Standardized Regression coefficient (beta) of Manpower group on LPV is 0.233 and value of t is 3.205 (>2) and p = 0.002(<0.05).
[image:6.612.72.539.462.514.2]This means at 95 % confident level, there is a statistic evidence to conclude that there is a positive impact of Manpower group on the variation of labour productivity. Therefore, Hypothesis H1 is accepted. Furthermore, the results of other hypotheses tests of research are presented in Table IX.
Table VI
Model Summary For Multiple Linear Regression Analysis
Table VII
[image:6.612.145.465.546.651.2]International Journal of Emerging Technology and Advanced Engineering
Website: www.ijetae.com (ISSN 2250-2459,ISO 9001:2008 Certified Journal, Volume 4, Issue 5, May 2014)
158
Table VIII
[image:7.612.107.505.170.342.2]Coefficient Of Multiple Linear Regression Analysis
Table IX Hypothesis Summary
HYPOTH ESIS
GROUP T Sig Decision
H1 Manpower 3.205 .002 Reject H0
H2 Managerial 3.111 .003 Reject H0
H4 Motivation 4.825 .000 Reject H0
H5 Material/Equipment 3.263 .002 Reject H0
H6 Schedule 1.631 .110 Accept H0
H7 Safety 3.398 .001 Reject H0
H8 Quality 2.693 .010 Reject H0
E. Final research model
Manpower group H1+
Managerial group H2+
Motivation group H4+
Material/Equipment group H5+
Safety group H7+
Quality group H8+
VI. CONCLUSION
The theoretical model of this study proposed eight independent groups affecting the variation of Labour Productivity in the construction projects namely Manpower group, Managerial group, Environmental group, Motivation group, Material/Equipment, Schedule group, Safety group and quality group.
International Journal of Emerging Technology and Advanced Engineering
Website: www.ijetae.com (ISSN 2250-2459,ISO 9001:2008 Certified Journal, Volume 4, Issue 5, May 2014)
159
The results of reliability analysis and factor analysis showed that three independent factors and one independent group were rejected due to low corrected item- total coefficient and loading score.
The results of multiple regression analysis showed that, six independent groups, which have a positive impact on labour productivity variation, and one group, which has no impact on labour productivity variation.
Multiple linear regression analysis indicates that the model can explain 82.2% of the variance in labour productivity.
Among six independent groups, motivation group has the highest impact on labour productivity variation.
The six independent groups were ranked based on the impact strength on labour productivity variation.
1) Motivation group
2) Manpower group
3) Material/Equipment group
4) Safety group 5) Managerial group
6) Quality group
VII. RECOMMENDATION
Firstly, the Motivation factor has the highest impact on Labour Productivity variation with the highest standardized beta of 0.344. The low labour satisfaction could have negative impact on labour productivity. So, the construction company should increase labour satisfaction by paying a reasonable salary, developing financial reward or recognition program and improving the living condition on site.
Secondly, manpower group plays an important role during the process of project. Bad workforce is a major problem and affects the time to accomplish the project task. The project manager of construction companies should increase their leadership skill and the labour skill in the project by appropriate training program. It is also necessary to improve labour commitment and the relationship among workers by increasing labour benefit and team building program.
Lastly, to ease the variation of labour productivity, the construction companies should improve supervision by implementing periodic meeting and ensure supervisors were correctly selected. The designing team should also be quite experienced to avoid revised drawings.
Material delay and material arrangement, tool and equipment management should be improved by adopting proper material management system. The planning software should be used in the project to have a proper planning of the work to reduce the frequency of working overtime.
REFERENCES
[1] AbouRizk, S., Knowles, P. and Hermann, U. (2001), ―Estimating labor production rates for industrial construction activities‖, Journal of Construction Engineering and Management, Vol. 127 No. 6, pp. 502-11.
[2] Allmon, E., Haas, C.T., Borcherding, J.D., Allmon, E. and Goodrum, P.M. (2000), ―US construction labor productivity trends, 1970-1998‖, Journal of Construction Engineering and Management, Vol. 126 No. 2, pp. 97-104.
[3] Bernstein, H.M. (2003), ―Measuring productivity: an industry challenge‖, Civil Engineering, Vol. 73 No. 12, pp. 46-53.
[4] Building Futures Council (2006), Measuring Productivity and Evaluating Innovation in theUS Construction Industry, BFC, Alexandria, VA.
[5] Dai, J., Goodrum, P.M. and Maloney, W.F. (2009), ―Construction craft workers‘ perceptions of the factors affecting their productivity‖, Journal of Construction Engineering and Management, Vol. 135 No. 3, pp. 217-26.
[6] Dissanayake, M., Fayek, R.A., Russell, A.D. and Pedrycz, W. (2005), ―A hybrid neural network for predicting construction labour productivity‖, Proceeding of ASCE International Conference on Computing in Civil Engineering, 12-15 July, Cancun, Mexico. [7] Durdyev, S., & Mbachu, J. (2011). On-site Labour Productivity of
New Zealand Construction Industry: Key Constraints and Improvement Measures. Australasian Journal of Construction Economic and Building, 1(3), 18-33.
[8] Enshassi, A., Mohamed, A., Mustafa, Z. A., & Mayer, P. E. (2007). Factors affecting labour productivity in building project in the Gaza strip. Journal of Civil Engineering and Management, 8(4), 245-254. [9] Henry, M. J., Jackson, A. M., Bengt, H. (2007). Factors affecting the
productivity of building craftmen – studies of Uganda. Journal of Civil Engineering and Management, 8(3), 169-176.
[10] Homyun Jang, Kyonghoom Kim, Juhyung Kim, and Jaejun Kim. (2011). Labour productivity model for reinforced concrete construction projects. Construction Innovationm Process, Management, 11(1), 92-113.
[11] Soekiman, A., Pribadi, A. S., Soemardi, B. W., & Wirahaddikusumah, R. D. (2011). Fatcors relating to labor productivity affecting the project schedule performance in indonesia. Procedia Engineering, 14(10), 865-873.
[12] Smith, S.D. (1999), ―Earthmoving productivity estimation using linear regression techniques‖, Journal of Construction Engineering and Management, Vol. 125 No. 3, pp. 133-41.
[13] Alvani, M., Ahmadi, P., 2001, ‗Designing a model for human resources productivity by using management productivity approach‘, Journal Research Scientific, vol. 5, pp. 19-27.
International Journal of Emerging Technology and Advanced Engineering
Website: www.ijetae.com (ISSN 2250-2459,ISO 9001:2008 Certified Journal, Volume 4, Issue 5, May 2014)
160
[15] Attar, A.A, Gupta, A.k, Desai, D.B, ‗A Study of Various Factors Affecting Labour Productivity and Methods to Improve It‘, Journal of Mechanical and Civil Engineering, 11-14.
[16] Jimoh, I.A, ‗Effects of delay factors on labour productivity on nigerian construction sites‘, Interdisciplinary Journal of contemporary research in business, vol 5, no 4.
[17] Ibrahim Mahamid, September 2013 ‗Principal Factors Impacting Labor Productivity of Public Construction Projects in Palestine: Contractors‘ Perspective‘, International Journal of Architecture, Engineering and Construction, Vol 2, No 3, 194-202.
[18] Mistry Soham, Bhatt Rajiv. April 2013, ‗Critical Factors Affecting Labour Productivity in Construction Projects Case Study Of South Gujarat Region Of India‘, International Journal of Engineering and Advanced Technology, vol.2, no. 4.
[19] Schneider, Scott P, 2007, Economics of Health and Safety in Construction. Laborers' Health and Safety Fund of North America. [20] Schwartzkopf, William, 1995, Calculating Lost Labor Productivity
in Construction Claims. 2nd ed. Aspen.
[21] Abdulaziz M. Jarkas,ph.D., P.Eng.1; And Camille G. Bitar, P.Eng, 2012, ‗Factors Affecting Construction Labor Productivity In Kuwait‘, Journal Of Construction Engineering And Management .ASC.
[22] Wen Yi, Albert P.C. Chan, 2013, ‗Critical Review Of Labor Productivity Research In Construction‘, Journal Of Management In Engineering.
[23] Abdul Kadir, M. R., Lee, w. P., Jaafar, M. S., Sapuan, S. M., and Ali, A. A. (2005). ―Factors Affecting Construction Labour Productivity for Malaysian Residential Projects.‖ Struct. Surv., 23 (1), 42–54.
[24] Chithkar, k. k, Construction project management, Tata Mcgraw hill education private limited, New Delhi.
[25] Al-Shahri, M., Assaf S., A., Atiyah S., and AbdulAziz.A, (2001). ―The management of construction company overhead costs.‖ International Journal of Project Management, 19, 295-303. [26] Hanna, A. S., and Heale, D. G. (1994). "Factors affecting