PHENOTYPES IN C. ELEGANS
Thesis by Claudiu Giurumescu
In Partial Fulfillment of the Requirements for the Degree of
Doctor of Philosophy
CALIFORNIA INSTITUTE OF TECHNOLOGY Pasadena, California
2008
ii
© 2008 Claudiu Giurumescu
iii ACKNOWLEDGEMENTS
I would foremost like to thank my thesis advisor Professor Anand Asthagiri for allowing me to pursue projects that excite me at my own pace. During my residency at Caltech, he has changed the way I perceive science and view the world. From him I have learned to question reality in the most counterintuitive ways; his keen insight will always amaze me.
I want to thank Professor Paul Sternberg for giving me the opportunity to work in his laboratory and for inspiring me with the excitement of doing science. He played a great role in my decision to wavily go the "worm way" in my scientific career after Caltech. I would also like to thank my other thesis committee members, Professors Mark Davis, David Tirrell and Zhen-Gang Wang, for their valuable time and advice.
The experience at Caltech would not have been complete without my labmates Nick Graham, Niki Galownia, Steve Chapman, Melissa Pope, Kei Kushiro, Jin-Hong Kim, and Paul Minor. I have learned a lot from all of you and I will always appreciate your daily companionship while I was at Caltech. I am also indebted for their friendship to Tharathorn Rimchala and Yuan Gong, whom I had the opportunity to mentor at various times in the Asthagiri lab.
iv allowing me to learn all the things I nowadays know about computers in his
computational lab.
v
ABSTRACT
Design of biomaterials and cellular scaffolds for tissue-engineering applications and regenerative medicine requires a precise understanding of the principles underlying multicellular patterning. Adhesion, migration, division, differentiation, and apoptosis are characteristic cellular behaviors, the engineering of which has the potential to allow creation of custom, multicellular structures. These cellular events occur naturally during embryonic and postembryonic development of multicellular organisms. Development thus offers the opportunity to learn about the design principles and molecular
mechanisms that guide cellular patterning.
A key finding in developmental biology is that a limited set of conserved
molecular signaling pathways act at multiple times and locations throughout the embryo to introduce cell-fate asymmetries in homogenous populations of cells. In turn, these asymmetries serve as starting points for the patterning of new organs. These signaling pathways interact quantitatively at multiple levels, including signaling cues,
post-translational regulation, and gene-regulatory networks, to guide multicellular patterning.
vi In order to answer such questions, we used vulva formation in the nematode Caenorhabditis elegans as a model system of cellular patterning. We formulated a mathematical model of the molecular network underlying cellular-fate specification in this system. Computational analysis of this molecular network reveals that cell–cell coupling through lateral LIN-12/Notch signaling amplifies the perception of the gradient in the epidermal-growth-factor-like soluble cue, LIN-3. Thus, the gradient in LIN-3 concentration produces an even steeper difference in LIN-3-mediated intracellular signals between adjoining cells. Such gradient amplification may be particularly important in converting a shallow, graded-specification signal into a spatial pattern of distinct fate choices.
Through quantitative perturbations of interaction strengths between components of the vulval patterning network, we further show that our modeling approach can correctly predict phenotype patterns observed in C. elegans mutation studies. This study generated a framework for quantitative analysis of molecular networks that links
vii
TABLE OF CONTENTS
Acknowledgements... iii
Abstract... v
Table of Contents... vii
List of Figures ... ix
List of Tables ... xi
Chapter 1: Multicellular Patterning in Development... 1
1.1 Abstract... 1
1.2 Introduction... 1
1.3 Specification Cues ... 3
1.4 Quantitative Signal Processing and Integration... 11
1.5 Vulva Development in C. elegans... 18
1.6 References... 21
Chapter 2: Intercellular Coupling Amplifies Fate Segregation during C. elegans Vulval Development ... 24
2.1 Abstract... 24
2.2 Introduction... 24
2.3 Model Development ... 27
2.4 Improved Gradient Perception... 32
2.5 Fate Plane... 40
2.6 Enhanced Segregation on the Fate Plane... 43
2.7 Parameter Values ... 45
2.8 Robustness of Improved Gradient Perception in Coupled Systems ... 48
2.9 Slight Asymmetry in VPC Array... 50
2.10 References... 52
Chapter 3: Toward Model Validation: Fluorescence Imaging of Live Worms ... 54
3.1 Abstract... 54
3.2 Introduction... 54
3.3 Experimental Validation Strategy... 57
3.4 Results and Discussion ... 60
3.5 Materials and Methods... 80
3.6 Acknowledgements... 84
3.7 References... 84
Chapter 4: Predicting Phenotypic Diversity and the Underlying Quantitative Molecular Transitions... 86
4.1 Abstract... 86
viii
4.3 Phenotypic Capacity ... 88
4.4 Rendering Mutant Phenotypes... 90
4.5 Evolutionary Aspects... 96
4.6 Computational Model of C. elegans Vulval Development... 100
4.7 Quantifying Phenotypic Capacity... 109
4.8 Transition Probability between Phenotypes ... 112
4.9 Phenotype Diversity from Quantitative Changes in the Level of Inductive Signal ... 113
4.10 Segregation of Wild-type Parameter Space into Species-specific Regions... 116
4.11 References... 119
Chapter 5: Recommendations ... 121
5.1 Recommended Future Directions ... 121
ix
LIST OF FIGURES
Figure 1.1. Activin concentration-dependent gene expression domains ... 4
Figure 1.2. Mechanisms of morphogen transport ... 6
Figure 1.3. Transient signals and the irreversibility of commitment and cell fate execution ... 12
Figure 1.4. Dorsoventral patterning in Drosophila... 14
Figure 1.5. Position of vulva precursor cells along C. elegans body... 19
Figure 1.6. Wild-type patterning of C. elegans vulva... 20
Figure 2.1. Spatial patterning of vulval precursor cells in C. elegans... 25
Figure 2.2. Model schematic... 28
Figure 2.3. Gradient amplification in coupled systems ... 35
Figure 2.4. Coupled systems robustly outperform uncoupled systems in gradient sensing ... 37
Figure 2.5. Factors contributing to coupling-mediated gradient amplification ... 39
Figure 2.6. Wild-type and mutant alternating phenotypes on the fate plane ... 42
Figure 2.7. The effect of coupling on segregating two fate-determining signals in a six-cell array... 45
Figure 2.8. Position of P6.p–P8.p of wild-type and mutant alternating phenotypes on the fate plane... 51
Figure 2.9. Position of P6.p–P8.p VPCs on the inductive and lateral signal map... 51
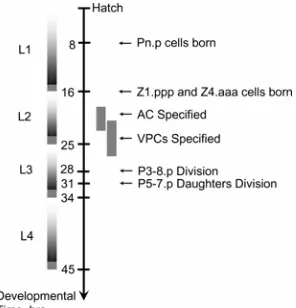
Figure 3.1. Events associated with specification of vulval precursor cells ... 55
Figure 3.2. Worm imaging at 100× magnification ... 60
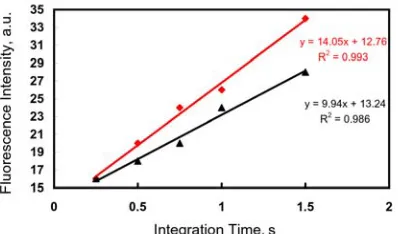
Figure 3.3. Measurement of fluorescence intensity in vulval precursor cells ... 62
Figure 3.4. Dynamics of MPK-1 reporter activity in VPCs at L2 larval stage from single anesthetized worms... 64
Figure 3.5. Dynamics of MPK-1 reporter activity in VPCs at L2 larval stage from multiple anesthetized worms... 66
Figure 3.6. ArIs92 reporter activity dynamics at early-L2 larval stage in unc-54 worms 69 Figure 3.7. ArIs92 fluorescence dynamics at mid-L2 larval stage in unc-54 worms ... 70
Figure 3.8. Worms maintained on microscope slide take longer to develop... 72
Figure 3.9. ArIs92 reporter activity dynamics at early-L3 larval stage in unc-54 worms 73 Figure 3.10. Development on agar plates occurs faster than on microscope slides... 75
x
Figure 3.12. Worm trapping in the microfluidic device ... 78
Figure 3.13. High magnification 100× imaging in the microfluidic device ... 78
Figure 3.14. Worms survive in the microfluidic device ... 79
Figure 4.1. Coupled network restricts phenotypic diversity ... 89
Figure 4.2. Model identifies optimal molecular perturbations necessary to generate experimentally observed mutant phenotypes... 92
Figure 4.3. Hierarchical phenotypic diversity caused by quantitative changes in morphogen level... 96
Figure 4.4. Quantitative differences predicted to have arisen during the evolution of the Caenorhabditis genus ... 98
Figure 4.5. Wild-type patterning of C. elegans vulva... 101
Figure 4.6: Schematic of molecular interactions within and among VPCs. ... 102
Figure 4.7. Discretization of parameter axes ... 110
Figure 4.8. Extended set of phenotypes occurring upon I change ... 115
Figure 4.9. Phenotypic diversity caused by quantitative changes in gradient steepness 115 Figure 4.10. Summary of phenotypes observed experimentally in Caenorhabditis in response to changes in the level of inductive signal ... 117
Figure 4.11. Illustration of translation of phenotypes along morphogen axis to words . 119 Figure 5.1. Pattern of terminal differentiation of vulva precursor cells... 121
xi
LIST OF TABLES
Table 2.1. Dimensional parameters of the model and their typical values ... 46
Table 2.2. Dimensionless groups of the model and their reference values... 46
Table 4.1. Dimensionless model parameters ... 88
Table 4.2. Fate assignment based on threshold values ... 105
Table 4.3. Reference values of dimensional parameters... 108
Table 4.4. Range of values for dimensionless model parameters... 109
Table 4.5. List of phenotypes two standard deviations above mean ... 111
Table 4.6. List of phenotypes two standard deviations below mean ... 111
CHAPTER 1:MULTICELLULAR PATTERNING IN DEVELOPMENT
1.1Abstract
Developing design strategies for tissue engineering and regenerative medicine is
limited by our nascent understanding of how cell populations “self-organize” into
multicellular structures on synthetic scaffolds. Mechanistic insights and design principles
can be gleaned from the quantitative analysis of multicellular patterning during the
natural processes of embryonic and adult development. This chapter describes the
critical layers of signaling mechanisms that drive developmental multicellular patterning:
spatiotemporal presentation of extracellular cues, intracellular signaling networks that
mediate crosstalk among extracellular cues, and finally, intranuclear signal integration at
the level of transcriptional regulatory networks. At every level in this hierarchy, the
quantitative attributes of signals have a profound impact on patterning. We discuss how the simple model organism Caenorhabditis elegans may be used to uncover these quantitative features and their impact on multicellular phenotype through mathematical
modeling and quantitative experiments.
1.2Introduction
The development of a multicellular organism from an embryo is one of nature’s
most remarkable phenomena. Deciphering how this transformation occurs is a
fundamental challenge in biology with profound biomedical implications. Insights into
the molecular signals guiding developmental patterning will provide design strategies to
promote multicellular structure formation in applications such as tissue engineering and
cells in these applications. A major challenge, however, is to engineer a cellular
microenvironment that presents the right combination of cues to promote differentiation
and cellular “self-organization.” This bioengineering challenge will undoubtedly benefit
from a more quantitative and integrative understanding of developmental signals. In fact,
gleaning design insight from natural developmental processes is imperative, since
erroneous manipulation of developmental mechanisms can lead to pathologies. Perhaps,
the most striking example is that aberrations in developmental signals play a prominent
role in the structural and functional regression of tissues during cancer development [1].
Development begins with asymmetric divisions of the fertilized egg, partitioning it into
distinct groups of cells or “progenitor fields” that will ultimately develop into future
organs [2]. Each group executes a distinct gene expression program, thereby specifying
it toward a unique developmental fate. The next round of specification cues further
subdivides the progenitor field, with each subgroup now executing a distinct specification
(i.e., gene expression) program. Thus, development involves successive rounds of
asymmetry-inducing specification cues that trigger specific gene expression programs.
Interspersed among these successive rounds is the cellular execution of the gene
expression program. Specifically, this program dictates cell behaviors, such as division,
migration, death, and extracellular matrix deposition and remodeling—events that shape
and functionalize developing tissues, and ultimately, the organism.
Thus, the molecular signals at the heart of development are the specification cues
and the network of biochemical reactions that process these cues and instruct the
since groups of cells must be partitioned according to a precise three-dimensional
geometry. Once the specification cue has been perceived, cells must then execute the
downstream gene expression program in a context-sensitive manner. Here, context has twofold significance. First, in any spatial context, cells are exposed to multiple cues.
The specification cue must be processed in this rich backdrop of signals. Furthermore, in
some cases, information from two or more specification cues must be integrated to induce
the appropriate response. Second, cellular response to a specification cue must take into
account the temporal context. When a cell is exposed to a specification cue at a
particular time in development, its response will be biased by its developmental history.
For example, the cell response will be affected by its proteomic profile, which is
determined by the series of gene expression programs executed up to that time. In fact,
the context dependence of cell response is absolutely critical, since the same specification
cue is often used in multiple places and times to guide development. Cells respond to the
same cue in distinct ways by accounting for their spatial and temporal context through
remarkably sophisticated signal integration mechanisms.
1.3Specification Cues
Specification cues are signals that instruct cells to execute a particular gene
expression program, and thereby propel cells to a particular fate. Classical models
envisioned that spatial gradients in soluble cues may guide multicellular patterning over
longer length scales [3]. Indeed, such soluble specification cues or morphogens have
been identified, including four major families: fibroblast growth factor (FGF), hedgehog
operate in a wide span of organisms including both invertebrates (Drosophila, C. elegans, and sea urchin) and vertebrates (Xenopus, zebrafish, mouse, and chicken).
Morphogens are signaling molecules that partition a field of cells into two or
more fates [5]. They act directly to specify fates in a concentration-dependent manner
(Figure 1.1). Because cells respond to the local concentration, the shape of the
morphogen gradient across a field of cells dictates the pattern of cell fates. Although
several factors had been long thought to act as morphogens, direct experimental evidence
for spatially graded, concentration-dependent action was first demonstrated for activin, a
member of the TGFβ family, that guides mesoderm induction in Xenopus embryos [6].
Figure 1.1. Activin concentration-dependent gene expression domains
Cells that are closest to the activin morphogen source are exposed to a high concentration of activin and express goosecoid. At intermediate distances, activin induces the
expression of brachyury. Cells farthest away from morphogen source receive the least amount of morphogen and do not express either gene.
Spatial gradients are established by localized secretion of morphogen along with
its transport across the cell field. The secreting source may be a single cell as in the case
Drosophila wing [8]. In systems where a single cell releases the morphogen, the gradient will most likely span a short distance on the order of several cell lengths. Morphogen
release from several cells can lead to gradients that span hundreds of cells lengths,
although short range coverage is also possible as in Hh-initiated AP patterning in the
Drosophila wing [9]. Importantly, morphogens need not be extracellular factors. During early stages of Drosophila development, the embryo is a multinuclear synctium with no cell boundaries. Gradients in maternal gene products, such as Dorsal and Bicoid,
establish asymmetries in gene expression during dorsoventral (DV) and AP patterning,
respectively, of the Drosophila embryo.
Secreted extracellular morphogens are generally expressed as transmembrane
precursors that are later processed by proteases to release the soluble form [7, 10]. The
mechanisms regulating morphogen release are beginning to be uncovered. Transport
between intracellular compartments and retention in the endoplasmatic reticulum (ER)
play a regulatory role in the release of Spitz morphogen during Drosophila eye development [11]. However, interesting questions remain: how are source cells
synchronized to initiate (and to stop) the release of morphogen? Are such decisions
autonomous or nonautonomous? Synchronous release may involve cell–cell
communication, a plausible mechanism if the secreting source were a small group of
cells. Such coordinated secretion would be more difficult if the secreting source were a
large group of cells. In this case, a relay mechanism may provide synchronicity and the
desired amplification. For example a long range gradient in Dpp morphogen patterns the
Once secreted, the morphogen must be transported across the cell field to
establish a gradient. Several genetics studies revealed that endocytosis—the
internalization of morphogen-bound receptor by the cell—plays a key role in establishing
morphogen gradients [13, 14]. These observations suggested that morphogen transport
may occur by an active, cell-assisted process labeled transcytosis (Figure 1.2). In this
process, morphogen-bound receptors are endocytosed and then exocytosed or brought
back to the cell surface. Exocytosed complexes dissociate and release the morphogen. If
the reemergence of the internalized morphogen is isotropic, transcytosis-mediated
morphogen transport may be characterized by an effective diffusion coefficient [15]. In
fact, it has been suggested that passive diffusion may not be well suited to establish
steady-state morphogen gradients [16].
Figure 1.2. Mechanisms of morphogen transport
(A) Transport by passive diffusion entails release of morphogen from the Golgi (green) in the extracellular space by the source cell (left) and random walk of molecules away from the source. The morphogen can be endocytosed and transported through early
However, an integrative analysis of diffusion-mediated transport alongside key
biochemical pathways revealed that diffusive transport can establish steady-state
morphogen gradients, provided there are degradation sinks for the morphogen [17]. In
the absence of morphogen degradation, an ever-increasing morphogen concentration will
result in uniform occupancy of target receptors at steady state. However, in the presence
of morphogen sinks, a steady-state gradient in receptor occupancy will form in a
diffusion-based transport model. Indeed, receptor-mediated endocytosis itself promotes
morphogen degradation [13, 18]. Thus, the requirement for endocytosis to establish
morphogen gradients is entirely consistent with diffusive transport.
Furthermore, the diffusion/endocytosis model may be physically more plausible
than transcytosis, since the latter may require that certain cellular processes occur at
nonphysiological rates. For example, the formation of a steady-state gradient on the
timescale of a typical developmental process would require that morphogen be
transported across a single cell on an average time scale of 100 seconds [17], seemingly
unachievable considering the relatively slow kinetics of the steps involved in
transcytosis: receptor association, internalization, directed transport through the cell,
exocytosis, and receptor dissociation. However, it can be argued that the rates of these
processes have not been measured in vivo where cells may be optimized to facilitate transcytosis [15]. Furthermore, the diffusion/endocytosis model is not consistent with all
experimental data [19]. In cell fields where a patch of cells is deficient in endocytosis, a
depression in morphogen concentration is observed adjacent to the patch on the side
predict that in the endocytosis-defective patch, reduced receptor degradation increases
receptor expression and prevents morphogen transport, thereby producing the “shadow”
effect. However, recent measurements of the receptor expression level in the
endocytosis-deficient patch suggest that the increase in receptor expression is not of
sufficient magnitude to explain quantitatively the shadow phenomenon [19].
In summary, an integrative analysis demonstrates that diffusion is entirely capable
of establishing morphogen gradients in an endocytosis-dependent fashion, although other
mechanisms such as transcytosis may play a concomitant role. Model predictions about
morphogen transport may be validated by comparison to direct measurements of
morphogen gradients. Gradients have been directly observed in vivo using green fluorescent protein (GFP) fusion constructs. This approach has been used to study the
formation of the Dpp and Wg gradients in Drosophila during the anterior-posterior patterning of wing discs and during embryonic development, respectively [13, 20, 21].
Mathematical models have been constructed to explain the mechanisms of Dpp gradient
formation and the role of receptors in shaping this gradient [19, 22].
However, in most cases, direct observation of the gradient has been hampered by
difficulty in expressing GFP-fused morphogens or in using antibodies to detect low
concentrations of morphogens [19, 23]. In these cases, the intracellular expression of a
gene target is measured as an indirect monitor of the extracellular morphogen. For
LIN-3 target gene, egl-17 [24]. Such studies offer important qualitative confirmation of the morphogen gradient, but do not provide key quantitative information, such as the
steepness of the steady-state gradient.
A gradient that is too shallow or too steep would not be biologically useful. A
metric of gradient steepness is the ratio L/λ where λ is the characteristic decay length
scale of the morphogen gradient and L is the length of the field of cells to be patterned
[25]. A biologically useful gradient would have a steepness characterized by L/λ = 1.
Shvartsman and colleagues recently described an elegant systems approach to infer
quantitatively the steady-state gradient in the morphogen Gurken in the Drosophila egg chamber [26]. Using molecular genetics, the expression level of the Gurken receptor
(EGFR) was manipulated in order to alter the Gurken morphogen gradient. Since the
gradient could not be directly measured, its effect on the expression of the target gene
pipe was quantified using imaging techniques. This quantitative data set that related EGFR expression level to the spatial boundaries of pipe expression was fit to a systems-scale model of Gurken gradient formation and signaling. This analysis revealed that the
steady-state Gurken gradient is characterized by a L/λ value of 2.7. This model-based
estimation of the parameter L/λ provides complete information about the full, nonlinear
shape of the Gurken gradient and offers intriguing insight on how sensitive downstream
gene expression must be to Gurken concentration. For example, a significant change in
gene expression program is observed at a boundary where the Gurken gradient changes
by only threefold, suggesting a remarkable switchlike sensitivity of these cells to Gurken
This type of ultrasensitivity to morphogen concentration would seem to suggest
that even mild fluctuations in gradient formation would significantly perturb
developmental patterning. Indeed, it is expected that a simple transport model involving
secretion, diffusion and degradation would yield gradients that are highly sensitive to
variations in parameters, such as temperature and the secretion rate [25]. In some cases,
additional mechanisms are employed to buffer morphogen gradient formation against
these fluctuations. For example, elevations in the morphogen secretion rate are buffered
by a feedback loop during AP patterning of Drosophila wing [27]. Here, the Hh
morphogen induces localized expression of its receptor Ptc, which in turn sequesters and
directs Hh to endocytic degradation. This negative feedback loop is a robust mechanism
that limits the morphogen from reaching distant cells in the event of elevated morphogen
secretion.
Yet, in other systems, the steady-state gradient is not robust to variations in
temperature, ligand secretion rates, or geometrical variations [25, 28]. The Bicoid
gradient that patterns Drosophila embryo along anterior-posterior axis shows an embryo-to-embryo variability in its diffusion length of 5% of embryo length. Interestingly, the
expression of the downstream gene target Hunchback (Hb) is robust to these fluctuations.
Instead of exhibiting fluctuations in the position of Hb expression boundary of 7% of
embryo length (about 7 cell diameters), the value expected based on the above variability
in the Bicoid gradient, embryos show only 1% variability. Thus, in some systems,
robustness may be conferred not at the level of gradient formation, but by the
1.4Quantitative Signal Processing and Integration
Upon receiving a specification cue, cells must choose a fate that precisely
accounts for (a) the quantitative nature of the signal, (b) the spatial context that may
include other environmental cues, and (c) the cell’s developmental history. Intracellular
molecular networks achieve this quantitative signal processing and integration of spatial
and temporal context.
The first step in processing graded levels of extracellular specification cues
involves their detection by cell surface receptors. The cells must then interpret this
quantitative information from its receptors to choose between distinct fates. The MAP
kinase pathway is a common signaling “protocol” used across a wide range of
developmental systems [29-31] and performs with quantitative properties that would be
desirable in a developmental context. Foremost, the MAP kinase cascade has been
shown to convert a graded stimulus into a digital output, a feature that has clear
implications for converting a spatial morphogen gradient into a discrete pattern of cell
responses (Figure 1.1). While some of this switchlike behavior is due to the cascade
structure of the MAP kinase module, the dominant contribution is provided by positive
feedback [32]. In Xenopus oocyte extracts, MAP kinase activity increases the expression of Mos, an upstream element in the MAP kinase activation pathway. This positive
feedback yields a switchlike response to a graded stimulus, and inhibition of protein
When the positive feedback is of sufficient magnitude, the MAP kinase pathway
encodes another attractive feature for development – irreversibility (Figure 1.3). Upon
transient stimulation with progesterone, the Xenopus oocyte irreversibly specifies from the immature to mature state [33]. The MAP kinase pathway mediates this irreversible
specification. The positive feedback loop in the MAP kinase module acts in concert with
a second signaling module that also contains a positive feedback loop. The combined
effect is that the progesterone stimulus activates maturation, and even upon removal of
[image:23.612.171.484.318.441.2]the stimulus, the cell remains committed to that fate.
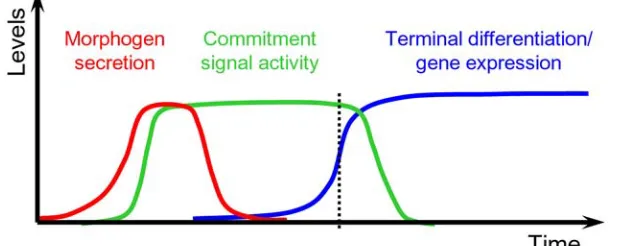
Figure 1.3. Transient signals and the irreversibility of commitment and cell fate execution
Specification cues such as morphogens (red) are secreted only transiently. This transient cue activates intracellular signals (green) that commit cells to a fate. These intermediate commitment signals must be irreversible on the short timescale during which the
specification cue may subside. Over longer timescales and once past the point of commitment (vertical dotted line), the commitment signals must also dissipate, since intracellular signaling pathways, such as the MAP kinase cascade, are often reused in multiple contexts. Unlike the specification cue and the commitment signal, the
expression of terminal differentiation genes (blue) associated with a specific cell fate are expressed irreversibly.
Specification cues presented to cells during development are present only
transiently, long enough for the cell to commit to a fate, but short enough to prepare the
elegans, the EGF-like morphogen LIN-3 is secreted by the anchor cell to stimulate vulval precursor cell specification [7]; later, the descendants of vulval precursor cells release
LIN-3 toward the anchor cell to induce vulval-uterine attachment [34]. Since cues are
only transient, irreversible cell commitment to execute particular fates is critical.
An important observation is that even intermediate signals, such as MAP kinase,
are re-used. Thus, even though intermediate signals may be irreversible on the timescale
of fate commitment, they too must decay back to a basal level to be available for the next
round of specification cues. We hypothesize that this reversibility of intermediate
commitment signals over longer time scales is achieved by deactivating the positive
feedback pathways. However, it should be noted that fate execution itself cannot be
reversible. Indeed, if the fate is cell division or death, the condition of irreversibility is
obviously satisfied. However, if fate execution involves the expression of specific genes,
mechanisms must be put in place to maintain that expression once the specification cue
and intermediate commitment signals have dissipated. Positive feedback loops at the
level of gene regulation may be involved.
Notably, a conversion from an analog to an irreversible, digital signal still leaves
the cell with a conundrum. How do different levels of a single molecular signal, such as
MAP kinase, trigger substantially distinct gene expression programs? In some systems,
this quantitative decoding may occur at a point that is most proximal to gene expression:
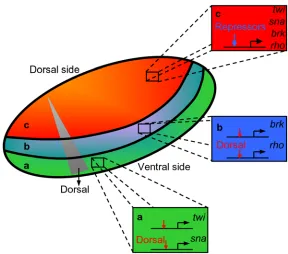
factor Dorsal establishes a spatial pattern of gene expression (Figure 1.4). The cis -regulatory elements of gene targets like twist and snail contain low affinity binding sites for Dorsal, and these genes are expressed in the ventral-most field where Dorsal
concentrations are high. Meanwhile, gene targets such as rho that are expressed more dorsally possess optimal Dorsal binding sites in their cis-regulatory elements. These higher affinity sites compensate for the lower Dorsal concentrations in that region. In
fact, the number and quality of Dorsal binding sites on cis-regulatory elements strongly correlates with the pattern of dorsoventral gene expression across four divergent species
[image:25.612.179.467.331.585.2]of Drosophilids [35].
Figure 1.4. Dorsoventral patterning in Drosophila
These findings strongly suggest a model where the binding affinity of
transcriptional activators to gene targets sets the threshold of specification signal needed
to initiate gene expression. Genes with low affinity transcription factor binding sites may
be expressed only if the specification signal is sufficiently high. Meanwhile, genes
possessing high affinity binding sites would be responsive even if the specification signal
were low. However, how do these high affinity binding sites remain unresponsive in
regions where the specification signal is high? This additional quantitative selectivity is
also prescribed by cis-regulatory elements, but via a mechanism unrelated to binding affinity for transcription factors. Cis-regulatory elements contain binding sites for multiple transcription factors, some activators and others inhibitors of gene expression.
Combinatorial processing of these multiple inputs determines the net level of gene
expression.
Such combinatorial processing of multiple inputs plays a key role in Drosophila
DV patterning. As described above, the gene target snail contains low affinity binding sites for Dorsal and is expressed only in the ventral-most region where Dorsal
concentration is highest. Interestingly, snail encodes a transcriptional repressor that binds cis-regulatory elements of other gene targets of Dorsal, including rho. Hence, Snail represses rho expression in the ventral-most region despite the high concentrations of Dorsal. Meanwhile, in the adjacent region, the concentration of Dorsal and Snail
In this manner, cis-regulatory elements serve as crucial points of signal integration. Significant advances have been made in uncovering the network of
transcription factors and the cis-regulatory elements on which they act. Such gene regulatory networks have been delineated for endomesoderm specification in sea urchin,
dorsal-ventral axis patterning in Drosophila, vulva differentiation in C. elegans , and mesoderm specification in Xenopus (reviewed by [36, 37]). A key consideration, however, is that each cis-regulatory element or node in this network is not merely a connection for multiple inputs, but is a quantitative processor. The concentrations of
input transcription factors are detected by the affinity and number of sites on the node.
The relative amounts of activators and repressors are also part of the calculus. These
quantitative aspects of the input then determine the extent of output, i.e., gene
transcriptional activity.
The quantitative signal processing and integration that occur at the cis-regulatory modules provide not only spatial, but also temporal context. During early development
of sea urchin, the endo-16 gene [38] is expressed in the entire vegetal plate, i.e., progeny of cells derived from the veg2 blastomeres. Later in development, its expression further
increases in endoderm and future archenteron, while decaying back to basal level in veg2
progeny cells that will become mesoderm. Throughout this time, the gene is continually
repressed in micromeres or veg1 progeny cells. In each of these spatial and temporal
recursive one. At an earlier stage, each panel of transcription factors was expressed as
dictated by their own cis-regulatory elements. Thus, the history of genes that were expressed in a particular cell encodes its temporal context, thereby priming the cell to
respond appropriately to its current specification cues.
This cascade of gene expression events is not a simple linear pathway, but rather a
gene regulatory network. The genes and the associated cis-regulatory elements that comprise these genetic circuits have been elucidated for a wide range of developmental
contexts [37]. However, the quantitative calculations that occur at each cis-regulatory element remain to be elucidated. Such quantitative insight would enable the development
of mathematical models of these networks. Such models can allow us to explore the
capabilities of the network beyond the developmental context from which they were
formulated. Indeed, development may not exhaustively cover all the contexts to which
the cis-regulatory module of each gene responds. Analyzing the performance of cis -regulatory modules under developmentally unachievable contexts would offer a method
to explore potential disease states or synthetic/engineering objectives.
But, one critical challenge is to develop models that not only track biochemical
signals in time and space, but also predict what the actual cell fate decisions and patterns
will be. Such models could explore the connection between network structure and
phenotypes that are typically scored in genetics experiments. In addition, these models
could provide the foundation for computationally exploring phenotypic diversity that may
steps to address these computational challenges in developmental and evolutionary
biology.
1.5Vulva Development in C. elegans
The nematode Caenorhabditiselegans has been established as a model organism to study genetics of development since the pioneering studies led by Sydney Brenner in
the 1970s [39]. It is suitable for laboratory culture and experimentation because of its
self-breeding ability, short life span (about two weeks of development and senescence)
and ease of genetic manipulation. Moreover, its transparent body allows visualization of
individual cells by Nomarski optics. The 1 mm long worm has 959 somatic cells that
derive from the fertilized egg with precise invariant lineages [40]. It is the first
multicellular organism to have its genome sequenced [41].
Development of the vulva in C. elegans is a well-established model for studying cell patterning [42]. Over the past decades, genetics experiments have allowed inference
of the molecular mechanisms guiding vulval patterning. The vulva is derived from a
linear array of six vulva precursor cells (P3-8.p) [40], aligned along the antero-posterior
axis of the body (Figure 1.5). These cells can adopt three fates: primary (1°), secondary
(2°), and tertiary (3°). Only the first two fates are vulval fates, i.e., if adopted by a cell,
that cell will be the ancestor of cells that ultimately form the vulva. While all six cells
have the potential to adopt vulval fates [43], only three cells (P5-7.p) do so in wild-type
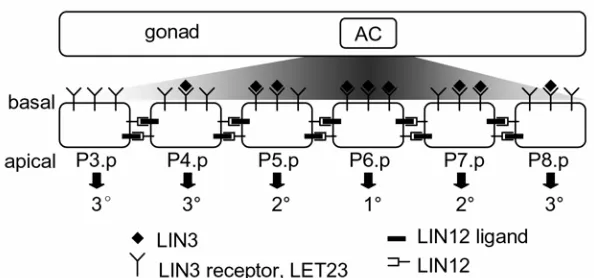
Figure 1.5. Position of vulva precursor cells along C. elegans body
The vulva precursor cells (P3-8.p) are aligned along the antero-posterior axis of the body. Upon receiving the LIN-3 stimulus from the anchor cell (AC), the centrally located cells P5-7.p start to divide and differentiate into the twenty-two cells that ultimately form the vulva.
Patterning of the vulva starts when EGF-like factor LIN-3 is released by the
centrally positioned anchor cell (AC) (Figure 1.5 and Figure 1.6) [7]. The factor is
perceived by the vulva precursor cells in a graded fashion and triggers activity of the Ras
pathway [30], leading to the activation of MPK-1, the C. elegans MAP kinase. The MAP kinase inductive signaling in a particular cell leads to expression of ligands for the
receptor LIN-12 [44] in that cell, which in turn activates LIN-12 lateral signaling in the
neighboring cells. These two signals are further coupled together, as inductive signaling
enhances LIN-12 endocytosis and degradation in the same cell [45], while lateral
signaling transcribes genes encoding phosphatases that deactivate components of the Ras
pathway [46]. Fates (1°, 2°, or 3°) are determined by the balance of the inductive and
lateral biochemical signals present in a cell. Cells at high inductive and low lateral
signaling adopt the 1° fate, cells at low inductive and high lateral signaling adopt the 2°
Figure 1.6. Wild-type patterning of C. elegans vulva
The anchor cell (AC) stimulates the vulva precursor cells Pn.p with LIN-3 in a graded manner. These cells laterally interact with one another through LIN-12 pathway. Integration of signaling from LIN-3 receptor LET-23 and LIN-12 receptor results in the wild-type pattern of differentiation 3°3°2°1°2°3°.
In this system, we focused on quantitative issues concerning the coupled network
topology of inductive and lateral signaling (Chapter 2) and the patterns of cell fates that
could emerge from this network when it is quantitatively perturbed (Chapter 4).
Computational analysis of this molecular network as detailed in Chapter 2 reveals that
cell–cell coupling amplifies the perception of the LIN-3 gradient [47]. Thus, a gradient
in LIN-3 concentration produces an even steeper difference in LIN-3-mediated
intracellular signals between adjoining cells. Such gradient amplification may be
particularly important in converting a shallow, graded morphogen signal into a spatial
pattern of digital choices suitable for robust fate determination. Variation of interaction
strength among the components of the network as detailed in Chapter 4 is able to predict
mutant phenotypes of cell patterns that were observed in genetics experiments. Our
computational framework offers opportunities for understanding cellular fate decisions
based on biochemical signals in other systems (for example cell fate specification in the
immune system or cell patterning in tissue engineering applications) and for
related species with similar molecular network topologies. Preliminary experimental
work was conducted to establish systems and methods to begin to validate the model
predictions made in Chapter 2. These are presented in Chapter 3. Finally, future
directions will be discussed in Chapter 5.
1.6References
1. Hanahan, D. and R.A. Weinberg, The hallmarks of cancer. Cell, 2000. 100(1): p. 57-70.
2. Davidson, E.H., Later embryogenesis: regulatory circuitry in morphogenetic fields. Development, 1993. 118(3): p. 665-90.
3. Crick, F., Diffusion in embryogenesis. Nature, 1970. 225(5231): p. 420-2. 4. Anderson, K.V. and P.W. Ingham, The transformation of the model organism: a
decade of developmental genetics. Nat Genet, 2003. 33 Suppl: p. 285-93. 5. Tabata, T. and Y. Takei, Morphogens, their identification and regulation.
Development, 2004. 131(4): p. 703-12.
6. Gurdon, J.B., et al., Activin signalling and response to a morphogen gradient.
Nature, 1994. 371(6497): p. 487-92.
7. Hill, R.J. and P.W. Sternberg, The gene lin-3 encodes an inductive signal for vulval development in C. elegans. Nature, 1992. 358(6386): p. 470-6.
8. Lecuit, T., et al., Two distinct mechanisms for long-range patterning by Decapentaplegic in the Drosophila wing. Nature, 1996. 381(6581): p. 387-93. 9. Tabata, T. and T.B. Kornberg, Hedgehog is a signaling protein with a key role in
patterning Drosophila imaginal discs. Cell, 1994. 76(1): p. 89-102.
10. Lee, J.R., et al., Regulated intracellular ligand transport and proteolysis control EGF signal activation in Drosophila. Cell, 2001. 107(2): p. 161-71.
11. Schlesinger, A., et al., Small wing PLCgamma is required for ER retention of cleaved Spitz during eye development in Drosophila. Dev Cell, 2004. 7(4): p. 535-45.
12. Strigini, M. and S.M. Cohen, Formation of morphogen gradients in the Drosophila wing. Semin Cell Dev Biol, 1999. 10(3): p. 335-44.
13. Entchev, E.V., A. Schwabedissen, and M. Gonzalez-Gaitan, Gradient formation of the TGF-beta homolog Dpp. Cell, 2000. 103(6): p. 981-91.
14. Dubois, L., et al., Regulated endocytic routing modulates wingless signaling in Drosophila embryos. Cell, 2001. 105(5): p. 613-24.
15. Vincent, J.P. and L. Dubois, Morphogen transport along epithelia, an integrated trafficking problem. Dev Cell, 2002. 3(5): p. 615-23.
16. Kerszberg, M. and L. Wolpert, Mechanisms for positional signalling by
morphogen transport: a theoretical study. J Theor Biol, 1998. 191(1): p. 103-14. 17. Lander, A.D., Q. Nie, and F.Y. Wan, Do morphogen gradients arise by diffusion?
18. Gonzalez-Gaitan, M., Endocytic trafficking during Drosophila development.
Mech Dev, 2003. 120(11): p. 1265-82.
19. Kruse, K., et al., Dpp gradient formation by dynamin-dependent endocytosis: receptor trafficking and the diffusion model. Development, 2004. 131(19): p. 4843-56.
20. Teleman, A.A. and S.M. Cohen, Dpp gradient formation in the Drosophila wing imaginal disc. Cell, 2000. 103(6): p. 971-80.
21. Pfeiffer, S., et al., Producing cells retain and recycle Wingless in Drosophila embryos. Curr Biol, 2002. 12(11): p. 957-62.
22. Eldar, A. and N. Barkai, Interpreting clone-mediated perturbations of morphogen profiles. Dev Biol, 2005. 278(1): p. 203-7.
23. Belenkaya, T.Y., et al., Drosophila Dpp morphogen movement is independent of dynamin-mediated endocytosis but regulated by the glypican members of heparan sulfate proteoglycans. Cell, 2004. 119(2): p. 231-44.
24. Yoo, A.S., C. Bais, and I. Greenwald, Crosstalk between the EGFR and LIN-12/Notch pathways in C. elegans vulval development. Science, 2004. 303(5658): p. 663-6.
25. Houchmandzadeh, B., E. Wieschaus, and S. Leibler, Establishment of
developmental precision and proportions in the early Drosophila embryo. Nature, 2002. 415(6873): p. 798-802.
26. Goentoro, L.A., et al., Quantifying the Gurken morphogen gradient in Drosophila oogenesis. Dev Cell, 2006. 11(2): p. 263-72.
27. Eldar, A., et al., Self-enhanced ligand degradation underlies robustness of morphogen gradients. Dev Cell, 2003. 5(4): p. 635-46.
28. Houchmandzadeh, B., E. Wieschaus, and S. Leibler, Precise domain specification in the developing Drosophila embryo. Phys Rev E Stat Nonlin Soft Matter Phys, 2005. 72(6 Pt 1): p. 061920.
29. Voas, M.G. and I. Rebay, Signal integration during development: insights from the Drosophila eye. Dev Dyn, 2004. 229(1): p. 162-75.
30. Kornfeld, K., Vulval development in Caenorhabditis elegans. Trends Genet, 1997.
13(2): p. 55-61.
31. Nilson, L.A. and T. Schupbach, EGF receptor signaling in Drosophila oogenesis.
Curr Top Dev Biol, 1999. 44: p. 203-43.
32. Ferrell, J.E., Jr., Building a cellular switch: more lessons from a good egg.
Bioessays, 1999. 21: p. 866-870.
33. Xiong, W. and J.E. Ferrell, Jr., A positive-feedback-based bistable 'memory module' that governs a cell fate decision. Nature, 2003. 426(6965): p. 460-5. 34. Sherwood, D.R. and P.W. Sternberg, Anchor cell invasion into the vulval
epithelium in C. elegans. Dev Cell, 2003. 5(1): p. 21-31.
35. Papatsenko, D. and M. Levine, Computational identification of regulatory DNAs underlying animal development. Nat Methods, 2005. 2(7): p. 529-34.
36. Stathopoulos, A. and M. Levine, Genomic regulatory networks and animal development. Dev Cell, 2005. 9(4): p. 449-62.
38. Yuh, C.H. and E.H. Davidson, Modular cis-regulatory organization of Endo16, a gut-specific gene of the sea urchin embryo. Development, 1996. 122(4): p. 1069-82.
39. Brenner, S., The genetics of Caenorhabditis elegans. Genetics, 1974. 77(1): p. 71-94.
40. Sulston, J.E. and H.R. Horvitz, Post-embryonic cell lineages of the nematode, Caenorhabditis elegans. Dev Biol, 1977. 56(1): p. 110-56.
41. Genome sequence of the nematode C. elegans: a platform for investigating biology. Science, 1998. 282(5396): p. 2012-8.
42. Sternberg, P.W. and H.R. Horvitz, Pattern formation during vulval development in C. elegans. Cell, 1986. 44(5): p. 761-72.
43. Sulston, J.E. and J.G. White, Regulation and cell autonomy during postembryonic development of Caenorhabditis elegans. Dev Biol, 1980. 78(2): p. 577-97.
44. Chen, N. and I. Greenwald, The lateral signal for LIN-12/Notch in C. elegans vulval development comprises redundant secreted and transmembrane DSL proteins. Dev Cell, 2004. 6(2): p. 183-92.
45. Shaye, D.D. and I. Greenwald, Endocytosis-mediated downregulation of LIN-12/Notch upon Ras activation in Caenorhabditis elegans. Nature, 2002.
420(6916): p. 686-90.
46. Berset, T., et al., Notch inhibition of RAS signaling through MAP kinase
phosphatase LIP-1 during C. elegans vulval development. Science, 2001. 291: p. 1055-1058.
47. Giurumescu, C.A., P.W. Sternberg, and A.R. Asthagiri, Intercellular coupling amplifies fate segregation during Caenorhabditis elegans vulval development.
24
CHAPTER 2:INTERCELLULAR COUPLING AMPLIFIES FATE
SEGREGATION DURING C. ELEGANS VULVAL DEVELOPMENT1
2.1Abstract
During vulval development in C. elegans, six precursor cells acquire a spatial pattern of distinct cell fates. This process is guided by a gradient in the soluble factor, LIN-3, and by direct interactions between neighboring cells mediated by the Notch-like receptor, LIN-12. Genetic evidence has revealed that these two extracellular signals are coupled: lateral cell-cell interactions inhibit LIN-3-mediated signaling, while LIN-3 regulates the extent of lateral signaling. To elucidate the quantitative implications of this coupled network topology for cell patterning during vulval development, we developed a mathematical model of LIN-3/LIN-12-mediated signaling in the vulval precursor cell array. Our analysis reveals that coupling LIN-3 and LIN-12 amplifies cellular perception of the LIN-3 gradient and polarizes lateral signaling, both of which enhance fate
segregation beyond that achievable by an uncoupled system.
2.2Introduction
Vulval development in C. elegans involves the spatially coordinated commitment of vulval precursor cells (VPCs) toward distinct cell fates, labeled primary (1o),
secondary (2o) and tertiary fates (3o) (Figure 2.1). This patterning is guided by an epidermal growth factor (EGF)-like soluble factor LIN-3 that is produced by a centrally positioned anchor cell (AC). LIN-3 activates an EGF receptor(LET-23)-mediated signal
1 Reprinted from Proc. Natl. Acad. Sci. USA, 2006.
25
transduction pathway in the VPCs that is required for 1º and 2º cell fates; in the absence of LIN-3, all VPCs assume the default, 3º fate [1].
Figure 2.1. Spatial patterning of vulval precursor cells in C. elegans
The anchor cell (AC) in the gonad releases LIN-3 (♦), which distributes across the linear array of vulval precursor cells (P3.p–P8.p). This factor binds its receptor LET-23 ( ) on the basal surface of the precursor cells and provides an inductive signal for fate
specification. The interplay between the inductive signal (LIN-3:LET-23 complexes, ) and lateral coupling between neighboring cells mediated by LIN-12 ( ) and its ligands ( ) specifies P3.p–P8.p cells to three distinct cell fates (1º, 2º, and 3º).
The dose of LIN-3 is a critical determinant of cell fate. In animals where all VPCs but one are ablated, the intact VPC chooses a cell fate depending on its relative position to the AC: when close to the AC, the VPC chooses 1º fate, while when distal from the AC, it chooses the 3º fate. At intermediate position, the VPC chooses a 2º fate [1]. Indeed, a gradient in LIN-3 signaling has been observed indirectly in vivo using a sensitive reporter of LIN-3 mediated transcriptional activity [2]. These observations strongly support the notion that LIN-3 acts as a morphogen, a soluble factor whose spatial concentration gradient influences cell fate choices [3, 4].
26
organisms lacking LIN-12, VPCs fail to commit to 2º fate, producing only 1º/3º cell fates [5]. Meanwhile, in mutant organisms with hyperactive inductive, LET-23–mediated signals, VPCs acquire not only 1o fates, but also 2o fates. In fact, an intriguing alternating pattern of 1º and 2º cells (e.g., 2º 1º 2º) is observed, suggesting that commitment to 1º fate forces its direct neighbors to acquire 2º fate via a lateral “inhibitory” signal [6]. These and other observations suggest a sequential model wherein LIN-3 inductive signal is essential only to promote 1º cell fate, which in turn stimulates 2º fate choice via a direct, lateral signal to its neighbors.
Resolving the relative importance of the LIN-3 gradient (morphogen model) and the lateral signal (sequential model) is challenged by the fact that these two extracellular signals are coupled through an intracellular signaling network [7]. LIN-3 binds LET-23 and produces intracellular signals via a canonical Ras-MAP kinase signaling pathway [8]. Activation of the MAP kinase, MPK-1, stimulates the production of LIN-12 ligands and the endocytosis of LIN-12 [9-11]. Thus, the inductive LIN-3 signal influences the extent to which each VPC sends out and receives lateral signal by modulating the expression of LIN-12 ligand and LIN-12, respectively. LIN-12, in turn, affects the extent to which each VPC is responsive to the inductive signal: LIN-12 stimulates the transcription of negative regulators of the LIN-3 mediated Ras signaling pathway [2, 12].
27
that of its neighbors, it is expected to influence how each VPC responds to its local LIN-3 concentration. Conversely, the local LIN-3 concentration will impact how effectively a particular VPC receives and sends lateral signals. Here, we develop and analyze a mathematical model of LIN-3/LIN-12-mediated signaling in order to elucidate quantitatively how this network topology achieves spatially patterned cell fate specification.
2.3Model Development
Vulval precursor cells are treated as a discrete, linear array of cells, wherein each cell (i) is stimulated by an inductive signal (Indi) corresponding to the number of
LIN-3:LET-23 complexes per cell. The vector of inductive signals
(
Ind={ }
Indi)
defines the external morphogen gradient to which the VPC array responds. In each cell, theinductive signal (Indi) activates the MAP kinase MPK-1, producing MPK-1* (Figure 2.2).
28
Figure 2.2. Model schematic
A pair of interacting cells, i and i+1, is shown; longer cell arrays are simulated by adding similar modular cells to the array. The inductive signal Ii activates MPK-1 in each cell i
with rate constant km+. Constitutive phosphatases Ph deactivate MPK-1* with rate
constant .km− The inductive signal upregulates the lateral signal in the neighboring cell with rate constant kx3 and downregulates it in the same cell with rate constant kx2. In turn, the lateral signal in each cell deactivates MPK-1* with rate constant
1. x
k
In addition to constitutive deactivation, the level of MPK-1* in each cell is affected by lateral signal activity. Lateral signal activity in cell i (lati) is received via the
receptor LIN-12 and stimulates transcription of negative regulators of MPK-1. All together, the cumulative effects of inductive stimulation, constitutive deactivation and lateral signal-mediated deactivation determine the level of MPK-1* as represented by the following differential equation:
(
)
(
)
(
)
(
)
( )
( )
2(
*i)
i 2 2 i * i T i i * i mpk lat lat mpk Ph mpk Ind t mpk 1 + − − = + − lat M x m m K k k k d d , (2.1)where PhT is the amount of phosphatase per cell; km+ and km− are the second-order rate
constants for MPK-1 activation and constitutive deactivation, respectively; kx1 is a rate
29
of the Hill function describing the transcriptional events associated with expression of MPK-1* deactivators.
The amount of lateral signal received by cell i (lati) is determined by two MPK-1–
dependent processes. First, MPK-1* stimulates the endocytic degradation of the LIN-12 receptor, thereby decreasing the reception of lateral signal. Second, active MPK-1 in
neighboring cells ( * 1 i
mpk+ and * 1 -i
mpk ) stimulates the synthesis of ligands for LIN-12,
thereby increasing the lateral signal into cell i. In addition to these MPK-1*-mediated effects, the level of lateral signal (lati) is determined by constitutive synthesis and
degradation.
Because little quantitative information is available on the regulation of LIN-12 endocytosis and LIN-12 binding to its ligands within the intercellular space, we sought to capture the salient features of LIN-12 regulation. Thus, the model tracks the level of LIN-12 complexes with its ligands as a lumped measure of lateral signaling as follows:
( )
( )
(
)
( )
2 3
2
* *
i 1 i 1
i * i 1 i 1
i i i * * 2
2 i 1 i 1
i 1 i 1
mpk mpk
lat
lat mpk lat
t mpk mpk
ind
n n x x
M
d
k k k k
d K ν ν ν ν + − + − + − + − + − ⎛ ⎞ + ⎜ ⎟ ⎝ ⎠ = − − + ⎛ ⎞ +⎜ + ⎟ ⎝ ⎠ , (2.2)
where kn+ and kn− are the constitutive rate constants of lateral signal generation and
degradation,
2 x
k is the rate constant for MPK-1*-mediated downregulation of lateral
signaling by enhanced endocytosis of LIN-12, kx3 is the rate constant for lateral signal
transmission into cell i by its neighbors, and KMind represents the width of the Hill
30
number of neighbors for cell i−1 and i+1, respectively. For a linear array, the value of υi
is either 1 or 2. In Equation 2.1 and Equation 2.2, we have assumed that transcriptional regulation occurs in a cooperative manner with a Hill coefficient (ηH) of 2; however,
eliminating this cooperativity (ηH = 1) does not affect the trends predicted by the model.
It is meaningful to introduce the following substitutions:
(
)
3 2
*
i i i
T m
T T
Ind mpk lat
, , , Ph ,
Ind mpk / mpk
i i i m
x x
I m l k t
k k τ
−
= = = = (2.3)
where Ind is the maximum number of morphogen:morphogen-receptor complexes per m
cell, mpkT is the total number of MPK-1 molecules per cell, and t is dimensional time.
Incorporating these substitutions in Equation 2.1 and Equation 2.2 yields the following differential equations:
(
)
2 2 22
1 1
1 1
1 1
2
2 1 1
1 1
1 ,
,
i i
i i i i
l i
i i
i i
i
s d i i i
i i
m
i i
dm l
I m m m
d l
m m
dl
l m l
d m m
μ χ
τ κ
ν ν
λ λ ψ ψ
τ κ ν ν + − + − − − + − + − = − − − + ⎛ ⎞ + ⎜ ⎟ ⎝ ⎠ = − − + ⎛ ⎞ +⎜ + ⎟ ⎝ ⎠ (2.4)
where the dimensionless parameters μ, χ, κMlat, κMind, λs, λd, and ψ are defined as
follows:
(
)
(
(
)
)
(
)
(
)
(
)
(
)
(
)
(
)
3 2 1 3 2 2 TT T T
T
T T T
m
T
/ / mpk
, , ,
Ph Ph / mpk
Ph
, , ,
mpk Ph mpk
Ind . Ph
lat
ind
n x x M
x
s l
m m x x
M m n d m x m m m
k k k K
k
k k k k
K
k k
k k
k k
χ λ κ
ψ λ κ
31
Two dimensionless groups of particular importance are χ and ψ, which together
offer a gauge of intercellular coupling. The first parameter χ is a ratio of the timescale
for constitutive deactivation of MPK-1* to the time scale of lateral signal-mediated
deactivation of MPK-1*. Large values for χ indicate that constitutive deactivation of MPK-1* occurs much slower than lateral signal-mediated deactivation. For example, a
value of χ = 10 indicates that when lateral signaling is maximal, lateral signal-mediated
deactivation of MPK-1* occurs at a rate that is 10-fold greater than rate of deactivation
mediated constitutive pathways. The second parameter ψ is a ratio of the time scale of MPK-1*-mediated downregulation of lateral signal to the time scale of MPK-1*
deactivation by phosphatases. Thus, large values for ψ imply that a given MPK-1*
molecule is more likely to be deactivated before contributing to the downregulation of
lateral signal. Thus, large ψ indicates that each cell is more susceptible to lateral effects. Reference values for these and other dimensionless parameters were chosen as outlined in Section 2.7.
The outlined mathematical model differs significantly from a recent treatment of this system that employed a state-charts approach [13], wherein the fate of a particular VPC is decided based on the state of its neighbors using fate decision rules. These rules are high-level abstractions of the underlying logic guiding fate determination as outlined in 1989 [14]. Since then, significant advances have been made in our understanding of the intracellular signals occurring in each VPC and the molecular mechanisms by which VPCs are coupled. Our mathematical model encodes explicitly these intracellular
32
the importance of these molecular interactions for spatial patterning of fates during C. elegans vulval development.
The analysis presented in this work focuses on the steady-state behavior of the model. Experiments wherein the anchor cell is ablated at different times during the fate specification process have revealed that fate specification is unaffected if the anchor cell is eliminated after a five-hour window [15, 16]. Analysis of model dynamics shows that the timescale for reaching steady state is less than five hours for reference values of parameters (data not shown). Thus, we proceed under the reasonable assumption that the steady state achieved during this time frame dictates fate specification.
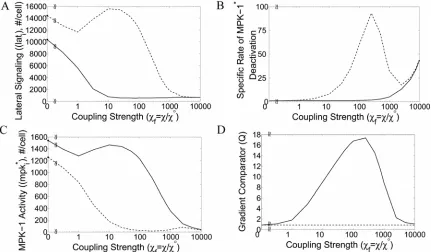
2.4Improved Gradient Perception
Two observations indicate that LIN-3 performs as a prototypical morphogen whose spatial gradient determines cell fate patterning. First, cell fate is sensitive to LIN-3 dose [1]. Second, a gradient in LIN-LIN-3 concentration has been observed indirectly in vivo [2]. These observations raise the question why cells seemingly guided to pattern formation by a morphogen gradient further require a lateral signaling mechanism.
To begin to address this issue, we examined how lateral coupling affects the perception of the extracellular gradient in the inductive signal LIN-3. The response of a simplified, 2-cell system to gradients in LIN-3 concentration was simulated by specifying the amount of inductive signal (I1 and I2) for neighboring cells (1 and 2) (Figure 2.2). To
33
gradient in LIN-3-mediated intracellular MPK signal, we defined a gradient comparator (Q) as:
Q≡d
( )
lnmd
( )
lnI =ln
(
m1/m2)
ln
(
I1/I2)
, (2.6)where m1 and m2 are the steady state fraction of activated MPK-1 in cells 1 and 2,
respectively. Note that Q is undefined when there is no gradient in input (i.e., I1/I2 = 1).
When the relative spatial gradient in LIN-3 translates into exactly the same relative spatial gradient in MPK-1*, the value of Q is one. When the spatial gradient in intracellular signal is attenuated relative to the gradient in extracellular stimulus, the value of Q is less than one; in contrast, when the MPK-1* gradient is amplified relative to the extracellular LIN-3 gradient, the value of Q is greater than one.
In the absence of lateral coupling (i.e., χ =0) between neighboring cells, the
gradient comparator (QD) is given by:
⎟⎟ ⎠ ⎞ ⎜⎜ ⎝ ⎛ ⎟⎟ ⎠ ⎞ ⎜⎜ ⎝ ⎛ + + − = 2 1 2 1 ln 1 1 ln 1 I I I I Q μ μ
D . (2.7)
This expression reveals two regimes of perceiving gradients in inductive signal.
For sufficiently low I1 and I2 (specifically, 1 1
− <<μ
I and 1
2 − <<μ
I ), the value of D Q is
nearly one. Thus, in this input domain, a gradient in extracellular signal is converted to a near equivalent gradient in intracellular signal. For relatively higher values ofI1and I2,
QD
decreases below one, indicating that a gradient in extracellular signal is converted into
34
regimes of gradient perception in an uncoupled system. For I1 = 10−1 and I2 = 10−2 with
0.05
μ−1 = , D
Q is approximately 0.61, indicating that a 10-fold difference in input
produces only a 4-fold difference in intracellular signal. Even significant differences in extracellular input result in considerably milder differences in intracellular signal, suggesting that establishing steep gradients in extracellular signal may be an inadequate mechanism for assuring distinct cell fate choices in an uncoupled system.
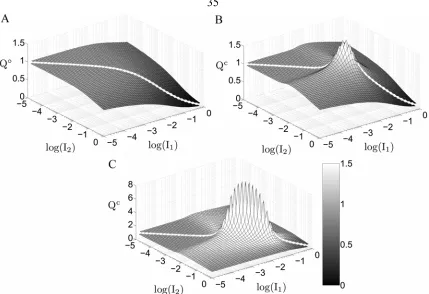
In contrast, a system coupled by lateral signaling displays gradient amplification. The value of the gradient comparator for a coupled system (Qc) exceeds one in a
subdomain of inductive signals (Figure 2.3B). In this region, a gradient in extracellular signal is amplified to produce a steeper gradient in intracellular MPK-1* signal. For example, maximum gradient amplification occurs at I1 = 0.0091 and I2 = 0.0072
(equivalent to 910 and 720 LIN-3:LET-23 complexes per cell, respectively). For this combination of inductive signals, the value of Qc is 1.8, indicating that the ~30% difference in inductive signal is magnified to ~50% difference in intracellular MPK-1* activity between neighboring cells. For low to moderate coupling, an increase in the strength of coupling further enhances the extent of gradient amplification (Figure 2.3C). For the aforementioned combination of inductive signals, Qc improves to 9.0 when the value of χ is increased 10-fold, corresponding to a ~725% disparity in intracellular