https://doi.org/10.5194/hess-22-871-2018 © Author(s) 2018. This work is distributed under the Creative Commons Attribution 4.0 License.
State updating and calibration period selection to improve dynamic
monthly streamflow forecasts for an environmental
flow management application
Matthew S. Gibbs1,2, David McInerney1, Greer Humphrey1, Mark A. Thyer1, Holger R. Maier1, Graeme C. Dandy1, and Dmitri Kavetski1
1School of Civil, Environmental and Mining Engineering, The University of Adelaide, North Terrace, Adelaide, South Australia, 5005, Australia
2Department of Environment, Water and Natural Resources, Government of South Australia, P.O. Box 1047, Adelaide, 5000, Australia
Correspondence:Matthew S. Gibbs ([email protected]) Received: 30 June 2017 – Discussion started: 12 July 2017
Revised: 17 November 2017 – Accepted: 11 December 2017 – Published: 1 February 2018
Abstract.Monthly to seasonal streamflow forecasts provide useful information for a range of water resource manage-ment and planning applications. This work focuses on im-proving such forecasts by considering the following two as-pects: (1) state updating to force the models to match ob-servations from the start of the forecast period, and (2) se-lection of a shorter calibration period that is more represen-tative of the forecast period, compared to a longer calibra-tion period tradicalibra-tionally used. The analysis is undertaken in the context of using streamflow forecasts for environmental flow water management of an open channel drainage net-work in southern Australia. Forecasts of monthly streamflow are obtained using a conceptual rainfall–runoff model com-bined with a post-processor error model for uncertainty anal-ysis. This model set-up is applied to two catchments, one with stronger evidence of non-stationarity than the other. A range of metrics are used to assess different aspects of pre-dictive performance, including reliability, sharpness, bias and accuracy. The results indicate that, for most scenarios and metrics, state updating improves predictive performance for both observed rainfall and forecast rainfall sources. Using the shorter calibration period also improves predictive perfor-mance, particularly for the catchment with stronger evidence of non-stationarity. The results highlight that a traditional ap-proach of using a long calibration period can degrade predic-tive performance when there is evidence of non-stationarity. The techniques presented can form the basis for operational
monthly streamflow forecasting systems and provide support for environmental decision-making.
1 Introduction
Predictions of streamflow a month or a season ahead are es-sential information required by water resource managers for subsequent planning (Wang et al., 2011). This is particularly true in unregulated catchments with no capacity for storage and a highly variable flow regime that can be difficult to pre-dict from historical data. A number of approaches have been developed to provide streamflow predictions with lead times from a month to a season ahead. These include “dynamic” hydrological modelling approaches (Demargne et al., 2014; Wood and Schaake, 2008), statistical approaches (Bennett et al., 2014; Robertson and Wang, 2013), or a combination of the two (Robertson et al., 2013).
(1) the ability of the hydrological model to predict stream-flow with actual forcings; (2) the accuracy of the assumed initial conditions (e.g. soil moisture stores); and (3) the accu-racy of the forecasts of the climate inputs. The focus of this paper is on the first two factors, in the context of a user need for monthly streamflow forecasts to support environmental management and decision-making.
Conceptual rainfall–runoff (CRR) models are widely used to simulate streamflow, due to their simplicity and accuracy (Li et al., 2015a; Tuteja et al., 2011). The parameters of these models have a limited relationship with measurable catch-ment attributes (e.g. soil horizon depth; Fenicia et al., 2014), and typically require calibration to observed streamflow data (noting that physical models also require some calibration; Mount et al., 2016; Pappenberger and Beven, 2006). The use of long calibration periods assumes time-invariant catchment characteristics and processes, and that the parameter values derived from the calibration period are representative of the prediction period (Vaze et al., 2010). It is generally consid-ered that longer calibration periods produce more robust pa-rameter estimates, as a longer period exposes the model to a more diverse range of catchment conditions and flow events (Wu et al., 2013); however, this is not always the case (for example, Brigode et al., 2013).
The assumption that parameters are constant in time can result in decreased model performance if the conditions en-countered in the forecast period are different from those in the calibration period (Bowden et al., 2012; Coron et al., 2012). In this work, the term “non-stationary” is used to refer to situations where physical changes are expected to have oc-curred in a catchment, and where there is evidence to reject the hypothesis of stationarity. In practice, catchments may have different “degrees” of non-stationarity, depending on the evidence available to reject the hypothesis of stationarity, the degree of change in a catchment, and the timescales over which the changes take place. Examples of catchment non-stationarity that can be expected to change the rainfall–runoff relationship include changes in land use or land cover (e.g. deforestation, urbanisation), land drainage, interception (e.g. dams, diversions), groundwater abstractions or responses to changes in climate (Milly et al., 2015). This definition of catchment non-stationarity can be contrasted to a broader definition of “hydrological model non-stationarity”, which refers to temporal changes in hydrological model parameters for any reason (e.g. systematic data errors, poor calibration procedures, model structural deficiencies); see, for example, Westra et al. (2014).
The degradation in model predictive performance due to catchment non-stationarity can impact on the decisions in-formed by these forecasts. To address this concern, a number of studies have calibrated model parameters to subsets of the available data, by attempting to find periods in the historical record that are analogous to conditions expected in the pre-diction time period, and by tailoring the time period selection to compensate for deficiencies in the model structure or
in-put data (Brigode et al., 2013; de Vos et al., 2010; Luo et al., 2012; Vaze et al., 2010; Wu et al., 2013; Zhang et al., 2011). Often there is a trade-off between the benefits of a longer cal-ibration period, which exposes the model to a more diverse range of conditions and tends to improve parameter identi-fiability, versus the benefits of a shorter calibration period, which exposes the model to the most recent – and hence often the most relevant – dynamics in the catchment. Demonstrat-ing and understandDemonstrat-ing the impact of this trade-off on model predictive performance is a key research gap pursued in this study.
Predictive uncertainty quantification is another major as-pect of practical streamflow prediction. Many approaches are available to quantify predictive uncertainty, from approaches that identify a range of model parameters that represent the behaviour of the catchment using approaches such as gener-alised likelihood uncertainty estimation (GLUE; Beven and Binley, 1992), to post-processor approaches (e.g. Krzyszto-fowicz and Maranzano, 2004) and disaggregation approaches that attempt to characterise each individual source of error explicitly (e.g. Kavetski et al., 2003; Vrugt et al., 2005). In this work, predictive uncertainty is estimated using an aggre-gated post-processor residual error model. The residual error model represents the differences between the hydrological model predictions and observed data, without trying to iden-tify the contributing sources (Evin et al., 2014). The post-processor approach is chosen because it can lead to more robust estimates of predictive uncertainty compared to joint calibration of all parameters (i.e. estimating CRR model and error model parameters concurrently; Evin et al., 2014).
Much of the skill in seasonal streamflow forecasts over pe-riods following rainy seasons is commonly attributed to ac-curately representing initial catchment conditions (Koster et al., 2010; Pagano et al., 2004; Wang et al., 2009). In contrast, forecast skill over periods following dry seasons is gener-ally attributed to both initial catchment conditions and me-teorological inputs (Maurer and Lettenmaier, 2003; Wood and Lettenmaier, 2008). The impact of the initial catchment conditions is particularly pronounced when forecasting over short lead times, typically up to 1 month (Li et al., 2009; Wang et al., 2011), although this time frame is generally catchment-dependent.
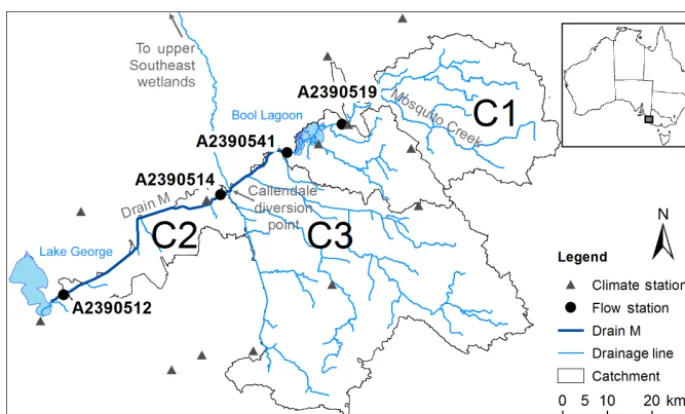
differ-Figure 1.Map of the case study region, in southern Australia.
ent updating approaches for the GRP model, a CRR model commonly used in short-term streamflow forecasting appli-cations in France.
Updating the states of conceptual rainfall–runoff models is not straightforward, as any environmental model is at best an approximate representation of the real catchment (Berthet et al., 2009). A number of observed data sources can be used to update model storages, including observed streamflow and in situ or remotely sensed soil moisture. From these options, Li et al. (2015b) suggest that gauged discharge data assimila-tion is a more effective way to improve short-term forecasts and is still preferred for operational streamflow forecasting purposes.
Studies on observed data assimilation and CRR model state updating have focused primarily on flood forecasting with short lead times. The benefits at longer lead times (e.g. monthly to seasonal) to forecast water availability have re-ceived less attention in the published literature.
1.1 Study aims
This work focuses on determining the degree to which state updating and the selection of calibration period length can enhance monthly streamflow predictions in the context of an environmental flow management application. More specifi-cally, the aims of this study are to
1. evaluate the ability of state updating in a daily CRR model to improve predictive performance when fore-casting streamflow volume for the upcoming month; and
2. assess the degree to which using a shorter calibration period that is more representative of the forecast period
can improve predictive performance, in particular when there is evidence of catchment non-stationarity. The paper is organised as follows. Section 2 outlines the user need for monthly forecasts to manage a drainage network for environmental and social outcomes in southern Australia, and describes the case study catchments and data available. Section 3 describes the model set-up and forecasting frame-work, as well as the methodology designed to achieve the aims above. Sections 4 and 5 present and discuss the case study results, and Sect. 6 summarises the key conclusions.
2 Environmental flow management case study 2.1 Catchment location and characteristics
[image:3.612.128.471.63.270.2]Figure 2.Variability in monthly runoff in Drain M at the location at flow station A2390512.
The streamflow in the case study region is seasonal to ephemeral, with very low flow over the summer and autumn months (Fig. 2). Runoff coefficients are low, with annual runoff in the range of 0.01–0.1 of annual rainfall (Gibbs et al., 2012). The predominant land use in the region is dry land pasture with some flood irrigation as well as planta-tion forestry; there is no major urbanisaplanta-tion in the catch-ments. The topography of the region is very flat, with main-stream slopes of the order of 0.005. The hydrogeology of the catchment includes shallow aquifers with major kars-tification of limestone, which may be suggestive of non-conservative catchments with appreciable groundwater ex-changes across their boundaries.
Mosquito Creek flows into Bool Lagoon (catchment C1 in Fig. 1, area 1002 km2). Drain M commences at the out-let of Bool Lagoon, and a large catchment flows into Drain M between Bool Lagoon and a diversion point at Callendale (catchment C3 with an area of 2200 km2). Finally, the Drain M local catchment contributes flow downstream of the Cal-lendale diversion point, flowing into Lake George (catchment C2, area 383 km2).
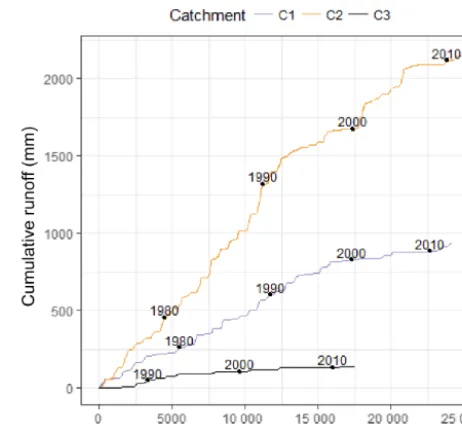
In the region where the case study catchments are located, plantation forestry expanded substantially in the late 1990s. Changes in the relationship between rainfall and runoff also occurred during this period, evidenced by the reduced slope in the plot of cumulative runoff against cumulative rainfall (double-mass analysis) in Fig. 3 (Searcy et al., 1960; Yihdego and Webb, 2013). The runoff ratio in catchment C1 is ap-proximately 0.045 before year 2000, but reduces by 70 % to 0.013 after 2000. The runoff ratio in catchment C2 is around 0.088 before year 2000, but reduces by 30 % to 0.061 after 2000. This comparison provides stronger evidence of non-stationarity in catchment C1 than in catchment C2. Other studies have also investigated the link between changes in the hydrology and changes in land use in the region (Avey and Harvey, 2014; Brookes et al., 2017). These changes have implications for the choice of calibration data period, as data
Figure 3.Double mass plot of the rainfall–runoff data in the three main catchments contributing to Drain M. It can be seen that (1) the volume of runoff for the same volume of rainfall has reduced in the latter decade, and (2) very little runoff is generated from catchment C3.
from the 1970s may not be representative of hydrological conditions in the 2000s.
It is evident from Fig. 3 that catchment C3, despite hav-ing the largest catchment area (2200 km2)of the three catch-ments, generates very little runoff. This behaviour is due to a number of factors, including the very flat terrain and de-pression storage, substantial vegetation cover (both planta-tion and natural) and irrigaplanta-tion extracplanta-tions from the shal-low underlying aquifer. Given its limited streamfshal-low volume, catchment C3 is excluded from further analysis in this study. From a practical perspective, it is assumed that in the years where there is substantial yield from this catchment there will already be surplus flow from the upstream catchments. 2.2 Management issues
Drain M serves multiple competing demands on the water resources available in this catchment system. These demands influence the decision to use the regulators along the system. a. Bool Lagoon has water requirements that influence
re-leases from the lagoon into Drain M.
b. Lake George has water requirements to maintain the es-tuarine ecology of the lake, and to support its signif-icance as a biological resource and as a resource for recreational fishing.
[image:4.612.58.277.65.210.2]recruitment). However, high flows may impact on sea grasses, due to their low salinity and high nutrient load. d. The wetlands of the upper south-east to the north typ-ically benefit from as much water as possible from the Drain M system.
Decisions to undertake diversions from Drain M must be made throughout the year (mainly in the high-flow sea-son from late winter and throughout spring). It is expected that forecasts of future flows at key locations will assist in maximising the environmental and social outcomes achieved from the available water. Forecasts of monthly volume with a lead time of 1 month ahead are considered most appropri-ate for this application, because (1) the main quantities of interest in this application are volume and the overall water balance, rather than the size or timing of daily peak flows, and (2) a 1-month lead time provides sufficient time to un-dertake any changes in diversions to satisfy the competing demands on the system.
2.3 Climate data
The mean annual rainfall for the region varies from 600 mm in the north to 675 mm in the south. The mean annual FAO56 potential evapotranspiration (PET; Allen et al., 1998) is ap-proximately 1000 mm. The highest rainfalls are experienced in the winter months, with rainfall exceeding evapotranspi-ration in May–September. The SILO Patched Point Dataset (Jeffrey et al., 2001) was used for the observed rainfall and the FAO56 evapotranspiration data were adopted, with the climate stations used shown in Fig. 1. Time series of rainfall and evapotranspiration in each catchment were obtained us-ing a Thiessen polygon approach. This weightus-ing approach is considered appropriate for the region, due to the flat ter-rain being unlikely to lead to significant topographic effects on the spatial distribution of rainfall.
Rainfall forecasts from the Australian Bureau of Meteorol-ogy’s seasonal forecast system, POAMA-2 (Hudson et al., 2011), were used. POAMA-2 is a dynamical climate fore-casting system designed to produce multi-week to seasonal forecasts of climate for Australia based on a coupled ocean– atmosphere model and ocean–atmosphere–land observation assimilation systems. In this paper, we use a 30-member en-semble of monthly/multi-week forecasts from version 2.4 of POAMA-2. POAMA-2 predictions have a coarse spatial res-olution (∼250 km), which does not capture the spatial vari-ability in catchment-scale rainfall. For the purposes of this application, the POAMA-2 rainfall hindcasts (i.e. forecasts developed by applying the modelling system to the historical period) at the relevant pixel were downscaled to each climate station in the study region (Fig. 1) using the statistical down-scaling method detailed in Shao and Li (2013). Further de-tails of the downscaling approach are provided in Humphrey et al. (2016).
2.4 Streamflow data
Daily streamflow data are available from the South Aus-tralian Department of Environment, Water and Natural Re-sources Surface Water Archive (https://www.waterconnect. sa.gov.au/Systems/swd), with the flow stations used shown in Fig. 1. Three of the flow stations have data available from the early 1970s, with the exception being the station at the out-let of Bool Lagoon (site A2390541), where data were avail-able from 1985. Travel times along Drain M between flow stations are typically less than 1 day. To determine the flow generated within catchment C2, the daily flows recorded at upstream flow station A2390514 were subtracted from down-stream flow station A2390512.
The identification of high-quality data is important be-cause biases and systematic changes in the measurement of hydrological data can significantly affect model calibration and lead to non-stationarity in the estimated model param-eters (Westra et al., 2014). Analysis of the data and moni-toring stations suggested that streamflow data uncertainty is expected to be low, given the regular cross sections of the weirs used for monitoring stage and upstream drains, and the high number of gaugings (between 78 and 166 flow gaugings at each flow station) available to develop stage–discharge re-lationships.
3 Methodology 3.1 CRR model
The GR4J model (Perrin et al., 2003) is a parsimonious daily CRR model, selected for this study because it explicitly ac-counts for non-conservative (or “leaky”) catchments (rele-vant for the study area; see Sect. 2.1) and has demonstrated good performance for Australian conditions (Coron et al., 2012; Guo et al., 2017; Westra et al., 2014). The standard form of the GR4J model has four calibration parameters: the maximum capacity of a production (soil) store,X1, a catch-ment water exchange coefficient,X2, the maximum capacity of a routing store,X3, and a time base for a unit hydrograph,
X4. Further details of the model structure and parameters can be found in Perrin et al. (2003).
Note that the catchments considered have a relatively slow streamflow response. Consequently, the pre-specified split to the routing store of 0.9 in the original specification of the GR4J model may be too low for these catchments. To mit-igate this potential deficiency, we have modified the GR4J model so that the split between the routing store and the di-rect runoff is included as an explicit calibration parameter termedsplit.
3.2 Parameter estimation
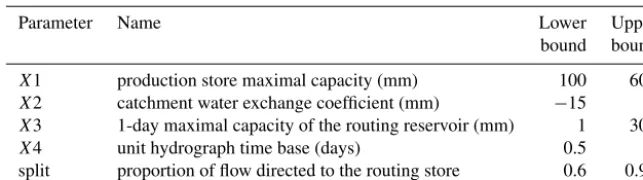
Table 1.Bounds adopted for the uniform prior distribution on the GR4J parameters.
Parameter Name Lower Upper bound bound
X1 production store maximal capacity (mm) 100 600
X2 catchment water exchange coefficient (mm) −15 5
X3 1-day maximal capacity of the routing reservoir (mm) 1 300
X4 unit hydrograph time base (days) 0.5 6 split proportion of flow directed to the routing store 0.6 0.99
daily observed streamflow data eq and climate data X,
p(θ|
eqX), is given by
p(θ|
eq,X)∝p(eq,|θX) p(θ ), (1)
wherep(θ )is the prior distribution andp (eq|θ,X)is the like-lihood function.
A standard least squares likelihood function is adopted (see, for example, Thyer et al., 2009), which is derived from a residual error model that assumes independent, homoscedas-tic residuals. This likelihood function is adopted for the cali-bration of the daily hydrological model because it provides a better fit to the high daily flows (Wright et al., 2015), which make an important contribution to monthly volumes of inter-est in our study. Uniform prior distributions are used for all parameters, with bounds given in Table 1.
The posterior distribution in Eq. (1) is sampled using the DiffeRential Evolution Adaptive Metropolis (DREAM) al-gorithm (Vrugt et al., 2009). The sampled parameter sets are then used to approximate the posterior parameter distribu-tion for a given calibradistribu-tion period. Computadistribu-tions were car-ried out using the Hydromad R package implementation of the DREAM algorithm and the GR4J model (Andrews et al., 2011). A total of 25 000 iterations of the DREAM algorithm were carried out, including a “burn-in” period of 6250 iter-ations to allow the Markov chain to stabilise. The number of parallel chains was set equal to the number of parameters (Vrugt et al., 2009), which, for the modified GR4J model used in this work (Sect. 3.1), led to five parallel chains being used.
The posterior distributions obtained for different calibra-tion time periods are investigated for evidence of trends and changes over time. For the purposes of developing streamflow predictions using the post-processing approach (Sect. 3.5), only the single parameter set resulting in the max-imum posterior probability is used.
3.3 Calibration approach
A rolling calibration approach is used to account for the im-pact of non-stationarity on the inferred CRR model param-eters. This rolling calibration approach is similar to the ap-proach used by Luo et al. (2012) and Wagener et al. (2003). It consists of choosing a calibration length and then moving
it forward year by year, while recalibrating the model pa-rameters to each such calibration “window”. The calibrated parameter values are used to simulate the following 1 year of data, before recalibrating the model and repeating the pro-cess. This methodology allows the identification of changes in parameter distributions over time, without the need to identify specific periods when changes in the rainfall–runoff response may have occurred.
Calibration period lengths of CPL=10 and CPL=20 years are considered, to assess the trade-off between using a longer calibration period to expose the model to more diverse catchment conditions and improve parameter identifiability, versus using a shorter calibra-tion period length to expose the model to more recent hydrological dynamics.
As an example, consider a 10-year calibration period from 1 May 1995 to 30 April 2005, after a 1-year warm-up period. Predictions are computed for the following 1-year “predic-tion period”, i.e. 1 May 2005 to 30 April 2006. The process is then repeated each year, i.e. the next calibration period is 1 May 1996 to 30 April 2006, and the calibrated model is used to predict the period 1 May 2006 to 30 April 2007. The start-ing month of May corresponds to the start of the flow season (Fig. 2).
3.4 State updating in GR4J
The approach used for the state updating of GR4J is simi-lar to the approach of Crochemore et al. (2016) and Demirel et al. (2013). State updating is set to take place at the start of each month within the 1-year prediction period, using the observed streamflow at the start of each month. GR4J has two stores, namely the production store and the routing store. Following the procedure of Demirel et al. (2013), the rout-ing store level is updated such that the GR4J simulation of streamflow matches the observed flow. This procedure is un-dertaken after accounting for the modelled direct flow from the production store (Demirel et al., 2013).
from the routing store,qt,rθ ,
qtθ=qt,dθ +qt,rθ . (2)
Letqt,rSUdenote the flow from the routing store that yieldsqtθ
equal to the observed flowqet. This quantity is calculated as
qt,rSU=max(qet−qt,dθ ,0). (3)
The routing store level, R, can then be obtained by set-tingqt,rθ =qt,rSU, and solving (using the bisection method) the equation used by the GR4J model to calculate the outflow from this storage:
qt,rθ =R
1− 1+ R
X3
4!−1/4
. (4) Equations (2)–(4) can be used to updateRgiven the observed streamflowqet.
3.5 Estimation of predictive uncertainty
The monthly streamflow forecasts are obtained by aggregat-ing the daily GR4J simulations. In order to quantify predic-tive uncertainty using a residual error model, the monthly ag-gregated GR4J simulations, Qθ, are compared to observed monthly streamflow volumes, Qe. The quantification of er-ror is based on residual erer-rors, defined by the differences between observed and simulated monthly streamflow. Sep-arate error models are estimated for the GR4J predictions for each catchment and for each type of forcing data (observed or forecast rainfall), as follows.
When observed rainfall is used as input to GR4J, the daily streamflow time series simulated using GR4J are aggregated to produce monthly time series of hydrological model pre-dictions,Qθ.
When forecast rainfall is used as input to GR4J, an ensem-ble of daily streamflow forecasts is produced (with a single GR4J streamflow time series per rainfall forecast time se-ries). Each such “individual” daily GR4J time series is then aggregated to a monthly time step. The time series Qθ is constructed from the time series of medians of the individ-ual monthly streamflow time series. Although the use of ag-gregation approaches for single-valued streamflow forecast from ensemble predictions has been seen in operational ap-plications (see, for example, Lerat et al., 2015), we note that this approach may result in some information loss.
The heteroscedasticity (i.e. larger residuals for larger flows) and skewness of forecast errors is accounted for using the Box–Cox transformation, by defining normalised residu-als as
ηt =Z Qet−Z Qθt
(5) where
Z(Q;λ, A)=
(Q+A)λ−1
λ ifλ6=0
log(Q+A) otherwise
(6)
with a transformation parameterλand an offset parameterA
(often important when transforming low flows).
λ=0.5 was used, as this setting was shown to produce good predictive performance (especially in terms of sharp-ness and bias) in ephemeral catchments by McInerney et al. (2017). The offset is set asA=1×10⁻⁵mm month−1.
The normalised residualsηt in Eq. (7) are assumed to be Gaussian with meanµηand varianceση2, i.e.
ηt ∼N (µη, ση2). (7)
The parametersµη andση are estimated using the method of moments, i.e. as the sample mean and sample standard deviation of the time series ofη. The same rolling calibration approach outlined in Sect. 3.3 for the GR4J model is also applied for the calibration of the post-processor error models. Once the residual error model is calibrated, replicates from the predictive distribution,Q(r)forr=1. . .Nr, can be gen-erated for any time period of interest, as follows.
1. Sample the normalised residual at time step
t, ηt(r)←N (µη, ση2). (8)
2. Rearrange Eq. (6) to yield
Q(r)t =Z−1Z Qθt+η(r)t . (9)
3. Truncate negative values to zero.
Equations (5)–(8) are used to generate replicates from the predictive distribution (PD) of the forecasts for each month (Qt).
The assumptions of the post-processor residual error model used to estimate predictive uncertainty for monthly volumes are different to the assumptions of the residual er-ror model used in the likelihood function for calibrating the daily GR4J model. As outlined in Sect. 3.2, the GR4J model is calibrated at the daily scale to observed streamflow using the standard least squares likelihood function, because it bet-ter captures the high daily flows, important for estimating the monthly volumes. The post-processing error model for the monthly volumes is designed to capture the predictive uncertainty in these monthly volumes, in particular the het-eroscedasticity and skew of the residuals (McInerney et al., 2017; Refsgaard, 1997). These choices of residual error mod-els at the daily and monthly timescales contribute to the study objectives of reliable forecasts at the monthly timescale (see another example in Lerat et al., 2015).
3.6 Model configurations and implementation
cases are considered for each model configuration, given by the combinations of two catchments (C1 and C2) and two sources of climate data (observed and forecast). This results in a total of 16 scenarios considered.
Twelve sets of 1-month ahead predictions are generated during the 1-year prediction period. For all scenarios, ob-served rainfall is used as input to the hydrological model prior to the start of each set of 1-month ahead predictions. When state updating is used, the GR4J state is updated at the start of this month using the procedure outlined in Sect. 3.4. During the 1-month ahead predictions, either observed or forecast rainfall is used, depending on the scenario consid-ered.
3.7 Performance metrics
Five metrics are used to evaluate distinct aspects of predictive performance. All metrics are calculated on the accumulated 1-year prediction period following each rolling calibration period. These include metrics for reliability, sharpness, volu-metric bias, the cumulative ranked probability score (CRPS) and the Nash–Sutcliffe efficiency (NSE).
Reliability refers to the degree to which the observations (of streamflow) over a series of time steps can be considered to be statistically consistent with the predictive distribution. In this work, reliability is assessed using predictive quantile– quantile (PQQ) plots, and quantified using the reliability met-ric of Renard et al. (2010) based on the area between the PQQ plot and the 1:1 line. A value of 0 represents perfect relia-bility, while a value of 1 represents the worst reliarelia-bility, i.e. all observations lying outside (above or below) the PD.
Sharpnessrefers to the width of the predictive distribution, and can otherwise be known as “resolution” or “precision”. Typically, sharpness is determined using the predicted val-ues only. In this work a measure of sharpness (as the sum of the standard deviation of the predictions each time step) is normalised by the sum of the observed values, to enable a comparison of this metric across catchments with different magnitudes of flow. As such, sharpness is quantified using the following metric from McInerney et al. (2017):
SharpnessNorm= N X
t=1
sdev Qt
/
N X t=1
e
Qt, (10)
where N is the number of months and sdev is the sam-ple standard deviation, Qt is the predictive distribution of streamflow for month t, andQet is the observed streamflow for this month (as described in Sect. 3.5).
Volumetric biasmeasures the overall water balance error of the predictions relative to the observations. It is calculated as VolBias= N P t=1
mean(Qt)− N P t=1
e
Qt
N P t=1
e Qt , (11)
where mean is the sample mean.
CRPSis a widely used probabilistic performance metric that combines in a single measure multiple aspects of pre-dictive performance, including reliability, sharpness and bias (Hersbach, 2000). The CRPS is calculated by comparing the cumulative distribution of the predictions with the cumula-tive distribution of the observation at each time step. At a single time step, the CRPS is defined as
CRPS= ∞ Z
−∞
Fp,t(Q)−Fo,t(Q) 2
dQ, (12)
whereFp,t andFo,t are the cumulative distributions of the streamflow predictions (Qt)and observation (Qet), at time stept. The average value of the CRPS is then calculated over all time stepst. Note that the cumulative distribution of the observations is a step function. A CRPS of 0 corresponds to the perfect prediction, while larger CRPS values correspond to worse performance.
To normalise CRPS metric values across catchments, the CRPS metric for the predictions (CRPSP)is expressed as a skill score with respect to the CRPS metric of a “reference” distribution for that catchment (CRPSR):
CRPSSS=
CRPSR−CRPSP
CRPSR . (13)
CRPSSSvalues below 0 indicate forecasts with worse perfor-mance than the reference distribution, a CRPSSSof 0 corre-sponds to the predictions with the same performance as the reference distribution, and a CRPSSS of 1 corresponds to a perfect prediction.
The reference distribution for each month is calculated as the empirical distribution of all observed data in that month, using the entire set of observed data (including data from the prediction period). This approach provides a stringent base-line for the CRPS normalisation in Eq. (13).
NSEis a commonly used metric for the assessment of the accuracy of deterministic hydrological model predictions, and is calculated as
NSE=1− N P t=1
Qθt −Qet 2
N P t=1
e
Qt−mean(Qe
)2
Table 2.Best and worst values for each predictive performance met-ric across all model configurations. For CRPSSSand NSE, higher
values denote better performance; for the other metrics lower values denote better performance. The values in this table should be inter-preted alongside Fig. 4, where the worst and best values reported here correspond to metric values of 0 and 1, respectively.
Reliability Sharpness Bias CRPSSS NSE
Worst 0.41 2.21 1.49 −0.65 −1.01 Best 0.07 0.45 0.11 0.57 0.88
where Qθt is the monthly aggregated GR4J prediction for montht(as described in Sect. 3.5). The NSE can range from −∞to 1, with NSE=1 corresponding to perfectly accurate predictions of the observed data, and NSE < 0 indicating the observed mean is a better predictor than the model.
To ensure a consistent comparison of multiple model sce-narios, the metrics are computed as follows:
– the same period is used to calculate the metrics in all cases. This period was determined by the availability of the forecast rainfall, from May 2001 to April 2011. – the performance metrics are normalised by linearly
scal-ing the worst value to a value of 0 and the best value to 1:
Mr=
M−Mw
Mb−Mw
, (15)
where the worst and best values for each metric,MwandMb, respectively, are listed in Table 2. The remainder of the pre-sentation, in particular Fig. 4, reports the normalised metrics computed using Eq. (15).
4 Results
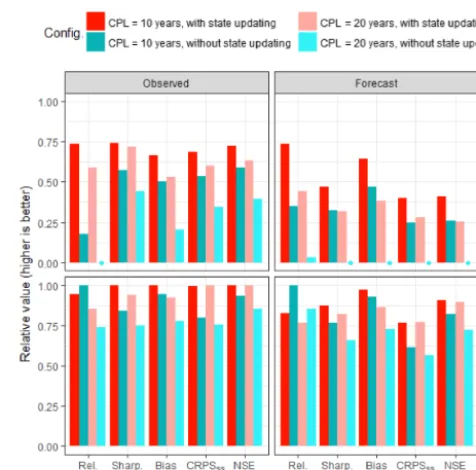
The performance metrics for all model configurations are summarised in Fig. 4. First the predictive performance of model configurations with and without state updating is com-pared (Aim 1), and then the influence of calibration period length in the context of catchment non-stationarity is in-vestigated (Aim 2), considering changes in both the predic-tive performance and changes in CRR parameter values over time.
4.1 Impact of state updating
[image:9.612.49.284.143.186.2]The impact of state updating on predictive performance can be seen in Fig. 4, by comparing the red and blue bars (darker shading indicating results for the 10-year calibration period length, and lighter shading indicating results for the 20-year calibration period length). It is clear that state updating im-proves the sharpness, bias, CRPSSSand NSE metrics.
Figure 4.Predictive performance metrics for the two case study catchments (C1 and C2) and the two sources of rainfall forcing data (observed and forecast). Relative metric values are presented (Sect. 3.7 and Table 2); higher values represent better performance. The impact of state updating can be seen by comparing the red ver-sus blue bars. The change in performance due to different calibra-tion period lengths (CPLs) can be seen by comparing the bars with darker versus lighter shading.
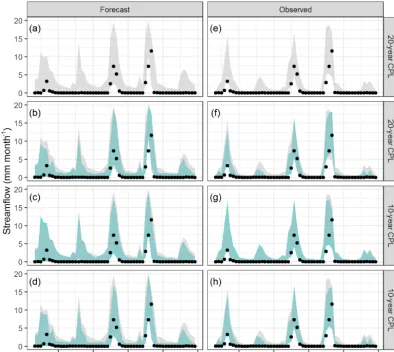
The improvement in predictive performance achieved by state updating to the observed flow data is tentatively at-tributed to being able to correct the model for any system-atic overestimation of simulated streamflow. Consider Figs. 5 and 6, which show the 90th percentile predictive limits for each model configuration, for catchments C1 and C2, respec-tively. The longer 20-year calibration period length without state updating is considered the “typical approach”, and is shown in grey in each panel. A representative time period is shown, with the full time series for each case provided in the Supplement. Figures 5 and 6 show that state updating sharp-ens the predictive limits, especially during low-flow months. For example, this behaviour can be seen for the 20-year CPL by comparing the predictions in panels (a) to (b) for the case of forecast rainfall and the predictions in panels (e) to (f) for the case of observed rainfall.
Figure 5.Representative streamflow time series in catchment C1 obtained using forecast rainfall(a, b, c, d)and observed rainfall(e, f, g, h). The shaded area represents the 90th percentile prediction limits and the black dots the observed values. The “traditional approach” of the 20-year calibration period length (CPL) without state updating is shown in grey in each panel.
4.2 Impact of calibration period length 4.2.1 Differences in predictive distribution
The changes in the predictive distribution due to changes in the calibration period length can be seen in Fig. 4, by com-paring the darker and lighter shades of each colour (darker colour for 10-year calibration period length, lighter colour for 20-year calibration period length). The following findings can be seen.
– When state updating is not used (comparing dark blue versus light blue in Fig. 4), all metrics improved when the shorter 10-year calibration period length was used. – When state updating is used (comparing the dark red
versus light red in Fig. 4), the impact of the shorter 10-year calibration period length depends on the catch-ment. In catchment C1, which provided stronger evi-dence of non-stationarity than catchment C2 (Sect. 2.1), the use of the 10-year calibration period length
im-proves all metrics compared to the use of the 20-year calibration period length. In contrast, in catchment C2, the length of the calibration period had little impact on the NSE and CRPSSSvalues, and only small improve-ments in the reliability, sharpness and bias metrics are obtained when the 10-year period is used.
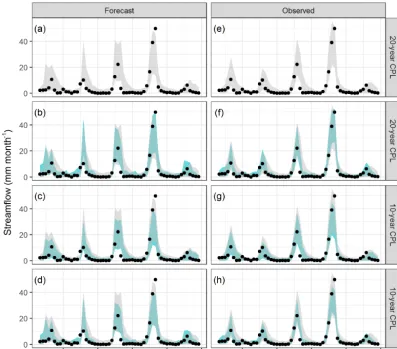
Figure 6.Representative streamflow time series in catchment C2 obtained using forecast rainfall(a, b, c, d)and observed rainfall(e, f, g, h). The shaded area represents the 90th percentile prediction limits and the black dots the observed values. The “traditional approach” of the 20-year calibration period length (CPL) without state updating is shown in grey in each panel.
4.3 Differences in trends in parameter values
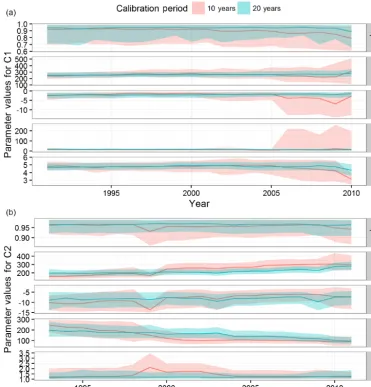
The rolling calibration approach (see Sect. 3.3) enables tem-poral trends in the parameter distributions to be investigated. Figure 8 presents the median and 90th percentile predic-tion limits of these distribupredic-tions for each parameter for each catchment, with the 10-year and 20-year calibration period lengths shown in different colours.
In catchment C1, up until year 2005 (representing mod-els calibrated from 1995 to 2004 for the 10-year calibration period length), the calibration period length has little impact on the median value for each parameter. Slightly wider pa-rameter bounds are obtained when the shorter calibration pe-riod length is used, likely due to the reduced data available to infer representative parameter values. Post-2005, the pa-rameter values obtained using the shorter calibration period length respond to the distinct non-stationarity of the catch-ment discussed in Sect. 2.1. The more pronounced negative values of the groundwater exchange coefficientX2 estimated in the 1994–2005 calibration period are consistent with the
reduced runoff ratio in the period post-2000. In contrast, pa-rameter values estimated from the longer calibration period length, which includes data from the 1980s even when pre-dicting the 2000s, do not exhibit this distinct change.
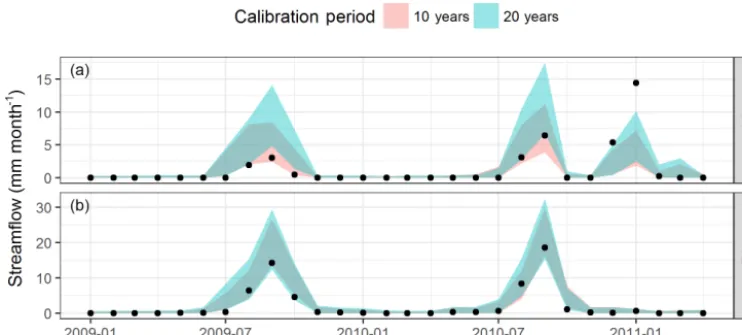
pro-Figure 7.Streamflow predictions for catchments C1(a)and C2(b)for the period 2009–2011 using observed rainfall. The shaded area represents the 90th percentile prediction limits and the black dots the observed values. For catchment C1, using shorter calibration periods (red) can be seen to produce lower streamflow predictions than using longer calibration periods (blue).
duces higher values of X4 and lower values ofX2 and the
splitintroduced in this study (Sect. 3.1). This exception could represent a model fitting anomaly resulting from a shorter calibration period length.
5 Discussion
5.1 Beneficial impact of state updating on forecast performance
Most previous studies have used state updating in a short-term flood forecasting context, and found a limited effect of the initial conditions after a number of days (e.g. Berthet et al., 2009; Randrianasolo et al., 2014; Sun et al., 2017). How-ever, forecasting of flood peak and timing is a different ap-plication to the forecasting of streamflow volumes. A num-ber of data-driven modelling studies have demonstrated that monthly streamflow lagged by 1 month (or more) provided some useful information for forecasting at a 1-month lead time (e.g. Bennett et al., 2014; Humphrey et al., 2016; Yang et al., 2017). This study demonstrates that these benefits also hold when CRR models, rather than data-driven approaches, are used as the forecasting model.
State updating is found to improve predictive performance in both catchments considered, for the majority of the mul-tiple performance metrics considered. State updating is ex-pected to reduce predictive bias, as errors in the simulated streamflow during the warm-up period are corrected at the start of the forecast period. State updating is also expected to increase the sharpness of the predictive distribution, as the range of model predictions is generally tightened by forcing the model to simulate the observed streamflow at the start of the forecast period.
The only metric where state updating did not show an im-provement is for the reliability of predictions for catchment
C2. However, the reliability of all model configurations in this catchment is already relatively high without state updat-ing. All other metrics (sharpness, bias, CRPS and NSE) show improvements from state updating in catchment C2, suggest-ing potential trade-offs in performance, similar to that found by Crochemore et al. (2016) and McInerney et al. (2017). This slight reduction in reliability is not considered to have a significant detrimental impact on the PD produced for this practical application.
5.2 Importance of choosing a calibration period that is representative of current catchment conditions Traditionally, long calibration periods are used to maximise the use of available data and increase parameter identifiabil-ity. The empirical results in this study suggest that the shorter calibration period can provide better (or at least not worse) predictive performance. The reduction in performance seen when the longer calibration period is used is likely due to the calibration data representing catchment conditions that are substantially different to those in the prediction period. For example, when the prediction period is 2009 (as shown for catchment C1 in Fig. 7), a 20-year calibration period length corresponds to the period of 1989–2008, which includes a large portion of the pre-2000 period when catchment C1 dis-played a much higher runoff coefficient (Sect. 2.1). In con-trast, a 10-year calibration period length corresponds to a cal-ibration period of 1999–2008, which is likely to be more rep-resentative of the lower runoff hydrological regime seen in the post-2000 period.
[image:12.612.114.485.67.234.2]Figure 8.Temporal trends in posterior parameter distributions, for catchments C1(a)and C2(b). The median values are shown as the solid lines and the shaded areas represent the 90th percentile prediction limits.
estimates due to fitting only a small number of events and hence being unable to represent the full range of flow condi-tions.
The empirical findings highlight the benefits of identify-ing a calibration period of data that is representative of con-ditions of interest for a given model application, which is a task often overlooked in practical applications. Suitable rep-resentative periods can be identified through techniques such as trend analysis, using knowledge of changes in a catchment (e.g. land use data, abstraction volumes), and testing predic-tive performance for different calibration period lengths (as done in this work). The empirical results indicate that, if the selection of calibration data is poorly implemented, and/or if the modeller naively assumes that longer calibration peri-ods are inherently better for model development, predictive performance can degrade.
5.3 Value of forecasts for improving water management
re-gion, and can make decisions on management changes much earlier in the season.
5.4 Future research work
The enhancements to predictive performance of streamflow forecasts from state updating and a shorter calibration period have been demonstrated on two catchments. These catch-ments were selected based on an established user need for monthly forecasts to improve the water management of a channel drainage system with multiple competing demands. Importantly, the case study catchments in this work are ephemeral and dry, with low runoff ratios. These types of catchments are known to be challenging to model (McIner-ney et al., 2017; Ye et al., 1997). For example, the models predict a streamflow response in 2002 and 2005 in Fig. 5 that did not occur in the observations, even when observed rain-fall and state updating were used. Some of this difference may be due to errors in the input rainfall data, but this re-sult highlights the difficulty in representing streamflow gen-eration in low-yielding, ephemeral catchments, such as those considered. Future work will evaluate the proposed monthly streamflow forecasting techniques over a wider range of catchments and environmental conditions.
6 Conclusions
This work has focused on improving monthly streamflow forecasts by considering two aspects: (1) state updating to force the GR4J hydrological model to match observations from the start of the forecast period, and (2) investigating the trade-offs between using shorter versus longer calibration pe-riods. The analysis was applied to two ephemeral catchments in southern Australia, which are part of a drainage network with competing environmental management demands.
The major findings from the empirical analysis are as fol-lows.
1. State updating improves predictive performance in the case study catchments, for the majority of the multi-ple performance metrics considered. Previous studies focusing on the forecasting of flood peak and timing have typically found a limited effect of initial condi-tions on predictive performance after a number of days. This study demonstrates that, when forecasting stream-flow volumes, using state updating to more accurately represent initial conditions can have a benefit even at a 1-month lead time.
2. The length of the calibration period has a major im-pact on the predictive performance of a hydrological model. In the case study catchments, the shorter calibra-tion period typically improves predictive performance, especially in the case study catchment with stronger ev-idence of non-stationarity. The benefits of a shorter cal-ibration length appear contrary to the standard approach
of using as much data as possible for model calibration. The reduction in performance for the longer calibration period is likely due to the model being calibrated to data that represent higher-yielding conditions from the past which no longer hold true in the forecast period. This finding highlights that identifying a data set that is rep-resentative of the forecast period, through trend analy-sis and other knowledge of a catchment, is an impor-tant step in model development. If this step is ignored, and it is naively assumed that longer calibration data are inherently better for model development, all aspects of predictive performance may suffer.
The conclusions of this empirical study are limited by the small number of catchments and single hydrological model used. Further work will consider a larger sample of catch-ments and a wider range of hydrological model structures. In general, we expect the techniques of state updating, post-processing uncertainty estimation, and usage of shorter cali-bration period length representative of future forecast condi-tions to be of value to hydrologists and environmental mod-ellers seeking to improve the predictive performance of their modelling systems.
Data availability. The flow data used in this paper are avail-able from the South Australian Department for Environment, Wa-ter and Natural Resources Surface WaWa-ter Archive (https://www. waterconnect.sa.gov.au/Systems/swd). The climate data used in this paper are available from the Queensland Department of Science, In-formation Technology, Innovation and the Arts SILO climate data archive (https://www.longpaddock.qld.gov.au/silo/). Access to fore-cast climate data from the POAMA-2 model was provided by the Bureau of Meteorology (http://poama.bom.gov.au/).
Supplement. The supplement related to this article is available online at: https://doi.org/10.5194/hess-22-871-2018-supplement.
Author contributions. MG performed the analysis and produced the manuscript, with contributions from all co-authors. HM and GD assisted with the design of the project. DM undertook the post-processor error modelling and analysis, with help from MT and DK. GH implemented the climate model forecast downscaling to gener-ate the inputs for the hydrological models.
Competing interests. The authors declare that they have no conflict of interest.
Acknowledgements. Matthew S. Gibbs and Greer Humphrey were supported by the Goyder Institute for Water Research, project E.2.4. David McInerney was supported by Australian Research Council grant LP140100978 with the Australian Bureau of Mete-orology and South East Queensland Water. Input from South East Water Conservation and Drainage Board staff, in particular Senior Environmental Officer, Mark DeJong, is gratefully acknowledged. The authors would like to thank the three anonymous reviewers for their comments and suggestions, which improved the clarity and contribution of the manuscript.
Edited by: Maria-Helena Ramos Reviewed by: three anonymous referees
References
Allen, R. G., Pereira, L. S., Raes, D., and Smith, M.: Crop evapotranspiration-Guidelines for computing crop water require-ments, FAO, RomeFAO Irrigation and drainage paper 56, 300 pp., 1998.
Andrews, F. T., Croke, B. F. W., and Jakeman, A. J.: An open soft-ware environment for hydrological model assessment and devel-opment, Environ. Modell. Softw., 26, 1171–1185, 2011. Avey, S. and Harvey, D.: How water scientists and lawyers can work
together: A ’down under’ solution to a water resource manage-ment problem, Journal of Water Law, 24, 25-61, 2014.
Bennett, J. C., Wang, Q. J., Pokhrel, P., and Robertson, D. E.: The challenge of forecasting high streamflows 1–3 months in advance with lagged climate indices in southeast Australia, Nat. Hazards Earth Syst. Sci., 14, 219–233, https://doi.org/10.5194/nhess-14-219-2014, 2014.
Berthet, L.: Prévision des crues au pas de temps horaire : pour une meilleure assimilation de l’information de débit dans un modèle hydrologique, AgroParisTech, 2010.
Berthet, L., Andréassian, V., Perrin, C., and Javelle, P.: How cru-cial is it to account for the antecedent moisture conditions in flood forecasting? Comparison of event-based and continuous approaches on 178 catchments, Hydrol. Earth Syst. Sci., 13, 819– 831, https://doi.org/10.5194/hess-13-819-2009, 2009.
Beven, K. and Binley, A.: The future of distributed models: Model calibration and uncertainty prediction, Hydrol. Process., 6, 279– 298, 1992.
Bowden, G. J., Maier, H. R., and Dandy, G. C.: Real-time de-ployment of artificial neural network forecasting models: Un-derstanding the range of applicability, Water Resour. Res., 48, W10549, https://doi.org/10.1029/2012WR011984, 2012. Brigode, P., Oudin, L., and Perrin, C.: Hydrological model
parame-ter instability: A source of additional uncertainty in estimating the hydrological impacts of climate change?, J. Hydrol., 476, 410–425, 2013.
Brookes, J. D., Aldridge, K., Dalby, P., Oemcke, D., Cooling, M., Daniel, T., Deane, D., Johnson, A., Harding, C., Gibbs, M., Ganf, G., Simonic, M., and Wood, C.: Integrated science informs for-est and water allocation policies in the South East of Australia, Inland Waters, 7, 358–371, 2017.
Coron, L., Andreassian, V., Perrin, C., Lerat, J., Vaze, J., Bourqui, M., and Hendrickx, F.: Crash testing hydrological models in contrasted climate conditions: An experiment on
216 Australian catchments, Water Resour. Res., 48, W05552, https://doi.org/10.1029/2011WR011721, 2012.
Crochemore, L., Ramos, M.-H., and Pappenberger, F.: Bias cor-recting precipitation forecasts to improve the skill of seasonal streamflow forecasts, Hydrol. Earth Syst. Sci., 20, 3601–3618, https://doi.org/10.5194/hess-20-3601-2016, 2016.
de Vos, N. J., Rientjes, T. H. M., and Gupta, H. V.: Diagnostic eval-uation of conceptual rainfall–runoff models using temporal clus-tering, Hydrol. Process., 24, 2840–2850, 2010.
Demargne, J., Wu, L. M., Regonda, S. K., Brown, J. D., Lee, H., He, M. X., Seo, D. J., Hartman, R., Herr, H. D., Fresch, M., Schaake, J., and Zhu, Y. J.: The Science of NOAA’s Operational Hydrologic Ensemble Forecast Service, B. Am. Meteorol. Soc., 95, 79–98, 2014.
Demirel, M. C., Booij, M. J., and Hoekstra, A. Y.: Effect of differ-ent uncertainty sources on the skill of 10 day ensemble low flow forecasts for two hydrological models, Water Resour. Res., 49, 4035–4053, 2013.
Evin, G., Thyer, M., Kavetski, D., McInerney, D., and Kuczera, G.: Comparison of joint versus postprocessor approaches for hydro-logical uncertainty estimation accounting for error autocorrela-tion and heteroscedasticity, Water Resour. Res., 50, 2350–2375, 2014.
Fenicia, F., Kavetski, D., Savenije, H. H. G., Clark, M. P., Schoups, G., Pfister, L., and Freer, J.: Catchment properties, function, and conceptual model representation: is there a correspondence?, Hy-drol. Process., 28, 2451–2467, 2014.
Gibbs, M. S., Maier, H. R., and Dandy, G. C.: A generic framework for regression regionalization in ungauged catchments, Environ. Modell. Softw., 27–28, 1–14, 2012.
Guo, D., Westra, S., and Maier, H. R.: Impact of evapotranspira-tion process representaevapotranspira-tion on runoff projecevapotranspira-tions from concep-tual rainfall-runoff models, Water Resour. Res., 53, 435–454, https://doi.org/10.1002/2016WR019627, 2017.
Hersbach, H.: Decomposition of the Continuous Ranked Prob-ability Score for Ensemble Prediction Systems, Weather Forecast., 15, 559–570, https://doi.org/10.1175/1520-0434(2000)015<0559:DOTCRP>2.0.CO;2, 2010.
Hudson, D., Alves, O., Hendon, H. H., and Marshall, A. G.: Bridg-ing the gap between weather and seasonal forecastBridg-ing: intrasea-sonal forecasting for Australia, Q. J. Roy. Meteor. Soc., 137, 673–689, 2011.
Humphrey, G. B., Gibbs, M. S., Dandy, G. C., and Maier, H. R.: A hybrid approach to monthly streamflow forecasting: Integrat-ing hydrological model outputs into a Bayesian artificial neural network, J. Hydrol., 540, 623–640, 2016.
Jeffrey, S. J., Carter, J. O., Moodie, K. B., and Beswick, A. R.: Us-ing spatial interpolation to construct a comprehensive archive of Australian climate data, Environ. Modell. Softw., 16, 309–330, 2001.
Kavetski, D., Franks, S. W., and Kuczera, G.: Confronting Input Uncertainty in Environmental Modelling, in: Calibration of Wa-tershed Models, American Geophysical Union, 49–68, 2003. Koster, R. D., Mahanama, S. P. P., Livneh, B., Lettenmaier, D. P.,
Krzysztofowicz, R. and Maranzano, C. J.: Hydrologic uncertainty processor for probabilistic stage transition forecasting, J. Hy-drol., 293, 57–73, 2004.
Lerat, J., Pickett-Heaps, C., Shin, D., Zhou, S., Feikema, P., Khan, U., Laugesen, R., Tuteja, N., Kuczera, G. T. M., and Kavetski, D.: Dynamic streamflow forecasts within an uncertainty framework for 100 catchments in Australia, 36th Hydrology and Water Re-sources Symposium: The art and science of water, Barton, ACT, 1396–1403, 2015.
Li, H. B., Luo, L. F., Wood, E. F., and Schaake, J.: The role of initial conditions and forcing uncertainties in seasonal hy-drologic forecasting, J. Geophys. Res.-Atmos., 114, D04114, https://doi.org/10.1029/2008JD010969, 2009.
Li, L., Lambert, M. F., Maier, H. R., Partington, D., and Simmons, C. T.: Assessment of the internal dynamics of the Australian Wa-ter Balance Model under different calibration regimes, Environ. Modell. Softw., 66, 57–68, 2015a.
Li, Y., Ryu, D., Western, A. W., and Wang, Q. J.: Assimilation of stream discharge for flood forecasting: Updating a semidis-tributed model with an integrated data assimilation scheme, Wa-ter Resour. Res., 51, 3238–3258, 2015b.
Liu, Y. and Gupta, H. V.: Uncertainty in hydrologic modeling: To-ward an integrated data assimilation framework, Water Resour. Res., 43, W07401, https://doi.org/10.1029/2006WR005756, 2007.
Luo, J., Wang, E., Shen, S., Zheng, H., and Zhang, Y.: Effects of conditional parameterization on performance of rainfall-runoff model regarding hydrologic non-stationarity, Hydrol. Process., 26, 3953–3961, 2012.
Maurer, E. P. and Lettenmaier, D. P.: Predictability of seasonal runoff in the Mississippi River basin, J. Geophys. Res.-Atmos., 108, 8607, https://doi.org/10.1029/2002JD002555, 2003. McInerney, D., Thyer, M., Kavetski, D., Lerat, J., and Kuczera, G.:
Improving probabilistic prediction of daily streamflow by iden-tifying Pareto optimal approaches for modeling heteroscedastic residual errors, Water Resour. Res., 53, 2199–2239, 2017. Milly, P. C. D., Betancourt, J., Falkenmark, M., Hirsch, R. M.,
Kundzewicz, Z. W., Lettenmaier, D. P., Stouffer, R. J., Dettinger, M. D., and Krysanova, V.: On Critiques of “Stationarity is Dead: Whither Water Management?”, Water Resour. Res., 51, 7785– 7789, 2015.
Mount, N. J., Maier, H. R., Toth, E., Elshorbagy, A., Solomatine, D., Chang, F. J., and Abrahart, R. J.: Data-driven modelling approaches for socio-hydrology: opportunities and challenges within the Panta Rhei Science Plan, Hydrolog. Sci. J., 61, 1192– 1208, https://doi.org/10.1080/02626667.2016.1159683, 2016. Pagano, T., Garen, D., and Sorooshian, S.: Evaluation of official
western US seasonal water supply outlooks, 1922–2002, J. Hy-drometeorol., 5, 896–909, 2004.
Pappenberger, F. and Beven, K. J.: Ignorance is bliss: Or seven reasons not to use uncertainty analysis, Water Resour. Res., 42, W05302, https://doi.org/10.1029/2005WR004820, 2006. Perrin, C., Michel, C., and Andreassian, V.: Improvement of a
parsi-monious model for streamflow simulation, J. Hydrol., 279, 275– 289, https://doi.org/10.1016/S0022-1694(03)00225-7, 2003. Randrianasolo, A., Thirel, G., Ramos, M. H., and Martin, E.: Impact
of streamflow data assimilation and length of the verification pe-riod on the quality of short-term ensemble hydrologic forecasts, J. Hydrol., 519, 2676–2691, 2014.
Refsgaard, J. C.: Validation and Intercomparison of Different Up-dating Procedures for Real-Time Forecasting, Hydrol. Res., 28, 65–84, 1997.
Renard, B., Kavetski, D., Kuczera, G., Thyer, M., and Franks, S. W.: Understanding predictive uncertainty in hydrologic modeling: The challenge of identifying input and structural errors, Water Resour. Res., 46, W05521, https://doi.org/10.1029/2009WR008328, 2010.
Robertson, D. E. and Wang, Q. J.: Seasonal Forecasts of Unreg-ulated Inflows into the Murray River, Australia, Water Resour. Manag., 27, 2747–2769, 2013.
Robertson, D. E., Pokhrel, P., and Wang, Q. J.: Improving statistical forecasts of seasonal streamflows using hydrolog-ical model output, Hydrol. Earth Syst. Sci., 17, 579–593, https://doi.org/10.5194/hess-17-579-2013, 2013.
Searcy, J. K., Hardison, C. H., and Langein, W. B.: Double-mass curves; with a section fitting curves to cyclic data, Report 1541B, 1960.
Shao, Q. and Li, M.: An improved statistical analogue downscaling procedure for seasonal precipitation forecast, Stoch. Env. Res. Risk A, 27, 819–830, 2013.
Sun, L., Seidou, O., and Nistor, I.: Data Assimilation for Streamflow Forecasting: State-Parameter Assimilation ver-sus Output Assimilation, J. Hydrol. Eng., 22, 04016060, https://doi.org/10.1061/(ASCE)HE.1943-5584.0001475, 2017. Thyer, M., Renard, B., Kavetski, D., Kuczera, G., Franks, S. W.,
and Srikanthan, S.: Critical evaluation of parameter consistency and predictive uncertainty in hydrological modeling: A case study using Bayesian total error analysis, Water Resour. Res., 45, W00B14, https://doi.org/10.1029/2008WR006825, 2009. Tuteja, N. K., Shin, D., Laugesen, R., Khan, U., Shao, Q., Li, M.,
Zheng, H., Kuczera, G., Kavetski, D., Evin, G., Thyer, M. A., MacDonald, A., Chia, T., and Le, B.: Experimental evaluation of the dynamic seasonal streamflow forecasting approach, Bureau of Meteorology, Australia, 99 pp., 2011.
Vaze, J., Post, D. A., Chiew, F. H. S., Perraud, J. M., Viney, N. R., and Teng, J.: Climate non-stationarity – Validity of calibrated rainfall–runoff models for use in climate change studies, J. Hy-drol., 394, 447–457, 2010.
Vrugt, J. A., Diks, C. G. H., Gupta, H. V., Bouten, W., and Verstraten, J. M.: Improved treatment of uncertainty in hydro-logic modeling: Combining the strengths of global optimiza-tion and data assimilaoptimiza-tion, Water Resour. Res., 41, W01017, https://doi.org/10.1029/2004WR003059, 2005.
Vrugt, J. A., ter Braak, C. J. F., Diks, C. G. H., Robinson, B. A., Hy-man, J. M., and Higdon, D.: Accelerating Markov Chain Monte Carlo Simulation by Differential Evolution with Self-Adaptive Randomized Subspace Sampling, Int. J. Nonlin. Sci. Num., 10, 273–290, 2009.
Wagener, T., McIntyre, N., Lees, M. J., Wheater, H. S., and Gupta, H. V.: Towards reduced uncertainty in conceptual rainfall-runoff modelling: dynamic identifiability analysis, Hydrol. Process., 17, 455–476, 2003.
streamflows at multiple sites, Water Resour. Res., 45, W05407, https://doi.org/10.1029/2008WR007355, 2009.
Westra, S., Thyer, M., Leonard, M., Kavetski, D., and Lam-bert, M.: A strategy for diagnosing and interpreting hydrologi-cal model nonstationarity, Water Resour. Res., 50, 5090–5113, https://doi.org/10.1002/2013WR014719, 2014. 2014.
Wood, A. W. and Lettenmaier, D. P.: An ensemble approach for attribution of hydrologic prediction uncertainty, Geophys. Res. Lett., 35, L14401, https://doi.org/10.1029/2008GL034648, 2008. Wood, A. W. and Schaake, J. C.: Correcting errors in streamflow forecast ensemble mean and spread, J. Hydrometeorol., 9, 132– 148, 2008.
Wright, D. P., Thyer, M., and Westra, S.: Influential point detection diagnostics in the context of hydrological model calibration, J. Hydrol., 527, 1161–1172, 2015.
Wu, W., May, R. J., Maier, H. R., and Dandy, G. C.: A benchmark-ing approach for comparbenchmark-ing data splittbenchmark-ing methods for modelbenchmark-ing water resources parameters using artificial neural networks, Wa-ter Resour. Res., 49, 7598–7614, 2013.
Yang, T., Asanjan, A. A., Welles, E., Gao, X., Sorooshian, S., and Liu, X.: Developing reservoir monthly inflow forecasts using ar-tificial intelligence and climate phenomenon information, Water Resour. Res., 53, 2786–2812, 2017.
Ye, W., Bates, B. C., Viney, N. R., Sivapalan, M., and Jakeman, A. J.: Performance of conceptual rainfall-runoff models in low-yielding ephemeral catchments, Water Resour. Res., 33, 153– 166, 1997.
Yihdego, Y. and Webb, J.: An Empirical Water Budget Model As a Tool to Identify the Impact of Land-use Change in Stream Flow in Southeastern Australia, Water Resour. Manag., 27, 4941– 4958, 2013.
![Revised draft report on Television without Frontiers - Green Paper on the establishment of the common market for broadcasting, especially by satellite and cable [COM (84) 300 final]. CES 374/85, 17 July 1985](data:image/gif;base64,R0lGODlhAQABAIAAAP///wAAACH5BAEAAAAALAAAAAABAAEAAAICRAEAOw==)