Making in Response to Faces in High-Functioning Autism
Thesis by Alma Gharib
In Partial Fulfillment of the Requirements for the degree of
Doctor of Philosophy
CALIFORNIA INSTITUTE OF TECHNOLOGY Pasadena, California
2015
ACKNOWLEDGEMENTS
First and foremost, I am grateful to my parents, Shohreh and Mory, who always encouraged me to be curious, to my sister Maral in whose footsteps I love to follow, to Sean, my loving and supportive husband, and to my dog Oliver, for being Oliver.
I would also like to thank my two advisors, Prof. Shin Shimojo and Prof. Ralph Adolphs, for their mentorship and guidance, as well as my committee members, Prof. Pietro Perona and Prof. John Allman, for encouraging me to pursue my interest in art and science in whatever way possible.
ABSTRACT
How do we come to the decision that we like a face? This thesis investigates this important aspect of social processing and communication by examining preference decisions for faces and the role that visual behavior plays in the process. I present a series of studies designed to investigate face preference formation and gaze patterns using eye-tracking and self-reported preference ratings. I tested healthy control subjects and two clinical populations known to have deficits in social processing: people with autism and patients with amygdala lesions. In studies one and two, I explore whether known social cognition deficits in people with autism and amygdala lesions also impair subjective decision-making regarding the attractiveness of faces. In study three, I investigate the flexibility of rule-based visual strategies used by these populations during face perception. Additionally, I present a custom algorithm developed to process raw eyetracking data, which was used to analyze all eyetracking data in this thesis.
TABLE OF CONTENTS
Acknowledgments ... iii
Abstract ... iv
Table of Contents ... v
List of Figures ... ix
List of Tables ... xiii
Chapter I: Introduction ... 1
1.1 General Overview ... 1
1.2 Background and Context ... 3
1.2.1 Social attention and face perception in neurotypicals ... 3
1.2.2 Social processing of faces ... 7
1.2.3 Social saliency in autism ... 10
1.2.4 Divergent behavioral findings in autism research ... 12
1.2.5 Abnormal brain structure and connectivity in autism ... 14
1.2.6 The amygdala: a conductor of social attention ... 17
1.2.7 Amygdala lesion studies ... 18
1.3 Study Summary and Thesis Structure ... 20
Chapter II: A Custom Algorithm For Analysis Of Eyetracking Data ... 23
2.1 Overview ... 23
2.2 Introduction ... 25
2.3 Defining and Identifying Common Eye Movements ... 25
2.3.1 Fixations ... 25
2.3.2 Saccades ... 26
2.3.3 Other eye movements ... 27
2.4 Critical Data Processing Filters and What They Do ... 27
2.4.1 Measures used in event detection ... 27
2.4.2 Addressing data quality ... 28
2.4.2.1 Gap fill-in and blink detection ... 29
2.4.2.2 Noise reduction ... 31
2.4.3 Separating events (fixations and saccades) ... 33
2.4.3.2 Determining thresholds ... 34
2.4.3.3 Displacement calculation ... 37
2.4.3.4 Saccade detector ... 37
2.4.4 Rejecting false saccades and fixations ... 37
2.4.4.1 Saccade classifier ... 37
2.4.4.2 Merging fixations ... 38
2.4.4.3 Discarding short fixations ... 39
2.5 Conclusion ... 39
2.6 Pseudocode of Event Detection Algorithm ... 40
2.7 Summary of Suggested Parameter Settings ... 43
Chapter III: Face Preference Decision-Making And Visual Behavior ... 44
3.1 Overview ... 44
3.2 Gaze Cascade Study in Autism ... 47
3.2.1 Abstract ... 47
3.2.2 Introduction ... 47
3.2.3 Materials and methods ... 51
3.2.3.1 Participants ... 51
3.2.3.2 Stimuli and apparatus ... 52
3.2.3.3 Procedure ... 54
3.2.3.4 Analyses ... 55
3.2.4 Results ... 59
3.2.4.1 Fixation behavior ... 59
3.2.4.2 Preference choices ... 60
3.2.4.3 Gaze cascade effect ... 62
3.2.4.4 Reaction times ... 65
3.2.5 Discussion ... 69
3.3 Gaze Cascade Study in Amygdala Lesion Patients ... 75
3.3.1 Materials and methods ... 75
3.3.1.1 Participants ... 75
3.3.1.2 Stimuli and apparatus ... 77
3.3.1.3 Procedure ... 78
3.3.1.4 Analyses ... 79
3.3.2.1 Fixation behavior ... 80
3.3.2.2 Preference choices ... 82
3.3.2.3 Gaze cascade effect ... 83
3.3.2.4 Reaction times ... 88
3.3.3 Discussion ... 90
3.4 Familiarity versus Novelty Study ... 94
3.4.1 Introduction ... 94
3.4.2 Materials and methods ... 96
3.4.2.1 Participants ... 96
3.4.2.2 Stimuli and apparatus ... 98
3.4.2.3 Procedure ... 99
3.4.2.4 Analyses ... 100
3.4.3 Results ... 101
3.4.3.1 Familiarity-Novelty scores ... 101
3.4.3.2 Likelihood of initial fixation on novel image ... 105
3.4.3.3 Likelihood of initial fixation on eventually-chosen image ... 106
3.4.4 Discussion ... 107
3.5 Conclusion ... 111
Chapter IV: Task-dependent Modulation Of Face Gaze ... 113
4.1 Overview ... 113
4.2 Don’t Look Study in Autism ... 116
4.2.1 Introduction ... 116
4.2.2 Materials and methods ... 121
4.2.2.1 Participants ... 121
4.2.2.2 Stimuli and apparatus ... 123
4.2.2.3 Procedure ... 124
4.2.2.4 Analyses ... 125
4.2.3 Results ... 131
4.2.3.1 Gaze proportions in all regions of interest ... 133
4.2.3.2 AQ and ADOS correlations with gaze to ROIs ... 135
4.2.3.3 Gaze distribution in eye region ... 136
4.2.3.4 Center bias to horizontal and vertical midlines ... 138
4.3 Don’t Look Study in Amygdala Lesion Patients ... 150
4.3.1 Materials and methods ... 150
4.3.1.1 Participants ... 150
4.3.1.2 Stimuli and apparatus ... 151
4.3.1.3 Procedure ... 152
4.3.1.4 Analyses ... 153
4.3.2 Results ... 157
4.3.2.1 Gaze proportions in all regions of interest ... 159
4.3.2.2 Gaze distribution in eye region ... 161
4.3.2.3 Center bias to horizontal and vertical midlines ... 162
4.3.3 Discussion ... 163
4.4 Conclusion ... 166
Chapter V: General Discussion And Future Directions ... 168
5.1 Summary ... 168
5.2 Limitations ... 170
5.3 Future Directions ... 171
LIST OF FIGURES
Number Page
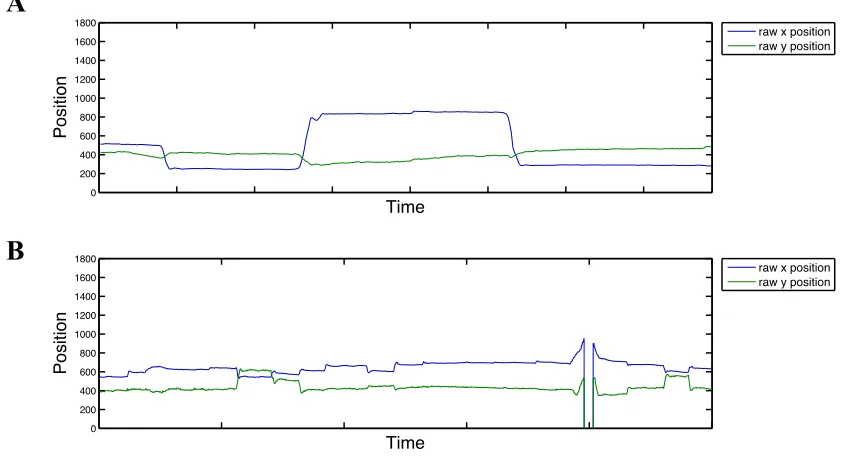
2.1 Examples of raw eye gaze traces for the x and y position of the right eye recorded at (A) 250 Hz and (B) 500 Hz ... 28
2.2 Eyes gaze traces showing (A) raw gaze data recorded at 500 Hz, and (B) gaze data after gap interpolation has been performed. Gaps are selectively filled based on duration ... 30
2.3 Sample gaze data showing the stages of filtering used to address data quality ... 32
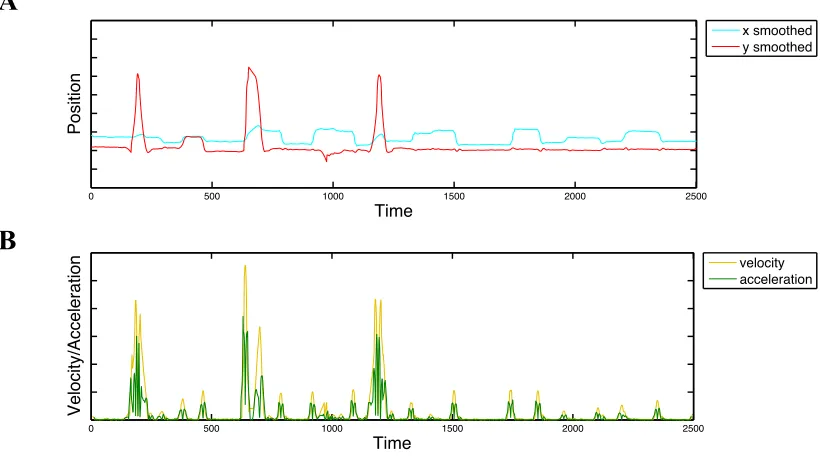
2.4 (A) Interpolated gaze traces and (B) corresponding velocity and acceleration traces calculated from the interpolated data using a moving average window ... 34
2.5 (A) Interpolated and smoothed gaze data for one trial, (B) the corresponding velocity trace (gold) and adaptive velocity threshold (dashed gray), and (C) acceleration trace (green) and adaptive acceleration threshold (dashed gray) ... 35
2.6 (A) Interpolated data, (B) corresponding fixation output showing fixations with no minimum duration, (C) final fixation classifier output (purple) and discarded fixations (green) ... 40
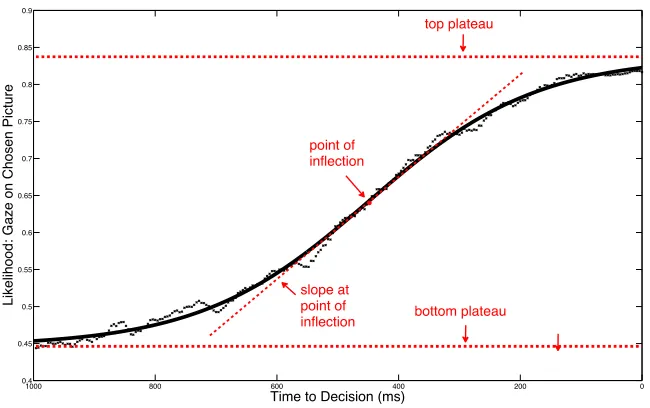
3.2 Protoypically-interpolated sigmoid with four parameters describing the time course of gaze probability at a given time point ahead of decision time (i.e. button press) ... 57
3.3 (A) Mean fixation duration (B) mean fixation rate and (C) latency to first fixation on either stimulus for the autism (red) and control (blue) groups ... 59
3.4 The likelihood that a participant's gaze is directed at the to-be-chosen stimulus is plotted against time to decision for the autism group (red) and control group (blue) for (A) Open Eyes, (B) Closed Eyes, (C) Timed, (D) Roundness, and (E) Nature Scenes ... 63
3.5 Mean reaction times for the preliminary geometrical shape recognition task and experimental conditions, for the autism (red) and control (blue) groups ... 66
3.6 Anatomical scans of the amygdala lesion patients. Red arrows indicate location of the amygdala calcification damage ... 76
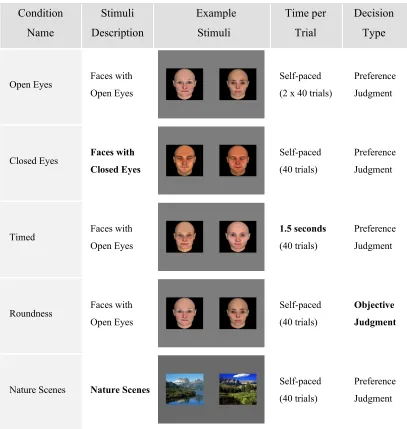
3.7 Summary of experimental conditions and example stimuli ... 79
3.8 Mean fixation duration (A) mean fixation rate (B) and latency to first fixate on an image (C) for the amygdala (red) and control (blue) groups ... 81
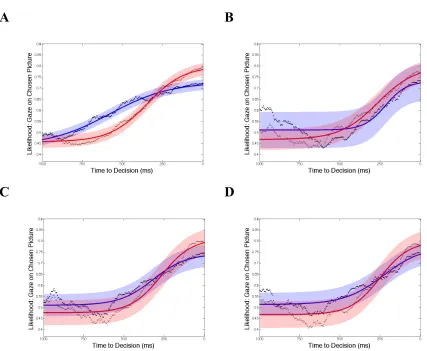
3.9 Sigmoid fits for individual control subjects (blue) and amygdala lesion subjects (red) for (A) Open Eyes, (B) Timed, (C) Roundness, and (D) Nature Scenes ... 84
and control group (blue) for (A) Open Eyes, (B) Timed, (C) Roundness, and (D) Nature Scenes ... 86
3.11 Mean reaction times for the preliminary geometrical shape recognition task and experimental conditions, for the amygdala (red) and control (blue) groups ... 88
3.12 Summary of experimental conditions and example stimuli. Median-rated picture is shown on the left. ... 100
3.13 Time-course of familiarity/novelty preference bias over 20 trials, collapsed across sub-categories in each image category. The two categories consist of Face categories: female and male), and Nature Scenes (sub-categories: desert scenes, mountain scenes). ... 103
3.14 Time-course of familiarity/novelty bias in the ASD group (top) and Control group (bottom) divided by sub-categories. ... 104
3.15 The probability of initial gaze on the novel image plotted against stimulus type. Dashed line indicates chance (50/50) likelihood. Error bars denote standard error. ... 106
3.16 The probability of initial gaze on the image that was eventually chosen plotted against stimulus type. Dashed line indicates chance (50/50) likelihood. Error bars denote standard error. ... 107
4.1 (A) Example stimuli showing Open Eyes (top) and Closed Eyes (bottom) faces, and (B) summary of experimental conditions ... 125
4.3 Template face with all regions of interest defined: yellow- left eye, magenta – right eye, blue – eye region total, gray – nose, orange – mouth, green – head remainder, red – off-head ... 129
4.4 ROI configurations used for the various analyses. (A) Gaze proportions to all regions of interest, (B) Gaze proportion to the eye region only, (C) Center Bias – average distance to the horizontal and vertical midlines ... 130
4.5 Heat maps for the Autism and Control groups, and condition with Open Eyes and Closed Eyes stimuli ... 132
4.6 Proportion of fixation time in the ROIs in the ASD (red) and control (blue) groups ... 133
4.7 (A) Heatmaps and gaze proportions in the eye-related ROIs in the ASD (red) and control (blue) groups collapsed across condition and stimulus type. (B) Gaze proportions in the eye-related ROIs in the ASD (red) and control (blue) groups divided by condition and stimulus type. Error bars denote standard error ... 137
4.8 Mean distance to the vertical midline in the Eye Region, collapsed across stimulus type and condition. Distance is measured in degrees of visual angle. Dots represent individual subjects and solid lines denote group mean ... 149
4.9 (A) Example stimuli showing Open Eyes (top) and Closed Eyes (bottom) faces, and (B) summary of experimental conditions ... 153
4.11 ROI configurations used in the different analyses. (A) Gaze proportions to all regions of interest, (B) Gaze proportion to the eye region, (C) Center Bias – average distance to the horizontal and vertical midlines ... 156
4.12 Heat maps for the amygdala and control groups, and conditions with Open Eyes and Closed Eyes stimuli ... 158
4.13 Proportion of fixation time in the ROIs in the amygdala (red) and control (blue) subjects ... 159
LIST OF TABLES
Number Page
1.1 Summary of dissertation structure and participants in studies ... 20
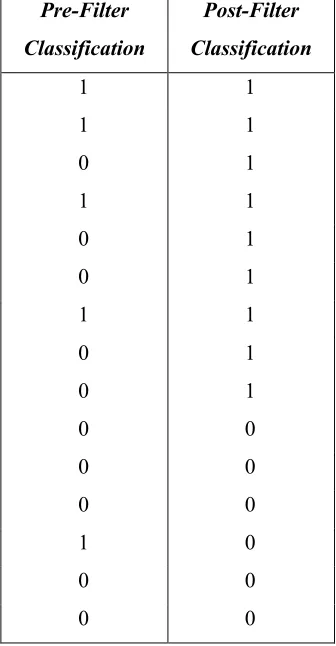
2.1 Illustration of the saccade classifier filter ... 38
2.2 Suggested initial parameter settings for eye-tracking data recorded at 500 Hz ... 43
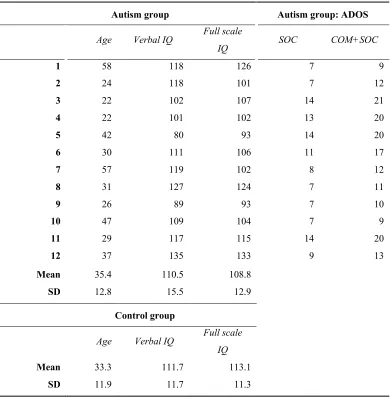
3.1 Demographic and diagnostic information for autism and control participants in the gaze cascade study ... 52
3.2 Between-group correlation of preference choices in low and high difficulty trials combined ... 60
3.3 Post-ratings of stimuli subset by control and autism participants (13-14% of all images presented in study) and between-group correlation of ratings ... 61
3.4 Results of the binary logistic regression model for low difficulty trials, regressing the dependent variable of preference choice against the consensus-preferred image as defined by the pre-rating group (beta weight means and standard errors, and p values from 2-tailed t-tests) ... 62
3.5 Permutation Analysis: Summary table of coefficient estimates for four-parameter sigmoid fits ... 65
3.7 Demographic information for amygdala lesion and control participants in the gaze cascade study ... 77
3.8 Between-group correlation of preference choices in low and high difficulty trials combined ... 82
3.9 Results of the binary logistic regression model for low difficulty trials, regressing the dependent variable of preference choice against the consensus-preferred image as defined by the pre-rating group (beta weight means and standard errors, and p values from 2-tailed t-tests) ... 83
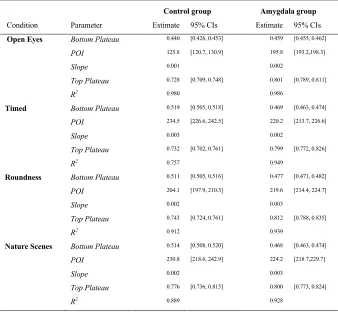
3.10 Summary table of coefficient estimates for four-parameter sigmoid fits (parameters: bottom plateau, top plateau, point of inflection, slope at point of inflection), and 95% confidence intervals for estimates ... 87
3.11 Mean reaction times in seconds (non-transformed values) and standard errors for high and low difficulty trials, and mean accuracy scores for the low difficulty trials ... 89
3.12 Demographic and diagnostic information for autism and control participants in the Familiarity/Novelty study ... 97
4.1 Demographic and diagnostic information for autism and control participants in the Don’t Look study ... 122
C h a p t e r I
INTRODUCTION
1.1 General Overview
Human faces and facial expressions are central to social communication. Our ability to accurately evaluate and make decisions about faces is a vital component of social functioning, enabling us to perceive emotions, decode others’ intentions, and form social bonds. The visual and cognitive mechanisms involved in face processing are in large part subconscious and automatic, yet they wield an enormous influence on our judgments about faces and emotional expressions and, ultimately, on our social behavior. While most of the extant research on face processing focuses on visual behavior during objective decision-making tasks, such as face discrimination or emotion recognition, few studies investigate the influence of visual behavior on subjective decision-making with regard to faces. Much of our day-to-day social behavior is not based on objective and explicit processing, but is instead based on cues that are processed subjectively and automatically. As such, an important but overlooked aspect of social decision-making processes is the question of how we evaluate faces and ultimately determine if we like them. While subjective judgments and the behavior that accompanies them can be more difficult to operationalize than objective judgments with empirically correct answers, subjective decision-making can be at least partially quantified through scientific methods such as eyetracking and behavioral measures in an effort to better understand how we subjectively evaluate faces.
The aim of this thesis is to investigate the automatic and subconscious components of visual behavior that influence how we examine faces, and how these components of visual behavior can affect the way in which we subjectively evaluate faces. Specifically, how do we come to the decision that we like a face or not? One way to explore this question is to compare clinical populations that demonstrate impairments in social functioning, such as individuals with autism or amygdala lesions, to healthy controls (also referred to as neurotypicals) during social processing tasks. We know that subjects with autism show deficits in orienting towards and processing socially-salient stimuli, with a particular deficit in the evaluation of faces, which may in turn be linked to amygdala dysfunction.
The current research involves a series of studies investigating specific elements of visual behavior and preference formation for faces across three populations: healthy controls, people with autism, and amygdala lesion patients. In the first study, I explore visual behavior during preference decision-making for both social stimuli and non-social stimuli. When comparing healthy controls to autism and amygdala lesion patients, I examine whether the processes that are disturbed in making objective judgments about faces also affect subjective decision-making about faces. In the second study, I investigate one well-known aspect of face preference formation reported in healthy populations—a preference bias for familiar faces over those that are novel—in order to examine whether social processing deficits affect preference formation for familiar faces. In the last study, I explore the use and flexibility of atypical face viewing strategies that can partly compensate for social processing deficits.
1.2 Background and Context
1.2.1 Social attention and face perception in neurotypicals
Faces and facial expressions are a meaningful source of social and affective information, and studies show that faces and facial expressions have a unique ability to attract and hold our attention. There is extensive research available on the social attention and face perception of neurotypicals, which is briefly reviewed in this section. One powerful methodology used by researchers to study face processing is eye-tracking, whereby a person’s eye movements are recorded to analyze where a subject is looking and directing their attention in relation to a visual stimulus. Eye movement patterns are widely regarded as an indicator of visual and attentional processes involved in performing a task. Tracking subjects’ eye movements during viewing of social stimuli, such as faces, therefore provides a useful measure of where people are directing their attention during social and face processing tasks.
In 1967, in one of the earlier eyetracking studies examining the social saliency of faces, Alfred Yarbus showed participants the painting Unexpected Visitors (Repin, 1884) and examined how the viewers’ gaze moved across the picture (Yarbus, 1967). Yarbus recorded the participants’ eye movements using a homemade eyetracking device affixed directly to the eye with suction. He found that the faces of people depicted in the painting attracted the most visual attention compared to the rest of the elements in the scene. That is, the viewers’ eyes would often pause, or fixate, upon faces rather than other parts of the picture. Since Yarbus’s research, the social saliency of faces for neurotypicals has been demonstrated in many other studies (Palermo & Rhodes, 2007; Posamentier, 2003; Theeuwes & Van der Stigchel, 2006; Vuilleumier, 2000), particularly through experiments using increasingly more modern techniques such as eyetracking and neuroimaging. Such experiments have demonstrated the important role that social attention plays in human interaction.
the attentional bias toward human figures is evident even in the first fixation made after an image is presented (Fletcher-Watson, Findlay, Leekam, & Benson, 2008), indicating that the presence of a person in an image can be processed rapidly and subconsciously prior to the first fixation. This finding points to face-sensitive perceptual mechanisms that function pre-attentively or within the bounds of attention, but at a remarkably swift speed, meaning a great deal of social processing occurs subconsciously and automatically. This is particularly intriguing with respect to the amygdala, a key neural structure involved in directing social attention. The relationship between social processing and the amygdala will be discussed later in this chapter.
Several studies have examined the visual preference choices made by neurotypical individuals. For example, Shimojo and colleagues (2003) have shown that preference and gaze interact in a positive feedback loop to produce a phenomenon known as the “gaze cascade” effect (S. Shimojo, Simion, Shimojo, & Scheier, 2003). The effect is observed when choosing between social stimuli, as well as when choosing between non-social stimuli. When observers are shown pairs of images and instructed to choose which of the two they prefer, their gaze is equally likely to be on either picture. However, in the few seconds before a decision is made, a gaze bias builds toward the stimulus that is eventually chosen, increasing until the person makes a decision. The bias occurs outside of the person’s awareness, and is present before the person is conscious of his or her final preference. It is hypothesized that this increasing gaze bias reflects a positive feedback loop between two behavioral factors that are critical for forming the eventual preference: people tend to look more at an image they prefer, and people tend to prefer images that they have seen more.
instructed to judge for preference, people prefer the faces that are familiar. But the opposite occurs with nature scenes: when presented with pairs of nature scene images, people prefer the images that are novel. In other words, healthy controls demonstrate a familiarity bias for faces but a novelty bias for nature scenes. The authors suggest the familiarity preference for faces, which will be discussed further in Chapter 3.4, might be driven by the preferential attention that is afforded to faces over other non-social stimuli.
There is considerable evidence to indicate that faces enjoy preferential attentional capture in normally developing individuals (Vuilleumier, 2000). The reflexive attraction to faces is so robust in neurotypicals that it occurs even when it would be beneficial to inhibit it (Bindemann, Burton, Hooge, Jenkins, & De Haan, 2005; Gilchrist & Proske, 2006; Theeuwes & Van der Stigchel, 2006). That is, by showing a face in the field of view, individuals cannot help but employ attentional resources to process it, even when doing so subsequently distracts from the goals of a competing task. In one study, Langton and colleagues (2008) reported that participants were slower to find a non-social image when a face was also present on-screen compared to when a face was absent (Langton, Law, Burton, & Schweinberger, 2008). In other words, a face that had no relevance to the visual target for which participants were searching slowed their ability to search for a different target because the face automatically engaged viewers’ attention. These findings demonstrate that faces are not only spontaneously detected and attended to, but also indicate that it is harder to disengage from a face compared to a non-face object once one’s attention has been captured by it.
other non-face stimuli for attention. Thus, in typically developing people, faces enjoy privileged status, engaging and holding attention quicker and longer than non-social objects.
The preference in attention toward faces and face-like configurations over other objects in the environment seems to be innate in many respects. For example, spontaneous orienting to faces is a behavior present from birth: newborn infants (participants in the study were an average of nine minutes in age) show heightened interest in faces, turning their heads more frequently to gaze at images whose internal elements are configured to resemble actual faces than at images with the same internal elements scrambled, or a blank image (Goren, Sarty, & Wu, 1975). Infants also direct their first fixations to face-like patterns more often than would be observed by chance, even when other stimuli are competing for visual attention (Gliga, Elsabbagh, Andravizou, & Johnson, 2009). These results show that the basic neural architecture for attending to and evaluating faces for social information is present in some form even at an early age.
inverted one (Tomalski, Csibra, & Johnson, 2009). Taken together, these findings demonstrate that the brain is primed to recognize and evaluate faces in even their most basic configurations. One reason behind these findings may be that the face holds special significance in its ability to communicate social information, which will be discussed next.
1.2.2 Social processing of faces
Faces communicate a wealth of information regarding people’s emotions, attention, and future intentions, and neurotypical individuals quickly and effortlessly evaluate faces to process this social information. One vital component underlying neurotypicals’ ability to process facial information is the spontaneous tendency to prioritize gaze to specific facial features over other parts of the face. When viewing faces, individuals’ fixations are largely clustered around the key facial features that communicate the greatest amount of emotional and social information: first the eyes, followed by the mouth and nose (Luria & Strauss, 1978; Stephen, Wellens, Goldberg, & Dell'Osso, 1978; Walker-Smith, Gale, & Findlay, 1977). At a glance, these regions are evaluated and processed to form an impression of another person’s mental state. Anger is quickly recognized by the downward turn of the inner eyebrows (Jones, 1974; Yarbus, 1967), combined with pursed or scowling lips (Kohler et al., 2004), disgust is perceived from a wrinkled nose and raised upper lip (Rozin, Lowery, & Ebert, 1994; McIntosh, 2006), and fear is recognized by the widening of eyes and increased amount of visible sclera (Whalen et al., 2004), along with a stretched mouth (Kohler et al., 2004). In addition to a smile, genuine happiness is recognized by the contraction of muscles surrounding the eyes, known as orbicularis oculi (Williams, Senior, David, Loughland, & Gordon, 2001).
social gaze and their meaning, see Emery, 2000). Emotions are another dynamic cue that can be communicated just by the eye region. Complex emotional states—such as admiration, arrogance, boredom, and guilt—can be identified just as well from the eyes as from the whole face (Baron-Cohen, Wheelwright, & Jolliffe, 1997). Thus, the eyes are a highly salient cue for social communication and interaction. For this reason, in social processing tasks and in tasks investigating where neurotypicals naturally orient their gaze, the eyes are the elements of the face that are fixated upon most frequently and for longer durations of time than other regions of the face (Itier, Villate, & Ryan, 2007; Stephen et al., 1978). Like the general salience of the face, the salience of the eyes is also present in early infancy. Infants direct more of their attention to faces with open eyes compared to closed eyes (Batki, Baron-Cohen, Wheelwright, Connellan, & Ahluwalia, 2000), as well as to faces showing direct gaze compared to averted gaze (Farroni, Csibra, Simion, & Johnson, 2002).
place automatically and subconsciously, and that these cues can modulate further, and often more complex, social processing by directing visual attention.
In addition to rapid processing of facial features for emotion and intention, people also form impressions of social traits based purely on facial features, and they do so in a remarkably brief amount of time. With a quick glance at a person’s face, often as little as 50 milliseconds, people are able to make a variety of social judgments regarding others, evaluating intelligence, attractiveness, aggressiveness, and competence (Bar, Neta, & Linz, 2006; Olson & Marshuetz, 2005; Rule, Ambady, & Adams, 2009). The characteristics perceived in the initial stages of seeing a person’s face prove to be influential in determining the social traits ascribed to that individual. For example, one study showed that neurotypicals make inferences about attractiveness, trustworthiness, competence, and aggressiveness when perceiving a face in as little as 100 milliseconds after exposure (Willis & Todorov, 2006). Additionally, judgments that were made in 100 milliseconds strongly correlated with judgments that were made in the absence of a time restriction, indicating that a time window of 100 milliseconds is sufficient to automatically invoke a variety of complex social inferences.
The automatic and subjective inferences people make for characteristics such as trustworthiness and attractiveness affect social judgments and behavior in neurotypicals. For example, research has shown that these social inferences affect election outcomes (Ballew & Todorov, 2007), professional success (Dipboye, Arvey, & Terpstra, 1977; Shahani-Denning, 2003), consumption behavior (Winkielman, 2005), and even sentencing leniency in the judicial system (Stewart, 1980). Furthermore, people attribute different qualities based on perceptions of attractiveness: more attractive people elicit more positive impressions of competence (Eagly, Ashmore, & Makhijani, 1991) and even more attractive babies are viewed as being more responsive and intelligent than their less attractive peers (Langlois et al., 2000).
shown to be compromised in individuals with social disorders such as autism spectrum disorder (ASD) (Dawson et al., 2004; Katarzyna, Fred, & Ami, 2010; Remington et al., 2012). Studying face processing in people with ASD can provide insight into both the neurological processes underlying face perception and the underlying symptomology in ASD and other disorders in which social processing is impaired.
1.2.3 Social saliency in autism
Autism is a pervasive developmental disorder with core diagnostic criteria that include restricted and repetitive behaviors and interests, and deficits in social communication and interaction (Diagnostic Statistical Manual of Mental Disorders - 5th ed.; American Psychiatric Association, 2013). Individuals with autism have impairments across a variety of domains, including deficits in orienting towards social cues such as eye gaze (Dawson et al., 2004; Elsabbagh et al., 2012; Jones, Carr, & Klin, 2008), and difficulty processing social and emotional information (Ashwin, Chapman, Colle, & Baron-Cohen, 2006; Forgeot d’Arc et al., 2014; Smith, Montagne, Perrett, Gill, & Gallagher, 2010).
Few studies exist on face preference formation in ASD. Moreover, the two studies that have directly investigated face preference have drawn mixed conclusions. Da Fonseca, Santos, Rosset, and Dereulle (2007) reported people with ASD have similar attractiveness preferences as neurotypicals, and moreover, they demonstrate a similar tendency to attribute more positive qualities to faces perceived as more attractive (Da Fonseca, Santos, Rosset, & Deruelle, 2011). While a study by White, Hill, Winston and Frith (2005) also reported that attractiveness judgments in ASD did not differ from the judgments made by neurotypicals, in contrast to da Fonseca and colleagues (2007), they found that people with ASD were impaired in the ability to judge attractiveness of faces if they were the same sex as the participant (White, Hill, Winston, & Frith, 2006).
Frank, & Findlay, 2009), fixating more on the mouth than neurotypicals (Klin, Jones, Schultz, Volkmar, & Cohen, 2002; Spezio, Adolphs, Hurley, & Piven, 2007), as well as showing reduced eye contact (Jones & Klin, 2013; Katarzyna et al., 2010).
Although the exact abnormalities characterizing atypical eye gaze are still a matter of debate, a number of studies report differences in the eye gaze patterns of people with ASD, indicating they either avoid or simply lack interest in the eye region. Eyetracking studies have revealed that individuals with autism look less at the eyes of an emotionally expressive face than do neurotypicals (Corden, Chilvers, & Skuse, 2008; Dalton et al., 2005; Klin et al., 2002; Pelphrey et al., 2002; Riby & Hancock, 2008). Moreover, extant research has also indicated that people with autism fail to use information from the eyes to identify complex mental states such as shame or envy (Jolliffe & Baron-Cohen, 1997), and that they rely more on the mouth than the eyes for social information (Neumann, Spezio, Piven, & Adolphs, 2006).
Atypical gaze behavior is also linked to abnormalities in individuals’ ability to evaluate social information expressed through faces. For example, some studies have reported that high- and low-functioning individuals with autism present impaired recognition of facial expressions compared to controls (Hobson, 1986; Tantam, Monaghan, Nicholson, & Stirling, 1989). While these impairments might be restricted to the recognition of specific emotions such as fear, anger, and sadness (Ashwin et al., 2006; Bal et al., 2009; Wallace, Coleman, & Bailey, 2008), there is also evidence to suggest a more global impairment in emotion recognition (Rutherford & McIntosh, 2006; Tardif, Lainé, Rodriguez, & Gepner, 2007).
Social deficits in autism might also differ based on levels of intellectual disability. In people with high-functioning autism (which generally refers to diagnosed individuals who can communicate, carry out basic tasks, and have less intellectual impairment), there is evidence to suggest social impairments are restricted to higher-order social judgments rather than basic aspects of social perception. While social attributions that require higher-order judgments, mentalizing, or theory-of-mind inferences are more consistently impaired in individuals with high-functioning autism, some studies report that lower-level social processes are not impaired,
Jolliffe & Baron-Cohen, 1997). The pathways associated with complex aspects of processing facial and emotional expressions—such as the retrieval of social knowledge that allows us to recognize a familiar face, conceptual information about others’ mental and emotional states, or the generation of complex emotional responses in the viewer—might be separate from or compensated for by other pathways that allow for basic social processing, such as the recognition of simple emotions or face preference judgments. Therefore, high-functioning autistic individuals’ ability to process more basic social information might not be affected by the face processing deficits commonly observed in autism. Such heterogeneity in symptoms among ASD sub-groups is common and, as discussed below, has led to some difficulty in finding consistent symptomology across the entire ASD population.
1.2.4 Divergent behavioral findings in autism research
Social processing deficits in ASD are poorly understood in relation to diagnostic sub-groups as well as the known heterogeneity in symptomology. To add to this complexity, individuals within the same sub-group can express different subsets of reported symptoms, and differ in the severity of those symptoms. Consequently, the large body of extant studies on face processing in ASD has generated somewhat mixed results. Although researchers initially expected that people with ASD would present significant, overt deficits in the processing of faces and other social stimuli, it is now understood that social perception in autism is heterogeneous, resulting in widely varying reports of social impairment. Such highly conflicting results led to the conclusion in a recent review by Harms et al. (2010) that social perception in ASD depends on numerous factors, including the known heterogeneity in ASD in terms of symptom variability and severity, participant demographics (e.g., age, gender, etc.), experimental differences in stimuli and task demands, and the use of compensatory strategies in high-functioning individuals with ASD (Harms, Martin, & Wallace, 2010).
expressions with matching labels, there was no impairment in recognizing emotions (Grossman, Klin, Carter, & Volkmar, 2000). However, when faces were presented with mismatched labels, children with ASD had difficulty recognizing the emotions, indicating that the subjects had likely relied on the labels—perhaps even subconsciously—to facilitate emotion recognition.
Recent research has expanded on the findings related to top-down strategies in autism by exploring the import of shorter response windows for emotion recognition. Clark and colleagues (2008) reported that while individuals with ASD could extract emotional expressions from faces at long presentation durations as well as neurotypicals could, emotion recognition in the autism group was impaired at shorter presentation durations (Clark, Winkielman, & McIntosh, 2008). This suggests that, with longer presentation times, people with ASD might rely on higher-level cognitive skills to identify emotions, but that rapid, automatic processing is impaired. Taken together, these results indicate that some high-functioning individuals with ASD can compensate for social processing deficits by using top-down, cognitive strategies. However, it is important to note that the studies demonstrate that atypical strategies are limited in flexibility since they cannot be applied in uncommonly encountered situations.
perception tasks emphasizing featural processing. These findings indicate that atypical processing confers individuals with ASD an advantage in non-social perception tasks, which also extends to certain face perception tasks.
These differences in face processing may be explained by differences in the default style of processing employed by neurotypicals versus individuals with ASD (Krysko & Rutherford, 2009; Lahaie et al., 2006). While neurotypicals generally engage a configural style of face processing, there is evidence that in some situations, individuals with ASD use a local, more feature-based style as their default (Dawson et al., 2005). Some researchers have argued that in ASD, the face is examined and processed in terms of individual features rather than as a whole, perhaps through use of rule-based strategies. Particularly with respect to emotion processing, people with ASD may learn to recognize social cues by identifying rules that characterize specific facial features in an expression, such as raised corners of the mouth for happiness or a scrunched nose for disgust (Rutherford & McIntosh, 2006). In contrast to this explicit rule-based strategy, neurotypicals rely more often on a holistic, template-based strategy, processing the configuration of the entire set of facial features (Calder & Young, 2005). This is not to say that configural processing is entirely absent in individuals with ASD, as global processing can be engaged by other mechanisms such as attention cueing (Behrmann et al., 2006; Nishimura, Rutherford, & Maurer, 2008), but it does indicate that there is a bias among people with ASD for using local processing strategies as the default. Taken together, the results from these and other face processing tasks point to the likelihood that high-functioning individuals employ as their default a local, feature-based processing to process social information rather than the global, configural-based processing that is used by neurotypicals. This suggests that atypical processing and compensatory strategies can be used to partially counteract deficits in face processing and may help to explain the seemingly divergent results of previous research on ASD individuals.
1.2.5 Abnormal brain structure and connectivity in autism
connectivity between regions, or anomalies in several functionally related structures that can affect a number of cognitive processes and result in the behaviors commonly observed in people with ASD. Early abnormal overgrowth is found in regions underlying functions that are known to be impaired in autism, such as language, social skills, and cognitive skills. Courchesne (2004) reported abnormal overgrowth in both white and grey cerebral matter— particularly dorsolateral and medialfrontal regions—and white cerebellar matter. In addition, atypical growth of the cerebellum is believed to play a role in cognitive and motor dysfunctions that lead to the stereotyped behaviors and reduced exploration commonly reported in children with autism (Courchesne, 2004; Pierce & Courchesne, 2001). Bilateral amygdala enlargement and cerebellar and hippocampal enlargement have also been reported in young children (Courchesne, 2004) and older children (Schumann, 2004) with autism. In particular, the degree of enlargement in the amygdala is closely associated with the severity of impairment in social and communication skills (Munson, Dawson, Abbott, & Faja, 2006), including difficulty recognizing facial expressions (Bachevalier, 2006) and detecting eye gaze (Howard et al., 2000).
Regions that show overgrowth and enlargement in early childhood also show atypically slow growth as well as degeneration and volumetric loss later in life, in some cases. In adolescents and adults with autism, the structures comprising the limbic system—particularly the amygdala, hippocampus, basal ganglia, and prefrontal cortices—are most often implicated in symptoms related to social dysfunction (Uddin, Menon, Young, Ryali, & Chen, 2011). Amygdala dysfunction is known to contribute to disruptions in face perception, which includes decreased eye movements to key features of the face and a lack of orienting toward social and emotional information. However, the exact nature of this abnormality is unclear. For example, Howard et al. (2000) reported impairment in facial expression recognition associated with an increase in amygdala volume (Howard et al., 2000), whereas Nacewicz et al. (2006) found smaller than normal amygdalae in people with autism (Nacewicz et al., 2006).
Vander Wyk, 2011). Disruptions in STS function may drive some of the impairments related to social perception in autism, such as communication deficits involving speech perception and difficulty in understanding the intentions of others from movements of the eyes, mouth, and body.
There is increasing evidence that abnormal functioning of the cerebellum also contributes to motor and cognitive impairments in ASD. The cerebellum is a key brain structure for coordination of cognitive functions involving attention and perception. In children with autism, disruptions in cognitive functions are expressed behaviorally in a restricted range of interests, reduced exploration, and stereotyped behaviors—all three of which have been linked to cerebellar dysfunction (Pierce & Courchesne, 2001). Cerebellar function may similarly be compromised in adults with ASD, as there is evidence of increased cerebellar volumes (Sparks et al., 2002), as well as abnormal neuronal densities in this region in the form of decreased numbers of Purkinje cells (Belmonte et al., 2004).
processing are abnormal in individuals with ASD, and that these abnormalities likely contribute to impairments in face processing.
The role of the amygdala in ASD has also been given greater attention in recent years, as the amygdala’s function or connections may be compromised in autism (Adolphs, 2002; Baron-Cohen et al., 2000). In neurotypicals, the amygdala is an integral part of the cognitive network for processing social information, and modulates social processing by directing visual attention to salient features of the face (Adolphs, 1999; Brothers, 1990). It is therefore important to have a broader understanding of the role the amygdala plays in social processing, which will be discussed next.
1.2.6 The amygdala: a conductor of social attention
While the recognition and processing of social information in faces draws on multiple brain regions, the amygdala plays a particularly important part. According to Adolphs (2002), the amygdala serves an expansive role in face processing for neurotypicals through a number of mechanisms (Adolphs, 2002). First, the amygdala orients bottom-up attention to socially salient features of the face—such as the eyes or mouth—via feedback mechanisms to visual and attention areas (Amaral & Price, 1984). Modulation of these feedback pathways results in heightened perceptual processing of social stimuli as well as subconscious processing of emotional cues (Amaral, Behniea, & Kelly, 2003; Sander et al., 2005). That is, the amygdala attaches salience to visual input (Adolphs, 1999) and subsequently directs visual attention to the areas of the face that are most informative for further processing of social information. In addition to emotional cues, another salient cue is direct gaze, which elicits heightened activation in the amygdala compared to averted gaze (Kawashima et al., 1999), indicating that the amygdala plays a role in specific aspects of gaze processing.
interpretation of those emotions to form social judgments. Thus, through a variety of mechanisms, the amygdala influences attention to and processing of socially salient stimuli, which in turn influences the further processing of the information conveyed by faces.
Many aspects of social processing that are linked to healthy amygdala functioning are known to be compromised in ASD. Faces are less likely to draw the attention of people with autism, who show reduced orienting and attention to social stimuli (Dawson et al., 2004), less attention to the eye region (Dalton et al., 2005; Klin et al., 2002; Pelphrey et al., 2002), and impairments in processing social and affective information (Harms, Martin, & Wallace, 2010; Schultz, 2005), functions which are associated, at least in part, with amygdala function in neurotypicals. The exact nature of the dysfunction in ASD is unclear, but two plausible explanations include a failure of the amygdala to assign social saliency to faces (Aggleton, Burton, & Passingham, 1980), and a failure of the amygdala to signal feedback pathways that are necessary for processing social stimuli (Schultz, 2005). Nonetheless, while the specific impairments remain an open question, neuroimaging studies in people with ASD do support a general link between abnormal amygdala functioning and social processing impairments, reporting hypoactivation of the amygdala in a range of face perception tasks (Baron-Cohen et al., 1999; Pelphrey et al., 2011; Pierce, Müller, Ambrose, Allen, & Courchesne, 2001; Schultz, 2005). These findings highlighting the importance of the amygdala in social processing, and the impairments that can arise from abnormal functioning have been further validated in studies involving subjects with amygdala lesions.
1.2.7 Amygdala lesion studies
such as guilt, admiration, flirting, and arrogance—from both the whole face and from the eyes alone (Adolphs, Baron-Cohen, & Tranel, 2002). Amygdala lesion patients also have deficits in making social judgments regarding traits such as trustworthiness and approachability (Adolphs, Tranel, & Damasio, 1998). A study on a patient referred to as SM who has complete bilateral amygdala lesions found that her impairment in recognizing mental states arises from a failure to spontaneously orient to the salient parts of a face rather than from impaired ability to recognize the actual expression (Adolphs et al., 2005). When viewing facial expressions, the proportion of fixations that patient SM would direct to the eye region was atypically low regardless of the emotion. Furthermore, although her recognition of fear was significantly worse relative to controls, this impairment was reversed with a simple instruction to direct her gaze to the eyes.
The findings of the study with patient SM had several implications. First, the results indicated that the amygdala was not necessary for the recognition of emotions. The fact that lesion patients retain a basic capacity to identify basic emotions and show varying degrees of impairment means that there likely exist parallel or redundant pathways for social processing. This also suggests that feedback between those pathways may overlap. Second, the authors interpreted that, while patient SM’s gaze behavior was not spontaneous, deficits in emotion perception could be partially mitigated by active evaluation (Adolphs, 2006). The fact that patient SM’s recognition of fear could be reversed with top-down control meant that in addition to spontaneously orienting to emotional cues, people can also learn to actively examine faces in order to judge the emotion. These findings also demonstrate that there are multiple pathways for processing of social information.
1.3 Study Summary and Thesis Structure
In this thesis, I investigate how we arrive at the decision that we like a face and find it attractive. I use eyetracking and self-reported behavioral data to gain insight into the visual behavior that accompanies face gaze and preference decisions in people with autism and amygdala lesions. Along the way, I also explore the use of atypical face gaze strategies in high-functioning autism and amygdala lesion patients. To examine these topics, I utilized a variety of experimental paradigms and measures. In the first two studies, participants performed a 2-alternative forced-choice task. They made preference choices amongst pairs of social stimuli and pairs of non-social stimuli and indicated which image of the pair they preferred (eye gaze was recorded in the “Gaze Cascade” study). In the third study, participants viewed images presented individually on-screen as eye gaze was tracked, and they were instructed to avoid specific salient features of the face. Experiments and participants are summarized in Table 1.1.
Table 1.1. Summary of dissertation structure and participants in studies.
Study
Chapter
Participants
Eyetracking
Algorithm 2 ASD
Matched Controls
Amygdala Lesion
Matched Controls
Gaze
Cascade 3a 12 12 3 3
Familiarity
versus Novelty 3b 12 12 -- --
Don’t Look 4 12 13 3 3
objects. Based on this evidence, in the gaze cascade study I explored whether gaze contributes to social decision-making in autism in the same manner as it does in neurotypicals. That is, to what extent do social processing deficits impair preference judgments about faces? Moreover, do known deficits in objectively evaluating faces also interfere with the temporal evolution of those preference choices? In the second study, “Familiarity versus Novelty,” I examined whether intact social processing is necessary for forming a preference bias for familiar versus novel faces. Does a preference for familiar faces develop even in populations with diminished face expertise? In the third and final study, I investigated atypical face viewing strategies. There is evidence to indicate that people with autism—particularly those who are high functioning—compensate for social deficits by using compensatory viewing strategies, which give the general appearance of normal viewing behavior. Based on this evidence, I ask, if people with social processing deficits use atypical face gaze strategies, to what extent are these strategies flexible across different situations (i.e., task demands)? Are they flexible enough to resemble neurotypical viewing behavior even in situations that are not commonly encountered?
My thesis is organized in the following structure. In Chapter I, I discuss social processing in healthy controls and individuals with autism, particularly as it relates to faces and the key brain structures involved in face processing. One of the vital structures that I reviewed is the amygdala, which plays an important role in identifying socially salient information in the environment, and whose function may be compromised in social disorders such as autism. I also discuss sources of heterogeneity in autism that have led to divergent results, underscoring the necessity of developing new ways of identifying and classifying subtypes of autism in the future.
In Chapter III, I present the results of two studies examining face preference in which we tested two clinical populations: autism patients and amygdala lesion patients. The first study investigates the link between gaze and face preference formation in autism and amygdala lesion patients, and the second study investigates preference decisions for familiar versus novel faces in autism. I found that individuals with autism and amygdala lesions made similar preference choices as controls in judging face attractiveness and that people with autism demonstrated a similar, yet faster, visual sampling process compared to controls. The second study in Chapter III looks at whether social processing deficits affect preference biases for familiar faces over novel faces. We found intact familiarity preferences for faces and novelty preferences for social stimuli in individuals with ASD.
In Chapter IV, I study face viewing strategies decoupled from explicit decision-making in controls and the same two clinical populations—ASD and amygdala lesion patients—and I manipulate face viewing strategies by instructing participants to avoid socially-salient features of the face. I found that individuals with autism exhibit atypical face gaze—and, unlike controls—inflexible viewing strategies. Moreover, amygdala lesion patients showed hints of more subtle abnormalities in face gaze.
C h a p t e r I I
A CUSTOM ALGORITHM FOR ANALYSIS OF EYETRACKING DATA
2.1 Overview
Eye movements constitute an objective reliable measure of where a person’s attention is directed, and as such we can use eye movement recordings as a quantifiable measure of visual and attentional processes involved in social processing tasks. Eye-tracking metrics, such as the number of fixations people make on a feature, or the total dwell time in a region, provide information about what elements of a stimulus attract the most attention, require more processing, or provide the most relevant information. The metrics that are derived from eye-tracking data, however, are highly dependent upon the choice of parameters that are used to define and extract the various eye movements from the raw data, for example, the minimum duration for a fixation, or what amount of spread to allow in successive data points before dividing a fixation into two. Different tools have been developed for the collection and analysis of eye-tracking data. Most commercial eye-tracking systems also come with their own analysis software, and there are many open-source packages available online as well. Unfortunately, commercially-available analysis software cannot be modified beyond a set number of parameters. Beyond this, there is a great deal of processing that occurs in the data collection stage and in the analysis stage that is not easily accessible to the user. Furthermore, the software cannot be modified or used to analyze data collected across different platforms.
applied, without the addition of any steps that were unnecessary for our analysis, and the parameters used. Additionally, I understand the necessity of every step of the process from input to output and can explain exactly why my data looks the way it does.
2.2 Introduction
Eye-tracking research has been growing in popularity in recent years, with researchers using the method to study a variety of visual and cognitive processes including reading, scene perception, face processing, and decision-making. This chapter will introduce a custom algorithm developed for analyzing eyetracking data used in the current study. The algorithm uses a combination of velocity and acceleration thresholds to detect fixations and saccades, and implements filters to address noise and loss of signal in the data stream. We also employ a data-driven methodology to derive threshold values. Many commonly-available software packages, including commercially-available software such as Eyelink and Tobii systems, and open-source codes, use combinations and variations of the methods used in the algorithm we describe here. By testing and tuning each of the individual subcomponents, I gained an understanding of their limitations, and also some insights into the technique of eyetracking itself. The final algorithm thus has components selected and calibrated specifically for my research goals, equipment characteristics, and subject population. This flexible, straight-forward analysis pipeline is suitable for analyzing that data collected across different platforms and in different eye-tracking tasks, and can be further modified and expanded upon based on analysis needs.
In describing the algorithm, I will first review and define various types of eye movements described in the literature. Second, I will discuss the current methods being used to analyze eyetracking data as well as advantages and limitations of those techniques, and finally, I will describe the custom algorithm I developed based in an effort to address some of these limitations. All the eye-tracking data in this thesis have been analyzed using this custom algorithm.
2.3 Defining and Identifying common eye movements
2.3.1 Fixations
and begins to process this information (Irwin, 2004), and as such, fixations are regarded as a metric that can be associated with a number of cognitive functions, including a person’s interest, attention, and processing strategies for visual stimuli. Surprisingly, there is no formal consensus as to how fixations should be mathematically defined, though nearly all definitions require that the point of gaze remain in a small spatially restricted area for some minimum amount of time (Lowenthal, 2007). There is little agreement under this definition as to what the specific duration and spatial restrictions should be since there is a range of variability in these measures depending on factors such as task demands, subject population, and the analysis methods that are used derive them. As a result, the specific values are predominantly determined by experimenter preference, the type of study, and the nature of the stimuli. A review of major eye-tracking studies shows that the temporal restrictions generally range from 50 to 500 milliseconds, and spatial restrictions range between one-half of a degree to five degrees of visual angle.
The range of values reflects the range of reasons that researchers use eye-tracking equipment. For researchers interested in oculo-motor mechanisms, even the smallest displacements or pauses may have significance, signifying a series of short fixations in a small region. However, for researchers interested in the visual information that is being gathered by an observer, the sustained inspection of a particular visual detail could be considered a single fixation, even if it involves many tiny movements. This underscores the importance of tuning eye movement algorithms to ones research goals, rather than simply using a generic “industry standard.”
2.3.2 Saccades
velocity threshold, and in some cases, a concurrent acceleration threshold. Periods during which one or both of these thresholds are surpassed are classified as saccades.
2.3.3 Other eye movements
While fixations and saccades are the primary types of eye movements, there are other types of eye movements, such as smooth pursuit movements, glissades, and blinks (Nyström & Holmqvist, 2010; Purves, 2012). Typically, however, not all movements are relevant to the specific research questions of interest, so algorithms are constructed such that they filter only the types of eye movements that are of interest. Remaining eye movements are classified as either saccades or fixations depending on the choice of thresholds.
2.4 Critical Data Processing Filters and What They Do
2.4.1 Measures used in event detection
A
B
Figure 2.1. Examples of raw eye gaze traces for the x and y position of the right eye recorded at (A) 250 Hz and (B) 500 Hz.
The combination of filters that are implemented and the threshold settings used can dramatically impact the output returned by eye-tracking algorithms, affecting the accuracy of virtually all metrics that are collected (Blignaut, 2009; Shic, Chawarska, & Scassellati, 2008). For example, velocity or acceleration thresholds that are too high can result in short saccades being categorized as part of a fixation. If this occurs, multiple fixations are merged and reported as a single fixation. On the other hand, thresholds that are too low result in noise being categorized as saccades, which will incorrectly break up fixations into multiple smaller ones and even discard them completely. As such, any conclusions drawn from this data would be invalid.
2.4.2 Addressing data quality
Gaze position data contains noise and gaps that must be filtered out in order to get valid and interpretable results. If it remains in the data, noise will negatively affect both the accuracy and
0 200 400 600 800 1000 1200 1400 1600 1800
Time
Position
0 200 400 600 800 1000 1200 1400 1600 1800
Time
Position
[image:44.612.105.526.133.363.2]precision of measurements by introducing false position coordinates or erroneous gaps that affect the accurate measurement of fixations and saccades. Noise can be introduced from various sources, including participant movement, the experimental setting, as well as eye-tracking hardware and software. To mitigate the effect of noise on the data analysis, two different types of filters are commonly used: the first seeks to fill in short gaps of missing position data and the second to reduce noise.
Noisy or ‘flickery’ data (i.e. meaning data containing gaps in the data stream during which the signal was lost) leads to incorrect classification of saccades, affecting both fixation duration and fixation number (Wass, Smith, & Johnson, 2012). If a long fixation is incorrectly split into two smaller ones, and both parts of the fixation are above the minimum duration, the single long fixation will be reported as two short fixations. As a result, the average duration calculation will be shorter and the average number of fixations will be greater than is actually the case. If one or both fixations are below the minimum duration, they would be discarded, resulting in calculations showing shorter and less frequent fixations.
2.4.2.1 Gap fill-in and blink detection
in the middle of the gap is equally weighted by both valid samples, and is equal to the average of the two samples.
A
[image:46.612.116.531.154.390.2]B
Figure 2.2. Eye gaze traces showing (A) raw gaze data recorded at 500 Hz, and (B) gaze data after gap interpolation has been performed. Gaps are selectively filled based on duration. Note that the smaller gaps (just before 500 ms, at 1500 ms, and at approximately 1750 ms) due to signal loss in (A) have been filled in the traces in (B), but the larger gaps (250-570 ms, and at approximately 1600 ms), which are blinks or gaps that are too large to interpolate without compromising data quality, have been retained.
Blinks also appear as gaps in the data, usually as points where the gaze coordinates and/or pupil size is 0. Gaps due to blinks are longer than those due to hardware or software malfunction, lasting at least 100 milliseconds (Olsen, 2012). For our purposes, we retain blinks as valid gaps rather than interpolate them, so that a fixation interrupted by a blink will be registered as two distinct fixations. To avoid interpolating missing data caused by blinks, the maximum gap duration parameter is chosen so that it is shorter than the duration of a normal blink, roughly 100 milliseconds (Stava, Huffman, Baker, Epstein, & Porter, 1994; VanderWerf, 2003). Gaps that are shorter than this parameter are interpolated, and gaps that are longer remain in the data.
0 500 1000 1500 2000 2500
0 200 400 600 800 1000 1200 1400 1600 1800 Time Position
0 500 1000 1500 2000 2500
0 200 400 600 800 1000 1200 1400 1600 1800 Time Position
x raw position y raw position
2.4.2.2 Noise reduction
Noise is a significant issue affecting data quality, particularly for high frequency recordings, due to the large number of samples collected per unit of time. However, there is an advantage with high-frequency recordings in that noise can be detected and smoothed with less modification to the data than in low frequency recordings. Noise in the position data artificially increases the distance traveled by the eye from one sample to the next. As a result, the calculated velocity is also artificially inflated, and appears as random spikes in the velocity data stream.
A
B
C
Figure 2.3. Sample gaze data showing the stages of filtering used to address data quality. (A) shows the raw gaze data, (B) shows the same data after gap interpolation, and (C) shows the effect of smoothing interpolated gaze data by applying an “rLOESS” filter for noise reduction.
A symmetric moving window is iterated through the data stream, and the center point in this window is replaced by the new smoothed value. There are several options for how to define the size of this window. Matlab offers the option of setting window size equal to a predefined percentage of the total number of data points. However, the disadvantage of this method is that, all other things being equal, trials of different length will receive different degrees of smoothing. An alternative method is to set the window size equal to a specific number of samples. This, however, leads to different degrees of smoothing when sampling frequency
0 500 1000 1500 2000 2500
0 500 1000 1500
Time
Position
0 500 1000 1500 2000 2500
0 500 1000 1500
Time
Position
0 500 1000 1500 2000 2500
0 500 1000 1500
Time
Position
x raw position y raw position
x interpolated y interpolated
[image:48.612.125.526.123.452.2]differs. To allow for comparison of fixation data recorded at different frequencies, we specify a window duration, which is then converted to a specific number of data points before being passed to the Matlab filter. With this approach, a greater number of points are used for smoothing data recorded at a higher frequency, an approach that addresses the larger amount of noise in high versus low frequency recordings.
2.4.3 Separating events (fixations and saccades)
2.4.3.1 Velocity and acceleration calculation
Velocity and acceleration are the measures most often used by common algorithms to define fixations and saccades. While Tobii systems use only a velocity calculation, the Eyelink system uses a combination of both in their algorithm.
In our algorithm, a velocity value and acceleration value is computed for each timepoint in the data stream. Calculating velocity between two consecutive points could potentially introduce a large amount of noise into the data, particularly for higher frequency recordings. Thus, we calculate velocity and acceleration for each point as an average of the neighboring points in a symmetric window, with the point of interest positioned in the middle. This method is similar to the approach used in Tobii systems (Olsen, 2012).