www.hydrol-earth-syst-sci.net/11/1683/2007/ © Author(s) 2007. This work is licensed under a Creative Commons License.
Earth System
Sciences
Controls on runoff generation and scale-dependence in a distributed
hydrologic model
E. R. Vivoni1, D. Entekhabi2, R. L. Bras2, and V. Y. Ivanov3
1Dept. of Earth and Environmental Science, New Mexico Institute of Mining and Technology, Socorro, NM 87801, USA 2Dept. of Civil and Environmental Engineering, Massachusetts Institute of Technology, Cambridge, MA 02139, USA 3Dept. of Civil and Environmental Engineering, University of Michigan, Ann Arbor, MI 48109, USA
Received: 13 April 2007 – Published in Hydrol. Earth Syst. Sci. Discuss.: 2 May 2007 Revised: 28 September 2007 – Accepted: 11 October 2007 – Published: 18 October 2007
Abstract. Hydrologic response in natural catchments is con-trolled by a set of complex interactions between storm prop-erties, basin characteristics and antecedent wetness condi-tions. This study investigates the transient runoff response to spatially-uniform storms of varying properties using a distributed model of the coupled surface-subsurface system, which treats heterogeneities in topography, soils and vege-tation. We demonstrate the control that the partitioning into multiple runoff mechanisms (infiltration-excess, saturation-excess, perched return flow and groundwater exfiltration) has on nonlinearities in the rainfall-runoff transformation and its scale-dependence. Antecedent wetness imposed through a distributed water table position is varied to illustrate its ef-fect on runoff generation. Results indicate that transitions observed in basin flood response and its nonlinear and scale-dependent behavior can be explained by shifts in the surface-subsurface partitioning. An analysis of the spatial organi-zation of runoff production also shows that multiple mecha-nisms have specific catchment niches and can occur simul-taneously in the basin. In addition, catchment scale plays an important role in the distribution of runoff production as basin characteristics (soils, vegetation, topography and initial wetness) are varied with basin area. For example, we illus-trate how storm characteristics and antecedent wetness play an important role in the scaling properties of the catchment runoff ratio.
Correspondence to: E. R. Vivoni ([email protected])
1 Introduction
The response of natural catchments to precipitation depends on the mechanisms of runoff generation and their spatial and temporal distribution. Nevertheless, quantitative descriptions of distributed runoff generation are difficult to acquire in field settings. To address this, a number of distributed hy-drologic models have been developed to represent multiple runoff mechanisms and their variability in a catchment (e.g., Smith and Hebbert, 1983; Abbott et al., 1986; Ogden and Julien, 1993; Paniconi and Wood, 1993; Wigmosta et al., 1994; Garrote and Bras, 1995; VanderKwaak and Loague, 2001; Ivanov et al., 2004a; Rigon et al., 2006). To date, how-ever, limited attention has been placed on model analyses that identify the spatiotemporal variability of runoff gener-ation and its underlying causes. Few studies have quantified runoff partitioning into the surface and subsurface mecha-nisms that arise from interactions of a distributed groundwa-ter table and variably-saturated catchment surface. Under-standing runoff production in these complex settings is criti-cal for identifying the mechanisms for flood generation, and its features (e.g., magnitude, timing, volume). More impor-tantly, flood characteristics and their scale-dependence may be linked to the runoff mechanisms excited as rainfall proper-ties interact with variable basin characteristics and pre-storm wetness conditions.
identify nonlinearity and scale effects in the simulated flood response and their relation to the underlying runoff mech-anisms simulated in the basin. The nonlinearity in catch-ment response refers to the observation that a unit increase in rainfall may not produce an equivalent increase in mea-sured runoff. Numerous studies have recognized that catch-ment runoff response can be highly nonlinear (e.g., Bet-son, 1964; Caroni et al., 1986; Troch et al., 1993b; Ris-bey and Entekhabi, 1996). Nonlinearity is potentially re-lated to the runoff mechanisms operating in a basin, which have been shown to affect flood frequency (Sivapalan et al., 1990; Robinson and Sivapalan, 1997). A possible cause of the observed runoff nonlinearity is the difference in response times between surface and subsurface flows. Surface runoff is a quick response as infiltration is significantly reduced due to soil properties or saturated conditions, while subsurface runoff can be much slower as subsurface flow paths may sub-stantially delay travel toward the channel network. Previous studies have identified that transitions in runoff mechanisms can be controlled by rainfall properties, such as storm du-ration and intensity (e.g., Larsen et al., 1994; Menabde and Sivapalan, 2001). Nevertheless, antecedent wetness condi-tions imposed by the water table position after long inter-storm periods should also have an important effect on transi-tions between surface and subsurface mechanisms.
In addition to influencing runoff nonlinearity, surface and subsurface mechanisms may impart a signature on the runoff scale-dependence, which refers to the effect of catchment area (or size) on runoff properties. Numerous studies have shown that discharge may exhibit stronger or weaker depen-dence on scale as area increases, depending on the hydrologic processes in the basin (e.g., Goodrich et al., 1997; Morrison and Smith, 2001). Both antecedent wetness and storm prop-erties, through forcing particular runoff mechanisms, may also create differences in flood characteristics at different scales. The scaling properties of interest in the runoff re-sponse include the flood peak magnitude, time to peak and volume. In small catchments, the short response times rel-ative to storm duration can lead to contributions from sur-face and subsursur-face runoff to the overall basin response. As catchment scale increases, storm duration is shorter than the response time from each mechanism, thus leading to time-varying partial contributions from various mechanisms (e.g., Sivapalan et al., 2002). Thus, flood characteristics are antici-pated to result from the interrelationship of runoff processes with multiple time constants and basin size. An important question is whether the catchment runoff ratio exhibits scale-dependence and if this is linked to the runoff mechanisms excited at particular basin scales.
In this study, we utilize the “TIN-based Real-time Inte-grated Basin Simulator” (tRIBS) (Ivanov et al., 2004a) with spatially-uniform forcing to identify the surface and subsur-face runoff mechanisms occurring in a complex basin. The numerical model is used as an interpretive tool for address-ing the control exerted by storm properties and antecedent
wetness on the distributed basin response. In the experi-ments, variations in rainfall duration and intensity are used to mimic characteristic storms, while initial wetness conditions are altered by imposing a distributed water table at different baseflow levels. The distribution of initial soil water con-tent in the unsaturated zone corresponds to hydraulic equi-librium and explicitly depends on the initialized water table position. Within the model construct, we seek to identify if exciting a range of different runoff mechanisms with inher-ent variations in response time, magnitude and spatial orga-nization can explain runoff nonlinearity. Furthermore, we at-tempt to understand how basin heterogeneities interact with storm characteristics to create favorable sites for runoff pro-duction. If persistent catchment niches exist for runoff gener-ation, then the scale-dependence of flood properties may be related to how runoff partitioning changes with basin area. As basins grow in size, the heterogeneous mix of catchment characteristics varies, possibly leading to predictable patterns in runoff production. Understanding the effects of runoff par-titioning on catchment response at various scales is important to advance our capability to predict behavior in ungauged basins.
2 Coupled surface-subsurface distributed model
tRIBS is a continuous, physically-based, fully-distributed model designed for hydrologic research and forecasting (Ivanov et al., 2004a). The model provides a spatially-explicit treatment of basin heterogeneities in topography, soils and aquifer properties, vegetation and atmospheric forc-ing. As in grid models, runoff production and routing are tracked over complex terrain captured by individual nodes. In tRIBS, Voronoi polygons (control volume associated with a given TIN node) uniquely associated with a triangulated irregular network (TIN) are used as a finite-volume domain for mass balance and flux computations (Tucker et al., 2001). In the following, we present a brief discussion of the model physics, emphasizing those components most relevant to un-derstanding the coupled surface-subsurface basin response. The reader is referred to Ivanov et al. (2004a) for additional details and discussions of model limitations.
2.1 Model domain representation
through geomorphic relations to contributing area (Ivanov et al., 2004b). The soil profile and shallow aquifer are bounded by a spatially distributed bedrock assumed to be an imper-meable surface. A shallow aquifer interacts with the stream network and land surface to produce saturated areas that ex-pand and contract (e.g., de Vries, 1995; Lamb et al., 2000). 2.2 Coupled unsaturated and saturated dynamics
Basin hydrologic response requires an appropriate depiction of the two-way interaction between surface and subsurface processes. The model accounts for moving infiltration fronts, water table fluctuations and moisture losses due to evapotran-spiration and groundwater drainage. Each element consists of a sloped column of heterogeneous, anisotropic soil with an exponential decrease in saturated hydraulic conductivity (e.g., Beven and Kirkby, 1979; Beven, 1982):
KSi(z)=Koiexp(−f z), (1)
whereKSi(z)is the saturated hydraulic conductivity at depth zin the normal or parallel directions (i=norp),Koi is the saturated hydraulic conductivity at the soil surface (z=0), and f is a hydraulic conductivity decay parameter. A kinematic approximation for unsaturated flow is used to compute in-filtration and propagate moisture fronts in the soil column (Cabral et al., 1992; Garrote and Bras, 1995; Ivanov, 2002). The unsaturated moisture profile is determined from hydro-static equilibrium using the Brook and Corey (1964) param-eterization as:
θ (z)=θr +(θs−θr)
ψb z−Nwt
λo
, (2)
whereθ (z) is the soil moisture at depthz, θr andθs are the residual and saturation soil moisture contents,Nwtis the depth to the local water table,9b is the air entry bubbling pressure andλois the pore-size distribution index (Ivanov et al., 2004a).
Coupled to the vertical dynamics is lateral moisture redis-tribution in the vadose zone and shallow aquifer driven by gradients in surface and groundwater topography. In the un-saturated zone, horizontal flow between contiguous elements is computed over the saturated wedge and along the steepest direction. In the shallow aquifer, a quasi-three-dimensional model based on the Dupuit-Forchheimer approximation re-distributes groundwater from recharge zones to discharge ar-eas. Lateral exchanges between elements are controlled by hydraulic gradient as:
QS = −T wtanβw, (3)
whereQSis the groundwater outflux,wis the flow width, tan βwis the local water table slope andT is the depth averaged aquifer transmissivity:
T =arKon f
exp(−f Nwt)−exp(−f D)
, (4)
whereD is the bedrock depth andar is the anisotropy ra-tio (Kop/Kon). Water table dynamics are computed from groundwater fluxes, vertical recharge and exfiltration. Over-all, the water table position anchors the soil moisture profile and determines regions of saturation prior to a storm. 2.3 Runoff generation processes
The coupled nature of the unsaturated and saturated pro-cesses results in a robust set of runoff mechanisms. Four basic runoff types are simulated in the tRIBS model: infiltration-excess runoff (RI) (Horton, 1933), saturation-excess runoff (RS)(Dunne and Black, 1970), groundwater exfiltration (RG)(Hursh and Brater, 1941), and perched re-turn flow (RP)(Weyman, 1970). Total runoff (R)is com-posed of the four production mechanisms:
R=RI +RS+RP +RG, (5)
whereRI+RS andRP+RG are the surface and subsurface components. Infiltration- and saturation-excess runoff are rapid surface responses as infiltration is limited by soil con-ditions, while perched return flow and groundwater exfiltra-tion are slower mechanisms as subsurface flow delays the re-sponse to rainfall. Over complex terrain, the occurrence and frequency of runoff generation depends on the spatiotempo-ral characteristics of catchment topography, soils, climate, rainfall and antecedent wetness. Given this variability, it is recognized that watershed response can correspond to runoff production from multiple mechanisms arranged in spatially distinct areas or possibly due to a single dominant type in the basin (e.g., Freeze, 1974; Dunne, 1978; Smith and Heb-bert, 1983). Runoff production from multiple mechanisms will vary with the rainfall and landscape factors influencing the coupled unsaturated-saturated dynamics.
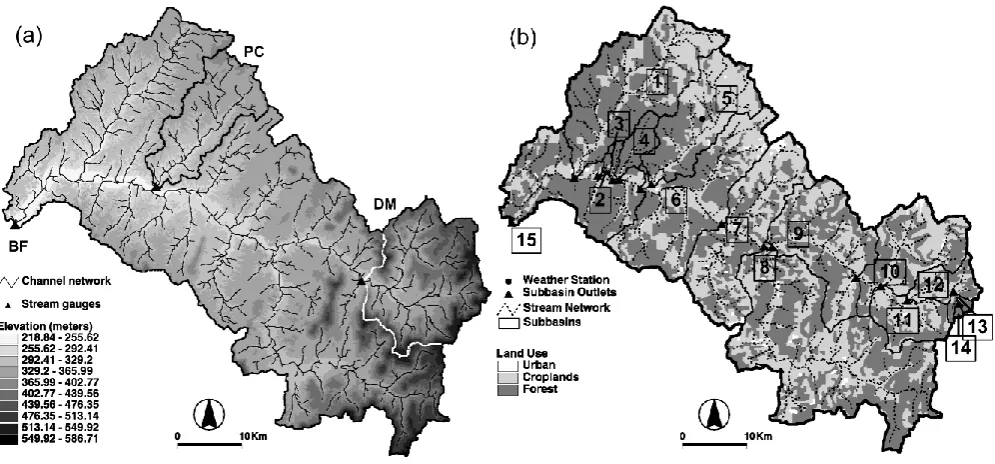
Fig. 1. Model representation of catchment topography and land cover. (a) TIN model including stream network and gauging stations for
Baron Fork (BF, outer basin), Peacheater Creek (PC, black inner basin), and Dutch Mills (DM, white inner basin). (b) Spatial distribution of land cover (urban, forest, grassland) with the subbasin outlet locations and the weather station.
2.5 Hillslope and channel flow routing
Runoff generated at each element is routed across an individ-ual hillslope overland flow path and then through the chan-nel network. The hillslope paths are defined over the edges of the triangular facets that connect a node to the closest downstream stream node (Tucker et al., 2001). A nonlinear relation is used to determine velocity over a hillslope path (Ivanov et al., 2004a):
vh=cv
Q
Ah r
, (6)
wherevh is the hillslope velocity, Ah is the upslope con-tributing area, Qis the discharge at the downstream chan-nel node, andr andcv are spatially-uniform parameters of the velocity relation. Thus, overland travel time (th=lh/vh) is a function of discharge (Q)and hillslope path length (lh). Overland flow from multiple hillslope nodes serves as lat-eral inflow into a kinematic wave, one-dimensional routing scheme solved in the channel network (Ivanov et al., 2004a). Channel travel time (tc=vc/ lc)depends on the channel link distance (lc)and the discharge (Q=vcAc)through each link. For a wide, rectangular channel (Ac=bH), discharge for each link is:
Q=1 nS
1/2H5/3b, (7)
wherenis the Manning coefficient,Sis the channel slope,b is the channel width, andHis the water depth. As overland
travel time is faster than groundwater pathways, the parti-tioning of precipitation into surface and subsurface flow is critical for determining the basin response.
3 Hydrometeorological observations and catchment simulations
We investigate the effects of storm properties and antecedent catchment wetness on basin response through the use of tRIBS in a complex, humid watershed in northeastern Ok-lahoma. The basin is well-suited for investigating the rela-tion between runoff mechanisms and flood response due to a spatially-variable groundwater table that reacts quickly to rainfall (Imes and Emmett, 1994; Sloan, 2000). Furthermore, the Springfield Plateau aquifer provides baseflow discharge throughout the year. Large flood occurrences are typically due to mid-latitude frontal storms during early fall and late spring (Bradley and Smith, 1994; Michaud et al., 2001). 3.1 Study catchments
Table 1. Catchment runoff ratio (8=R/P, dimensionless) and spe-cific discharge (qs=Q/A, in mm) for selected events (labeled 1, 2
and 3 in Fig. 2) during April–May 1999 for the three stream gauges in the Baron Fork watershed. Basin-averaged rainfall depths in the Baron Fork are 34.05 mm, 35.11 mm and 60.51 mm for events 1, 2, and 3, respectively.
BF DM PC
(808 km2) (107 km2) (65 km2)
Runoff Ratio (8)
Event 1: 2–5 April 1999 0.21 0.38 0.08
Event 2: 22–24 April 1999 0.11 0.17 0.06
Event 3: 4–5 May 1999 0.61 0.68 0.41
Specific Discharge (qs, mm)
Event 1: 2–5 April 1999 6.86 12.95 2.60
Event 2: 22–24 April 1999 3.85 5.83 1.96
Event 3: 4–5 May 1999 36.82 41.20 24.53
while surface soil texture is silt loam (94%) and fine sandy loam (6%). The channel network has a maximum length of 67.3 km and a mean drainage density of 0.86 km−1. Chan-nel geometry is parameterized using geomorphic relations from Carpenter et al. (2001). In addition to the gauging sites, twelve (12) ungauged interior basins were delineated to represent a range of catchment area,A=0.78 to 808 km2 (Fig. 1b). Several studies have focused on the Baron Fork due to its unregulated nature, high stream gauge density and long time series of radar rainfall data (e.g., Johnson et al., 1999; Smith et al., 2004a).
3.2 Rainfall and streamflow observations
Hydrologic measurements in the catchment consist of three USGS gauges (BF, PC, DM), overlapping NEXRAD radars and one meteorological station (Fig. 1b). In the basin, gauge-corrected radar is a reliable source of hourly (4-km by 4-km) precipitation data (e.g., Smith et al., 1996; Young et al., 2000; Grassotti et al., 2003). The mean annual rainfall of 1240 mm is distributed in two wet periods (March to June; Septem-ber to NovemSeptem-ber). Over the years 1993 to 2000, the mean areal rainfall in the Baron Fork varied from light rain (e.g., less than 1 mm/h for one hour) to intense storms (e.g., greater than 20 mm/h over 6 h). The variability in rainfall duration, intensity and spatial distribution, in addition to prior wet-ness in the basin, leads to a complex runoff response during storms (Smith et al., 2004b). Multiple runoff mechanisms occur due to the heterogeneity in basin properties and lead to flood hydrographs of varying magnitudes (Finnerty et al., 1997; Carpenter et al., 2001; Ivanov et al., 2004b).
[image:5.595.53.283.142.259.2]Large flood events in the basin have a tendency to occur in early fall and late spring due to frontal storms (Bradley and Smith, 1994). As an example, Fig. 2 shows rainfall and runoff observations for April–May 1999. For each indicated event, Table 1 presents the runoff ratio (8=R/P, whereR
Fig. 2. Nonlinearity and scale effects in basin response from NEXRAD-based mean areal rainfall (mm/h) and USGS observed discharge (m3/s) at the BF (light gray), DM (dark gray) and PC (black) catchments over the spring period, 1 April 1999 to 22 May 1999.
andP are the event runoff and rainfall volumes). The ob-servations depicted here provide an indication of the runoff magnitudes and the effects of catchment scale on the basin response. For example, the maximum flood for 1999 oc-curred on 4–5 May (event 3) with discharges of 351, 206 and 12 m3/s in the BF, DM and PC basins. The high flood magnitude resulted from wet antecedent conditions, as evi-denced by the high baseflow prior to the event. Pre-storm wetness is also reflected in high runoff ratios (8=0.41 to 0.68). In contrast, a storm of similar magnitude in 22–24 April (event 2) led to a weaker runoff response and lower runoff ratio (8=0.06 to 0.17). Prior to this event, the an-tecedent wetness and baseflow in the basin were low due to a long interstorm period. Similarly, the runoff response during 2–5 April (event 1) was weaker than the annual flood. Nev-ertheless, the runoff ratio for each basin (8=0.08 to 0.21), was higher than for event 2 despite having similar rainfall volumes and a lower rainfall peak.
As illustrated in this example, the interactions between storm properties and antecedent wetness are expected to par-tially explain the observed nonlinearity in flood response with respect to rainfall. Systematic variations in the runoff ratio among the nested basins also reveal scale-dependence due to internal differences in basin runoff dynamics. These limited observations, however, do not allow rigorous study of the runoff nonlinearity and scale-dependence as a function of storm and initial wetness conditions. In this study, we ad-dress this observed behavior through numerical experiments designed to identify the effects of storm conditions and an-tecedent wetness on the simulated rainfall-runoff processes. 3.3 Hydrologic model calibration and verification
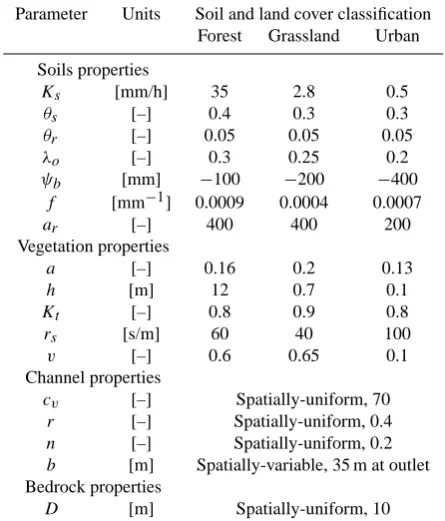
Table 2. Distributed model parameters for the Baron Fork obtained
from the multiple year calibration and verification procedure de-tailed in Ivanov et al. (2004b).
Parameter Units Soil and land cover classification Forest Grassland Urban Soils properties
Ks [mm/h] 35 2.8 0.5
θs [–] 0.4 0.3 0.3
θr [–] 0.05 0.05 0.05
λo [–] 0.3 0.25 0.2
ψb [mm] −100 −200 −400
f [mm−1] 0.0009 0.0004 0.0007
ar [–] 400 400 200
Vegetation properties
a [–] 0.16 0.2 0.13
h [m] 12 0.7 0.1
Kt [–] 0.8 0.9 0.8
rs [s/m] 60 40 100
v [–] 0.6 0.65 0.1
Channel properties
cv [–] Spatially-uniform, 70 r [–] Spatially-uniform, 0.4
n [–] Spatially-uniform, 0.2
b [m] Spatially-variable, 35 m at outlet Bedrock properties
D [m] Spatially-uniform, 10
to soils and vegetation types (e.g., Rawls et al., 1982; Bras, 1990). Calibration is focused on a limited number of parame-ters to which the model is most sensitive within narrow, phys-ically plausible ranges. Table 2 presents the set of calibrated model parameters derived from Ivanov et al. (2004b). Spatial parameter variability is captured by the use of soil and vege-tation classes where within-class parameter variations are not allowed. For this study, as in Ivanov et al. (2004b), the spatial variability of soils and vegetation are overlapping and corre-spond to forest, grassland and urban classifications. In this manner, the potential for over-parameterization is reduced and the overall strengths of the distributed approach (e.g., capturing spatial variability) are highlighted.
Ivanov et al. (2004a, b) present an analysis of the model performance in the Baron Fork during a long-term simula-tion in terms of discharge at the gauging stasimula-tions and the dis-tribution of hydrologic states in the basin. NEXRAD rainfall data from Smith et al. (2004a) and weather data from Maurer et al. (2002) were used to force the distributed model over separate calibration and verification periods (see Smith et al., 2004a). Results indicate that model simulations capture the flood response at the gauging stations and reproduce the ob-served nonlinearities in the rainfall-runoff dynamics via the multiple runoff mechanisms. Spatial distributions of runoff production also illustrated the topographic, soils and
veg-etation controls on basin response, although data to verify the predicted patterns are unavailable for the area. Overall, Ivanov et al. (2004b) obtained a robust parameter set for the basin through the multi-year application with radar rainfall forcing.
3.4 Numerical simulations of catchment response
The spatiotemporal variability in catchment response and its relation to runoff generation mechanisms is explored in this study through a set of numerical simulations. Given the calibrated model parameter set, the sensitivity of the basin runoff response is assessed as a function of the initial dis-tributed water table position and storm event properties (du-ration, tr, and intensity, i). For the experiments, a set of discrete, spatially-uniform storm events are used as model forcing as our objective is to identify nonlinearity and scale effects in the flood response and its relation to underlying runoff mechanisms. Our analysis considers the total runoff response consisting of both the baseflow and stormflow con-tributions. Selected storm durations and intensities represent conditions leading to flooding in the Southern Great Plains (Michaud et al., 2001). We focus on flood events in the fall period to minimize effects from snowmelt that may induce antecedent wetness not related to the water table position. In addition, the impact of evapotranspiration is reduced during the autumn due to tree leaf-fall and low atmospheric demand. Moisture conditions in the basin during the fall period are a strong function of the interannual fluctuations in summer rainfall. We capture this interannual variability through the different initial water table states corresponding to pre-storm baseflow levels. In this manner, rainfall forcing in the fall is applied to the expected baseflow conditions given possible amounts of summer precipitation.
4 Results and discussion
Numerical simulations of basin response to uniform rainfall are discussed with respect to the variations in the antecedent wetness and storm properties. Model predictions of hydro-logic response are related to the underlying runoff mecha-nisms and to catchment scale. Both spatially-averaged and distributed metrics are used to quantify surface-subsurface interactions and their impact on the basin response. Prior to describing the response to storm forcing, we present the an-tecedent conditions imposed by a set of initial groundwater distributions.
4.1 Role of antecedent groundwater conditions in nonlin-earity and scale-dependence
groundwater table position relative to the surface topography determines basin conditions, including: (1) the location and extent of saturated areas near channels, hillslope hollows or riparian zones; (2) the partitioning of rainfall into distinct runoff mechanisms associated with exceeding soil storage capacity; and (3) the moisture conditions and evapotranspi-ration rate within the upper most soil layers. As a result, determining the basin response to rainfall using a coupled surface-subsurface model requires appropriate treatment of the initial water table position. Here, we study the effect of water table depth on the catchment response by selecting three groundwater table positions that represent a range of initial baseflow states. Furthermore, we quantify the spatial variability, temporal evolution and scale-dependence of the antecedent wetness in the catchment.
To initialize the model, both the saturated zone thickness and soil moisture profile must be specified. As shown in Eq. (2), the initial moisture profile θ(z) is determined en-tirely by the soil hydraulic properties and the depth to water table (Nwt). Ivanov et al. (2004a) describe a method for con-structing an initial groundwater distribution based on the to-pographic or wetness index following Sivapalan et al. (1987). As an alternative, we determine a model-based initial wa-ter table position through a basin drainage experiment as in Vivoni et al. (2005). By allowing a fully-saturated catchment to drain for a long period of time (∼10 years), the transient readjustment of the subsurface head field occurs in the con-text of the basin geomorphology following subsurface flow pathways and gradients. In the absence of rainfall and evap-otranspiration, the discharge (or baseflow) produced in the catchment is due exclusively to drainage from the saturated zone. Baseflow drainage is governed by the calibrated model parameters as well as by the geometry of the hillslope and channel system. VanderKwaak and Loague (2001) used a similar strategy to initialize a surface-subsurface model prior to a storm event simulation.
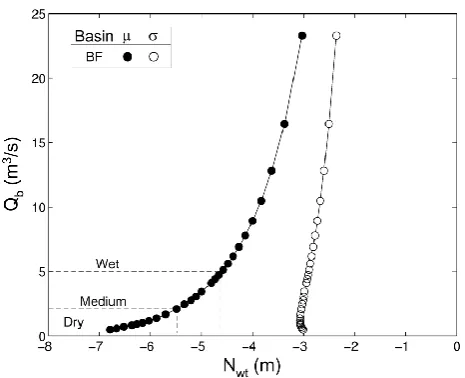
Figure 3 presents the basin response to the long-term drainage experiment in the form of the groundwater rating curve, which relates subsurface discharge (Qb) to the wa-ter table position (Nwt)(Eltahir and Yeh, 1999). The depth to the water table is captured by the first and second spatial moments of theNwt field (mean,µand standard deviation, σ). Note the nonlinearity in theQb–µ[Nwt] relation arises due to the interaction of the groundwater level with the sur-face topography and aquifer thickness (Marani et al., 2001). As an aquifer initially drains, sharp baseflow decreases oc-cur as the saturated zone is rapidly depleted along seepage faces. As drainage continues,Qb declines at a slower rate in response to a deeper Nwt with limited surface interac-tions. Interestingly, the spatial variability in the water tableσ [Nwt] exhibits an inflection point as the water table deepens (Qb∼1 m3/s). This inflection is an indication of the water table disconnecting from the surface along the stream net-work, resulting in a reduction ofσ[Nwt]. In light of this, the catchment response to rainfall should be a strong function of
Fig. 3. Groundwater rating curve for the Baron Fork basin
ex-pressed as a relation between baseflow discharge (Qb)and the depth
to groundwater table (Nwt), measured from the surface (z=0) in
negative units (m). The mean (µ [Nwt]) and standard deviation
(−σ[Nwt]) of the spatial distribution of the groundwater depth are
presented. σ [Nwt] is expressed in negative units for visualization
purposes only. Dashed lines represent the corresponding values for wet (Qb=5 m3/s,µ[Nwt]=−4.57 m), medium (Qb=2 m3/s,µ
[Nwt]=−5.49 m) and dry (Qb=0.5 m3/s,µ[Nwt]=−6.79 m)
condi-tions determined from discharge records at the Baron Fork gauge during 1993–2000. For clarity, only the drainage experiment belowQb=25 m3/s is depicted.
the nonlinear groundwater rating curve. To capture this non-linearity, we selected three initial states from the observed discharge record: wet (Qb=5 m3/s), medium (Qb=2 m3/s) and dry (Qb=0.5 m3/s). These baseflow levels represent pre-storm basin conditions with exceedence probabilities of 0.48 (wet), 0.75 (medium), and 0.99 (dry) derived from USGS gauging records.
The spatial organization of the groundwater table reces-sion is further explored in Fig. 4 as the time evolution of the water table drop (1Niwt)at different basin locations. Model elements are classified according to an index of hydrologic similarity:
λ=ln
Ac tanβ
, (8)
[image:7.595.313.546.62.251.2]Fig. 4. Time evolution of the topographic control on the
ground-water recession during the drainage experiment in the Baron Fork. Mean values in bins (symbols) and standard deviation in bins (±1σ
as bars) of the change in the water table position (1Niwt)over four time periods versus a topographic index of basin location (λ). The time periods correspond to1NTwt: total water table decrease be-tween saturated state andQb(dry);1N1wt: decrease between
satu-ration andQb(wet);1N2wt: decrease betweenQb(wet) andQb
(medium); and1N3wt: decrease betweenQb (medium) andQb
(dry). A unitλbin width is selected (e.g., ln (Ac/tanβ)=1).
total drainage period (1NTwt)are strongly related to basin lo-cation. Larger decreases inNwtare observed for regions with λ=9 to 18, suggesting these areas dominate baseflow pro-duction. Total drainage, however, is composed of separate periods with different spatial contributions. From the initial to the wet state (1N1wt), water table decreases are larger in steep upland regions (λ=7.5 to 15). This pattern continues for1N2wt suggesting that upland areas are initially respon-sible for baseflow. Flat lowland regions (λ=20 to 27) do not exhibit water table decreases until1N3wt, indicating these ar-eas contribute to baseflow during drier states. Note the shift in the peak of the spatial distribution of1Nwt to largerλ values as the water table becomes progressively more dis-connected from the land surface.
Given the spatial heterogeneity in the groundwater reces-sion, it is possible that catchment scale influences the an-tecedent wetness conditions. Figure 5 presents the scale-dependence of the mean depth to groundwater,µ[Nwt], for the three initial states (wet, medium, dry). Catchment scale (A)variation is captured by sampling fifteen subbasins rang-ing in area from 0.78 to 808 km2 (see Vivoni et al., 2006, Table 5, for subbasin properties). Note the deeperµ[Nwt] for smaller basins at all initial wetness states, an indica-tion of rapid groundwater drainage in upland areas primar-ily composed of steep hillslopes for the selected subbasins. As catchment scale increases, the basin-averagedµ [Nwt]
46 1
2 3 4 5 6 7 8 9 10 11 12 13 14 15 16 17 18 19 20 21 22 23 24 25 26 27 28 29 30
[image:8.595.53.284.63.252.2](Vivoni et al., Figure 5)
31Fig. 5. Catchment scale-dependence (Ain km2)of the mean depth to groundwater (µ[Nwt] in m) for the three initial moisture
con-ditions (wet, medium and dry). Dashed lines represent log-linear regressions for each initial state: wet (Nfit=0.39(log10A)–5.48),
medium (Nfit=0.37(log10A)–6.38) and dry (Nfit=0.32(log10A)–
7.58). Regressions are shown to aid visualization.
becomes progressively shallower (closer to the land surface, z=0) as more low lying areas near the stream network are sampled. Since lowland regions have less effective drainage in natural settings, inclusion of these areas in the basin av-erage reducesµ[Nwt]. Furthermore, the spatial variability of the depth to groundwater,σ [Nwt], increases withA(not shown), suggesting that heterogeneity in pre-storm wetness increases with catchment scale. Thus, the initial condition in larger basins appears to be wetter than in smaller basins, on average, but exhibits a higher spatial variation. While a lim-ited sampling of the internal basins is performed, the results indicate the potential scale-dependence in the initial ground-water conditions. As storage capacity depends onNwt, the spatial distribution of the antecedent wetness should play an important role in the catchment runoff response.
4.2 Effect of storm properties and antecedent wetness on runoff response and nonlinearity
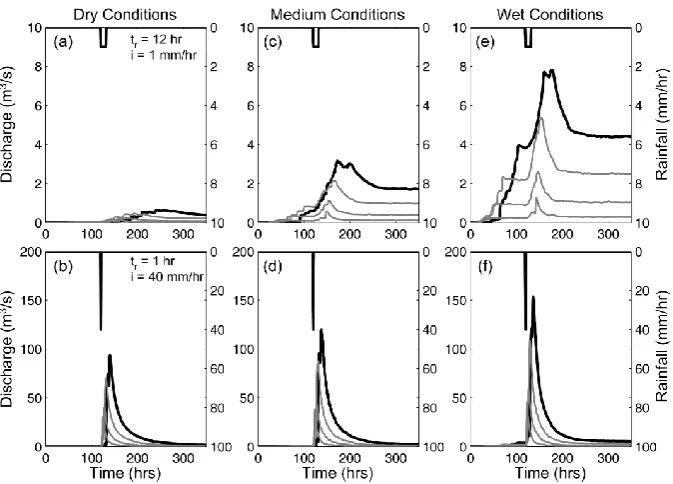
[image:8.595.311.544.65.247.2]Fig. 6. Hyetographs and flood response to storm events at multiple catchment scales under varying rainfall and initial groundwater conditions
(wet, medium, and dry). The top row (a, c, e) represent a combination of low rainfall rate (i=1 mm/h) and long rainfall duration (tr=12 h).
The bottom row (b, d, f) illustrates results for a high rainfall rate (i=40 mm/h) and short rainfall duration (tr=1 h). The two events represent
a drizzle and a thunderstorm, the extreme cases in our set of sampled storm characteristics. The thick solid line correspond to the outlet discharge at the Baron Fork (808 km2), while the thin gray lines represent discharge in basins with areas ofA=450.26, 182.91 and 65.06 km2, arranged from high to low flood response.
simulation period which lasts for 15 days, sufficiently long to capture the flood recession in the basin. As indicated previously, the initial water table distributions vary signif-icantly in the mean groundwater depth: µ [Nwt]=−4.57 m (wet),−5.49 m (medium) and−6.79 m (dry). In terms of the pre-storm surface saturation, however, the three initial condi-tions vary only slightly, with saturated surface area fraccondi-tions (As/A)of 0.06 (wet), 0.03 (medium) and 0.01 (dry), where As is the basin area with saturated conditions (θ=θs)in the top 10 cm.
Figure 6 presents the simulated flood hydrographs for two selected combinations of storm duration and intensity at multiple basins in the Baron Fork. The first storm type (i=1 mm/h, tr=12 h) corresponds to a long-duration, low-intensity drizzle, while the second storm type (i=40 mm/h, tr=1 h) is more reflective of a short-duration, high-intensity thunderstorm. Storm types represent fall frontal storms (driz-zle) and squall lines (thunderstorm) in the area (Grassotti et al., 2003; Van Horne et al., 2006). Differences in the storm properties impact the flood response as rainfall interacts in complex ways with the coupled surface-subsurface system. For example, the peak magnitude, time to peak and recession behavior vary dramatically for the two storms. Note, how-ever, the storms do not have the same rainfall volume and are selected simply to show the range of basin responses. Antecedent wetness also has important effects on the flood
discharge. Under dry conditions, the basin storage capac-ity leads to low runoff generation; whereas under wet con-ditions, the shallower water table promotes a more intense flood response. Differences in flood response between the dry and wet conditions are not constant within the storms, suggesting that interplay between rainfall and initial wetness is responsible for runoff nonlinearity.
48 1
2 3 4 5 6 7 8 9 10 11 12 13 14 15 16 17 18 19 20 21 22 23 24
[image:10.595.129.469.63.312.2](Vivoni et al., Figure 7)
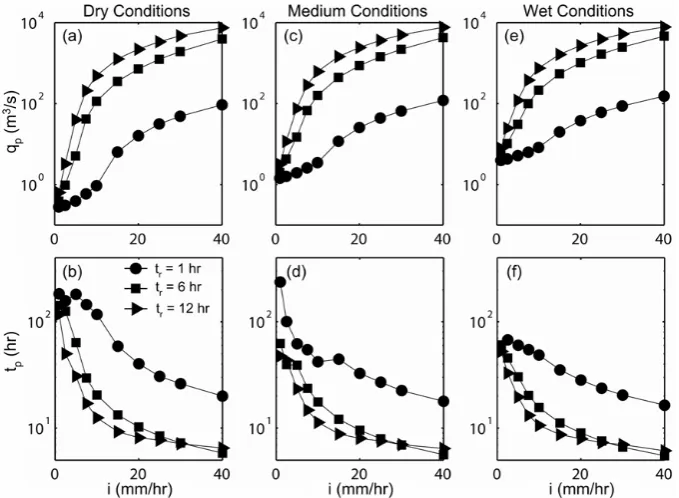
25Fig. 7. Variation of flood hydrograph characteristics with storm properties and antecedent wetness. The top row (a, c, e) depicts the variation
in peak discharge (qpin m3/s) with rainfall intensity (i)and duration (tr)for the wet, medium and dry conditions. The bottom row (b, d,
f) presents the variation in the time to peak discharge (tpin h) for the same conditions. For each case, the hydrograph characteristics are
presented for the Baron Fork outlet (808 km2).
1 2 3 4 5 6 7 8 9 10 11 12 13 14 15 16 17 18 19 20 21 22 23 24 25 26 27 28 29 30 31 32 33 34
(Vivoni et al., Figure 8)
35Fig. 8. Runoff nonlinearity in the Baron Fork basin captured by the catchment runoff ratio as a function of storm properties and antecedent
wetness. 8is computed asR/P, whereRandP are the runoff and rainfall volumes, respectively, during the entire simulation (15 days).
(a, b, c) Dry, medium and wet antecedent wetness conditions. Note that two values of8>1 in (b) and (c) indicate greater contributions to runoff from catchment storage than from incoming precipitation.
For example, the ratio ofqp (wet) toqp (dry) varies from 14.2 ati=1 mm/h, to 1.6 ati=40 mm/h fortr=1 h. This sug-gests that the initial water table position plays a more critical role for the low intensity rainfall regime, whose upper limit is set to some extent by the basin-averaged infiltration char-acteristics.
The effects of storm properties and antecedent wetness on runoff nonlinearity are shown in Fig. 8 through use of the runoff ratio (8=R/P ). For a linear system, 8is a
con-stant, while for a nonlinear response,8depends on rainfall amounts (Risbey and Entekhabi, 1996). Clearly, the runoff response exhibits a large variation of8with storm proper-ties and is modulated by pre-storm wetness. Interestingly, three general types of nonlinearity are exhibited: (1) asymp-totically increasing8(i)(e.g., dry,tr=12 h); (2) asymptoti-cally decreasing8(i)(e.g., wet,tr=1 h); and (3) a8(i) func-tion with a minimum value (e.g., medium,tr=1 h). For each type, a transition is present between the low and high rainfall
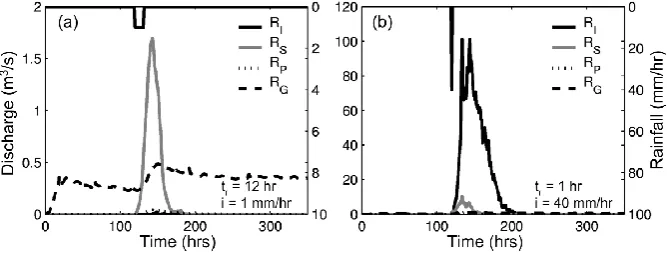
[image:10.595.129.467.387.522.2]Fig. 9. Runoff component hydrographs at the Baron Fork outlet from various mechanisms: infiltration-excess runoff (RI),
saturation-excess runoff (RS), perched return flow (RP)and groundwater exfiltration (RG). (a) Drizzle event:i=1 mm/h,tr=12 h, dry conditions. (b)
Thunderstorm event:i=40 mm/h,tr=1 h, dry conditions. Note the varying axes in (a) and (b) for the rainfall and discharge amounts.
intensity regimes. Higher nonlinearity is observed for lowi across all wetness states as the runoff production is limited. In general, increasing rainfall intensity leads to an asymptotic rise in8, which under certain circumstances can exhibit lin-earity (e.g., 8constant for wet, tr=1 h, i=20 to 40 mm/h). The minima observed in the8(i)relation at various wetness conditions suggests a transition from subsurface to surface regimes that may be associated with the relative importance of pre-storm and flood contributions. A closer look at the various runoff mechanisms can reveal their potential linkage to the runoff nonlinearity.
4.3 Process controls on runoff response, nonlinearity and spatial distribution
Multiple runoff mechanisms arise within a particular basin location due to the interaction between infiltration fronts, the water table position and lateral moisture transport (e.g., Ivanov et al., 2004a). The superposition of different runoff mechanisms generated at individual catchment sites leads to the flood hydrograph in the channel network. Thus, the effects of storm properties and antecedent wetness condi-tions on runoff nonlinearity should be mediated by transi-tions in runoff generation. To illustrate this, Fig. 9 presents the total runoff response decomposed into infiltration-excess (RI), saturation-excess (RS), perched return flow (RP)and groundwater exfiltration (RG)for the drizzle and thunder-storm events. Total discharge from the drizzle event is dominated byRS during the flood, with relatively high RG throughout the period. In contrast, the thunderstorm event is composed primarily ofRIwith minor contributions fromRS andRG. The different runoff mechanisms result in a ten-fold variation in the runoff ratio:8=0.033 (drizzle) and8=0.336 (thunderstorm). These two examples clearly indicate the po-tential for process controls on runoff response and nonlinear-ity, as explored further in the following.
Figure 10 presents a more direct comparison of the runoff ratio and the individual runoff generation mechanisms to
in-vestigate the process controls on nonlinearity. To facilitate the comparison, the runoff ratio (8)and runoff components (RI,RS,RP andRG)are normalized as:
8∗= 8 8max
, (9)
where8maxis the maximum value of8(i)over the rainfall
intensity interval (i=1 to 40 mm/h), shown as connected cir-cular symbols, and:
FI = RI
R , FS = RS
R , FP = RP
R , FG= RG
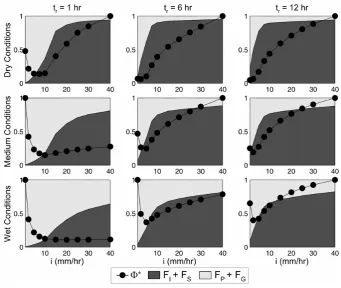
R , (10) depicted as shaded regions corresponding to the fraction of the total runoff volume (R). As noted previously, the total surface runoff consists ofFI+FS (dark shaded area), while the subsurface component isFP+FG (light shaded region). Clearly, a strong relation exists between the runoff nonlin-earity and the surface-subsurface partitioning, as the shape of the 8∗(i) function is tied to changes in the shaded re-gions. For instance,8∗(i)decreases withiwhen subsurface runoff (FG+FP)is the primary mechanism (e.g., wet,tr=1, 6, 12 h). The transition in runoff nonlinearity, characterized by a minima in8∗(i), occurs when surface runoff exceeds FI+FS>0.25. Note the position of the8∗(i)minima varies along i according to the runoff fractions. For cases with high surface runoff,8∗(i)increases withi(e.g., dry,tr=1, 6, 12 h). This comparison suggests that surface-subsurface in-teractions control the degree and functional form of the non-linearity.
51 1
2 3 4 5 6 7 8 9 10 11 12 13 14 15 16 17 18 19 20 21
(Vivoni et al, Figure 10)
22Fig. 10. Relation between runoff nonlinearity, expressed as the normalized runoff ratio (8∗, closed circles) and the runoff generation mechanisms, captured by the runoff fractions (Fi=Ri/R, shaded regions). Larger shaded regions represent the dominant runoff mechanisms
at each rainfall intensity, duration and antecedent wetness condition. For clarity, the individual surface (FI+FS)and subsurface (FP+FG)
contributions have been combined into two shaded regions.
lowerλand produce higher runoff. In addition, RG is ob-served at highλfor the wet condition, indicating subsurface stormflow. For the thunderstorm event, RI is the primary runoff mechanism and occurs at a range of intermediate lo-cations,λ=10 to 22. Interestingly,RI decreases for wetter conditions and shifts toward lowerλ, indicating that the shal-lower water table positions decrease infiltration capacity. At the same time, smaller contributions fromRS occur at high λand expand toward lowλwith increased wetness. These examples show that storm properties and antecedent wet-ness interact with the basin to simultaneously generate runoff mechanisms in specific catchment niches. As the distribution of niches varies with scale, process controls on runoff non-linearity are analyzed with regard to basin area in the next section.
4.4 Catchment scale-dependence of runoff response, non-linearity and process controls
The variation of runoff with catchment scale captures the complex interactions between storm properties and internal hydrologic processes. Runoff statistics, such as the peak dis-charge of a specific return period, have been shown to fol-low scaling laws with basin area (e.g., Gupta et al., 1994;
Menabde et al., 2001; Ogden and Dawdy, 2003). For indi-vidual events, the flood hydrograph peak and time to peak may follow scaling relations of the form:
qp =cqAα, (11)
tp=ctAβ, (12)
[image:12.595.127.469.61.349.2]Fig. 11. Spatial organization of runoff generation mechanisms (RI, RS,RP, RG)as a function of antecedent wetness conditions (wet,
medium, dry) for the two storm types: drizzle event,tr=12 h,i=1 mm/h (a, c, e); and thunderstorm event,tr=1 h,i=40 mm/h (b, d, f). The
average runoff production (mm/h) from the various mechanisms is bin-averaged as a function of theλ=ln (Ac/tanβ) distribution using a unit λbin width. Note the varying runoff ranges for the drizzle (0 to 0.75 mm/h) and thunderstorm (0 to 25 mm/h) events.
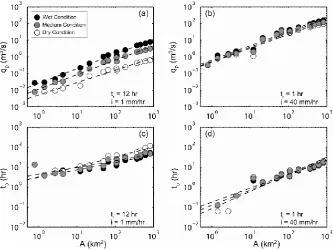
Fig. 12. Catchment scale-dependence (Ain km2)of the hydrograph peak (qp)and time to peak (tp)for the three initial wetness conditions
(wet, medium and dry). Two combinations of storm properties are shown: drizzle event (tr=12 h,i=1 mm/h) in (a, c) and thunderstorm event
[image:13.595.132.466.392.642.2]Fig. 13. Catchment scale-dependence (Ain km2)of the runoff ratio (8)for the three initial wetness conditions (wet, medium and dry) for two combinations of storm properties: drizzle event (tr=12 h,i=1 mm/h) in (a) and thunderstorm event (tr=1 h,i=40 mm/h) in (b). Dashed
lines represent log-log regressions for each relation and are shown to aid visualization.
To further explore the runoff scale-dependence, Fig. 13 shows the runoff ratio (8) as a function of catchment area (A). Despite the variability in8withA, scale-dependence is observed in the runoff ratio in the limited set of subbasins. For the drizzle event,8 decreases withA, with a stronger scale-dependence in the wet condition. In this case, small basins have high subsurface fractions (FG+FP)(not shown), thus leading to high runoff ratios (8∼0.8). AsAincreases, 8decreases as the relative amount of subsurface runoff di-minishes. This suggests that larger basins are less sensitive to the initial water table position for drizzle events. Consistent with this, the dry condition, whereFG+FP are small, has a runoff ratio which does not vary withA(8∼0.04), indi-cating that the impact of the initial condition has been effec-tively reduced across all basin scales. In contrast, the thun-derstorm event exhibits opposing runoff ratio scaling behav-ior. For the three wetness conditions,8is generally increas-ing withA, with greater scale-dependence for the dry condi-tion. As this event is dominated by surface runoff (FI+FS), variations of8withAdepend on internal surface properties. Small forested basins have a lower8due the lowFI+FS relative to the rainfall (not shown). AsAincreases, surface runoff increases in basins with large fractions of non-forested area, generally leading to higher8. Note that a maximum value in8is observed atA=20 to 60 km2, depending on the initial wetness. The peak 8identifies basins with surface properties that promote higher runoff (e.g., lower forest frac-tions). Interestingly, a slight decrease in 8occurs for the largest basins, which results from lower runoff production as more permeable regions are sampled. Since this occurs for all wetness conditions in the thunderstorm event, it is likely due to the fraction of forested areas rather than initial wet-ness. Overall, this preliminary evidence suggests that runoff mechanisms are responsible for the variation in runoff ratio with catchment scale and that storm forcing and antecedent wetness play important roles.
Figure 14 presents a more in-depth analysis of the relation-ship of the runoff ratio and the underlying runoff mechanisms at three catchment scales (A=0.78, 65.06 and 808.39 km2) and for the three initial conditions (wet, medium and dry). Here, the normalized runoff ratio (8∗=8/8
max)is presented
as a function of the peak discharge (qp)resulting from each storm condition (e.g., thirty pairs ofiandtr). Peak discharge is used as a surrogate for event intensity such that8∗(qp) re-flects runoff nonlinearity (e.g., variable8∗(qp)implies non-linearity). The normalized runoff ratio is compared to the underlying mechanisms represented by the space-time aver-aged runoff fractions (9I,9S,9P,9G)calculated over the fullqp range in each basin. Time-averaged runoff produc-tion at a basin locaproduc-tion (r)is computed over the simulation duration (Td)as:
r= 1 Td
j=Td X
j=1
rj, (13)
whererj is the runoff rate at thejth time step. The space-time averaged runoff production,hri, is estimated from the time-averaged runoff rates at all basin locations (total ofN elements) as:
hri = 1 A
k=N X
k=1
akrk, (14)
whereak is the area of the kth element and Ais the total basin area. For each mechanism (x=I, S, P and G), the space-time averaged runoff fraction (9x)is estimated as: 9x =
hrxi hrTi
, (15)
wherehrTiis the total space-time averaged runoff rate. Sur-face runoff consists of9I+9S (dark shaded area), while the subsurface component is9P+9G(light shaded region).
55 1
2 3 4 5 6 7 8 9 10 11 12 13 14 15 16 17 18 19
[image:15.595.128.468.63.357.2](Vivoni et al., Figure 14)
20Fig. 14. Relation between runoff nonlinearity, expressed as the normalized runoff ratio (8∗, closed circles) and the runoff generation mechanisms, captured by the space-time averaged runoff fractions for three catchment areas (A=0.78, 65.06 and 808.39 km2)and three initial conditions. The normalized runoff ratio and the space-time averaged runoff fractions are shown as a function of peak discharge (qp)to
capture the full range of conditions in each catchment. For clarity, the individual surface (9I+9S)and subsurface (9P+9G)contributions
have been combined into two shaded regions. The larger basins correspond to USGS gauges: BF (A=808.39 km2)and PC (A=65.06 km2).
Note the existence of two regimes in each catchment: (1) de-creasing8∗(qp)for low values ofqp, where total runoff pro-duction is primarily subsurface flow (9P+9G); and (2) in-creasing8∗(qp)for high values ofqp, where surface runoff (9I+9S)is the principal mechanism. The minima in the 8∗(qp)relation indicates a transition from subsurface to sur-face runoff as event intensity (qp)increases. This transition occurs at different values ofqpfor each basin suggesting that scale-dependence influences process controls on runoff non-linearity. For example, the smallest basin exhibits a minima in8∗(qp)at lowqp (∼10−2–10−1m3/s) as the fraction of subsurface runoff decreases sharply for larger events. Fur-thermore, the dry condition exhibits an increasing 8∗(qp) throughout theqp range due to low subsurface runoff frac-tions. For the larger basins, the minima in 8∗(qp) oc-curs at higher qp (10−1–10 m3/s) when surface runoff in-creases relative to subsurface contributions. While shifts in the runoff fractions are not smooth due to the effects of vary-ing storm forcvary-ing along theqp range, there is a general in-crease in surface runoff for more intense events (e.g., from 9I+9S=∼0.2 to∼0.8 for the largest basin).
5 Discussion and conclusions
The coupled surface-subsurface model utilized in this study has afforded the opportunity to examine the links between hydrograph characteristics and the underlying mechanisms leading to runoff production. In particular, the observed non-linearity in the rainfall-runoff transformation has been tied directly to the partitioning of a storm event of particular in-tensity and duration into surface and subsurface contributions as simulated in the distributed model. Runoff mechanisms can vary in their spatiotemporal distribution as a function of storm properties and initial wetness and may occur simulta-neous and preferentially in different catchment locations. An analysis of runoff production in a limited set of subbasins also illustrated the scale-dependence of the flood response (magnitude, timing, volume) and its relation to the underly-ing runoff mechanisms. In particular, we identified variations in the event runoff ratio with catchment scale. In the coupled system, the interaction of the water table position with the surface topography was identified as an important determi-nant of runoff characteristics and influences the shift in hy-drologic regimes from surface to subsurface dominance.
Several important conclusions arise from the analyses of the fully-distributed watershed model response to a series of storm events in a complex, humid basin in Oklahoma. The events under study are representative of storm characteristics in the fall period and pre-storm baseflow conditions arising during the preceding summer. Results from the study indi-cate the following:
1. A strong relation was found between runoff nonlinearity and the partitioning of total flood response into surface and subsurface components. Transitions in runoff non-linearity are clearly due to shifts in the dominance of runoff mechanisms. This behavior is robust as it occurs across a wide range of storm properties, initial wetness conditions and catchment scales.
2. The water table position relative to the surface to-pography dictates the temporal and spatial distribution of runoff production and flood response in the basin. Depth to groundwater varies with catchment scale lead-ing to different initial conditions in particular subbasins. In limited cases, high initial wetness can lead to linear basin response for intense storm events.
3. Runoff production mechanisms and groundwater dy-namics can preferentially occur in specific catchment niches related to a range of topographic indices. Storm properties and the water table position influence the spa-tial dynamics of runoff production. In particular, satu-rated regions near channels expand with initial wetness and can contribute to high runoff production.
4. Flood magnitude, time to peak and the runoff ratio were found to be scale-dependent and approximately follow
power law relations over a range of catchment areas for two selected storm types. Scale-dependence of the runoff ratio varies with initial wetness and storm prop-erties and is related to the fraction of forested basin area at each scale.
5. Scale-dependence was identified in the internal runoff production and nonlinearity for three basin sizes. In-creases in catchment scale promote the existence of a diverse set of runoff mechanisms as greater complex-ity is present in surface-subsurface interactions. Initial conditions modulate runoff production and may lead to runoff linearity for wet cases and large flood events. Insights from the modeling experiments reveal that the basin flood response is related to the runoff mechanisms excited as storm properties interact with particular catchment locations and their wetness state. Identification of the intimate link between runoff response characteristics and the underlying mechanisms provides a process-based explanation for non-linear responses in gauged and ungauged basins. An impor-tant result emerging from our modeling exercise is that large changes in basin response occur when the dominant mecha-nism transitions between surface and subsurface runoff. If runoff partitioning can be properly captured in numerical models, there is the possibility of reproducing observed non-linear responses across a range of real watersheds. Dis-tributed modeling results also provide a physical explana-tion for the scale-dependence of runoff generaexplana-tion in com-plex basins. A testable hypothesis arising from our experi-ments is that the scale-dependence of the runoff ratio exhibits different regimes which vary according to the underlying mechanisms. Our results indicate that spatial heterogeneities in landscape and initial wetness interact with storm forcing to produce runoff generation patterns that exhibit variations with aggegration scale. Capturing surface-subsurface dy-namics in numerical models of gauged and ungauged basins may allow understanding of process controls on runoff scale-dependence.
nonlinearity over a range of storm conditions and the scale-dependence of the runoff ratio for specific storms. Testing the robustness of our results in alternative settings or with other model structures would be a fruitful avenue that may lead to generalizable conclusions on the role played by runoff mech-anisms on basin response nonlinearity and scale-dependence. The results of this study are also limited to spatially-uniform storms with no account made for spatial patterns or within-storm rainfall variability. This assumption allowed us to focus on the process controls on runoff production for simple, rectangular rainfall pulses. As a result, the spatial patterns and scale-dependence exhibited in surface and sub-surface runoff are due exclusively to the interaction of storm properties with the basin characteristics, including its dis-tributed water table position. Nevertheless, the disdis-tributed hydrologic model could be used for exploring basin response under more complex storm forcing. For example, model forcing can consists of either observed radar rainfall or a stochastic rainfall model conditioned on regional observa-tions (e.g., Ivanov et al., 2004b, 2007). The spatial and tem-poral variability of the precipitation forcing is expected to resonate with the runoff production mechanisms and the dis-tribution of travel times to influence basin response and its scaling behavior, a topic of current investigation. Ultimately, the distributed hydrologic model can be used as an interpre-tive tool to assess the surface-subsurface processes that con-trol runoff production resulting from a range of possible forc-ing conditions. Furthermore, this approach is a useful means to identify the effects of catchment scale on hydrologic re-sponse.
Acknowledgements. This work was supported by the U.S. Army
Research Office (ARO DAAD19-00-C-0114; ARO W911NF-04-1-0119), NOAA (NA97WH0033), and NASA (NAG5-7475). We appreciate the comments of M. Sivapalan and an anonymous reviewer that helped improve the manuscript.
Edited by: P. Molnar
References
Abbott, M. B., Bathurst, J. C., Cunge, J. A., O’Connell, P. E., and Rasmussen, J.: An introduction to the European Hydrological System – Systeme Hydrologique European, 1: History and phi-losophy of a physically-based distributed modelling system, J. Hydrol., 87, 45–59, 1986.
Betson, R. P.: What is watershed runoff?, J. Geophys. Res., 69(8), 1541–1552, 1964.
Beven, K. J.: On subsurface stormflow: An analysis of response times, Hydrol. Sci. J., 27, 505–521, 1982.
Beven, K. J. and Kirkby, M. J.: A physically-based variable con-tributing area model of basin hydrology, Hydrol. Sci. Bull., 24, 43–69, 1979.
Bl¨oschl, G. and Sivapalan, M.: Process controls on regional flood frequency: Coefficient of variation and basin scale, Water Res. Resour., 33(12), 2967–2980, 1997.
Bradley, A. A. and Smith, J. A.: The hydrometeorological environ-ment of extreme rainstorms in the Southern Plains of the United States, J. Appl. Meteor., 33, 1418–1431, 1994.
Bras, R. L.: Hydrology: An Introduction to Hydrologic Science, Addison-Wesley Longman, 643 pp., Reading, MA, 1990. Brooks, R. H. and Corey, A. T.: Hydraulic properties of porous
media, Hydrol. Pap., 3, Colorado State University, Fort Collins, 1964.
Cabral, M. C., Garrote, L., Bras, R. L., and Entekhabi, D.: A kine-matic model of infiltration and runoff generation in layered and sloped soils, Adv. Water Resour., 15, 311–324, 1992.
Caroni, E., Rosso, R., and Siccardi, F.: Nonlinearity and time-variance of the hydrologic response of a small mountain stream, in: Scale Problems in Hydrology, edited by: Gupta, V. K., Rodr´ıguez-Iturbe, I., and Wood, E. F., D. Reidel Publishing, Dor-drecth, 19–37, 1986.
Carpenter, T. M., Georgakakos, K. P., and Sperfslagea, J. A.: On the parametric and NEXRAD-radar sensitivities of a distributed hydrologic model suitable for operational use, J. Hydrol., 253, 169–193, 2001.
de Vries, J. J.: Seasonal expansion and contraction of stream net-works in shallow groundwater systems, J. Hydrol., 170, 15–26, 1995.
Dunne, T.: Field studies of hillslope flow processes, in: Hillslope Hydrology, edited by: Kirkby, M. J., John Wiley, Chichester, 227–293, 1978.
Dunne, T. and Black, R. D.: An experimental investigation of runoff production in permeable soils, Water Resour. Res., 6(2), 478– 490, 1970.
Eltahir, E. A. B. and Yeh, P. J.-F.: On the asymmetric response of aquifer level to floods and droughts in Illinois, Water Resour. Res., 35(4), 1199–1217, 1999.
Finnerty, B. D., Smith, M. B., Seo, D.-J., Koren, V., and Moglen, G. E.: Space-time scale sensitivity of the Sacramento model to radar-gage precipitation inputs, J. Hydrol., 203, 21–38, 1997. Freeze, R. A.: Streamflow generation, Rev. Geophys. Space Phys.,
12(4), 627–647, 1974.
Garbretch, J., Van Liew, M., and Brown, G. O.: Trends in precipi-tation, streamflow, and evapotranspiration in the Great Plains of the United States, J. Hydrol. Eng., 9(5), 360–367, 2004. Garrote, L. and Bras, R. L.: A distributed model for real-time flood
forecasting using digital elevation models, J. Hydrol., 167, 279– 306, 1995.
Goodrich, D. C., Lane, L. J., Shillito, R. M., Miller, S. N., Syed, K. H., and Woolhiser, D. A.: Linearity of basin response as a function of scale in a semiarid watershed, Water Resour. Res., 33(7), 2951–2965, 1997.
Grassotti, C., Hoffman, R. N., Vivoni, E. R., and Entekhabi, D.: Multiple timescale intercomparison of two radar products and rain gauge observations over the Arkansas-Red River Basin, Weather and Forecasting, 18(6), 1207–1229, 2003.
Gupta, V. K., Mesa, O. J., and Dawdy, D. R.: Multiscaling theory of flood peaks: Regional quantile analysis, Water Resour. Res., 30(12), 3405–3421, 1994.
Gupta, V. K. and Dawdy, D. R.: Physical interpretations of regional variations in the scaling exponents of flood quantiles, Hydrol. Process., 9, 347–361, 1995.
Hursh, C. R. and Brater, E. F.: Separating storm-hydrographs form small drainage-areas into surface and subsurface flow, Trans. AGU, 22, 863–870, 1941.
Imes, J. L. and Emmett, L. F.: Geohydrology of the Ozark Plateaus Aquifer System in parts of Missouri, Arkansas, Oklahoma, and Kansas, U.S. Geol. Surv. Prof. Pap., 1414-D, 1994.
Ivanov, V. Y.: A continuous Real-time Interactive Basin Simulator (RIBS), M.S. thesis, MIT, Cambridge, MA, 2002.
Ivanov, V. Y., Vivoni, E. R., Bras, R. L., and Entekhabi, D.: Catch-ment hydrologic response with a fully-distributed triangulated irregular network model, Water Resour. Res., 40(11), W11102, doi:10.1029/2004WR003218, 2004a.
Ivanov, V. Y., Vivoni, E. R., Bras, R. L., and Entekhabi, D.: Preserv-ing high-resolution surface and rainfall data in operational-scale basin hydrology: A fully-distributed, physically-based approach, J. Hydrol., 298(1–4), 80–111, 2004b.
Ivanov, V. Y., Bras, R. L., and Curtis, D. C.: A weather generator for hydrological, ecological, and agricultural applications, Water Resour. Res., 43, W10406, doi:10.1029/2006WR005364, 2007. Johnson, D., Smith, M., Koren, V., and Finnerty, B.:
Compar-ing mean areal precipitation estimates from NEXRAD and rain gauge networks, J. Hydrol. Eng., 4(2), 117–124, 1999.
Lamb, R., Beven, K., and Myrabo, S.: Shallow groundwater re-sponse at Minifelt, in: Spatial Patterns in Catchment Hydrol-ogy: Observations and Modelling, edited by: Grayson, R. and Bl¨oschl, G., Cambridge University Press, Cambridge, UK, 272– 303, 2000.
Larsen, J. E., Sivapalan, M., Coles, N. A., and Linnet, P. E.: Simi-larity analysis of runoff generation processes in real-world catch-ments, Water Resour. Res., 30(6), 1641–1652, 1994.
Marani, M., Eltahir, E., and Rinaldo, A.: Geomorphic controls on regional base flow, Water Resour. Res., 37(10), 2619–2630, 2001.
Maurer, E. P., Wood, A. W., Adam, J. C., Lettenmaier, D. P., and Njissen, B.: A long-term hydrologically-based data set of land surface fluxes and states for the conterminous United States, J. Climate, 15, 3237–3251, 2002.
Menabde, M. and Sivapalan, M.: Linking space-time variability of river runoff and rainfall fields: a dynamic approach, Adv. Water Resour., 24, 1001–1014, 2001.
Michaud, J. D., Hirschboeck, K. K., and Winchell, M.: Regional variations in small-basin floods in the United States, Water Re-sour. Res., 37(5), 1405–1416, 2001.
Morrison, J. E. and Smith, J. A.: Scaling properties of flood peaks, Extremes, 4(1), 5–22, 2001.
Ogden, F. L. and Julien, P. Y.: Runoff sensitivity to temporal and spatial rainfall variability at runoff plane and small basin scales, Water Resour. Res., 29(8), 2589–2597, 1993.
Ogden, F. L. and Dawdy, D. R.: Peak discharge scaling in small Hortonian watershed, J. Hydrol. Eng., 8(2), 64–73, 2003. Paniconi, C. and Wood, E. F.: A detailed model for simulation of
catchment scale subsurface hydrologic processes, Water Resour. Res., 29(6), 1601–1620, 1993.
Rawls, W. J., Brakensiek, D. L., and Saxton, K. E.: Estimation of soil water properties, Trans. ASAE., 25(5), 1316–1330, 1982. Rigon, R., Bertoldi, G., and Over, T. M.: GEOtop: A distributed
hydrological model with coupled water and energy budgets, J. Hydrometeor., 7(3), 371–388, 2006.
Risbey, J. S. and Entekhabi, D.: Observed Sacramento basin
stream-flow response to precipitation and temperature changes and its relevance to climate impact studies, J. Hydrol., 184, 209–223, 1996.
Robinson, J. S., Sivapalan, M., and Snell, J. D.: On the relative roles of hillslope processes, channel routing, and network geo-morphology in the hydrologic response of natural catchments, Water Resour. Res., 31(2), 3089–3101, 1995.
Robinson, J. S. and Sivapalan, M.: Temporal scales and hydrologic regimes: Implications for flood frequency scaling, Water Resour. Res., 33(12), 2981–2999, 1997.
Salvucci, G. D. and Entekhabi, D.: Hillslope and climatic controls of hydrological fluxes, Water Resour. Res., 31, 1725–1739, 1995. Sivapalan, M., Beven, K., and Wood, E. F.: On hydrological similar-ity 2. A scaled model of storm runoff production, Water Resour. Res., 23(12), 2266–2278, 1987.
Sivapalan, M., Wood, E. F., and Beven, K. J.: On hydrological sim-ilarity 3. A dimensionless flood frequency model using a gener-alized geomorphologic unit hydrograph and partial area runoff generation, Water Resour. Res., 26(1), 43–58, 1990.
Sivapalan, M., Jothityangkoon, C., and Menadbe, M.: Linearity and nonlinearity of basin response as a function of scale: Discus-sion of alternative definitions, Water Resour. Res., 38(2), 1012, doi:10.1029/2001WR000482, 2002.
Sloan, W. T.: A physics-based function for modeling transient groundwater discharge at the watershed scale, Water Resour. Res., 36(1), 225–241, 2000.
Smith, J. A., Seo, D.-J., Baeck, M. L., and Hudlow, M. D.: An in-tercomparison study of NEXRAD precipitation estimates, Water Resour. Res., 32(7), 2035–2045, 1996.
Smith, M. B., Seo, D.-J., Koren, V., Reed, S., Zhang, Z., and Moreda, F.: The distributed model intercomparison project (DMIP): motivation and experiment design, J. Hydrol., 298(1– 4), 4–26, 2004a.
Smith, M. B., Koren, V. I., Zhang, Z., Reed, S. M., Pan, J.-J., and Moreda, F.: Runoff response to spatial variability in precipita-tion: an analysis of observed data, J. Hydrol., 298(1–4), 267– 286, 2004b.
Smith, R. E. and Hebbert, R. H. B.: Mathematical simulation of in-terdependent surface and subsurface hydrological processes, Wa-ter Resour. Res., 19(4), 987–1001, 1983.
Troch, P. A., de Troch, F. P., and Brutsaert, W.: Effective water table depth to describe initial conditions prior to storm rainfall in humid regions, Water Resour. Res., 29(2), 427–434, 1993a. Troch, P. A., Mancini, M., Paniconi, C., and Wood, E. F.:
Evalua-tion of a distributed catchment scale water balance model, Water Resour. Res., 29(6), 1805–1817, 1993b.
Tucker, G. E., Lancaster, S. T., Gasparini, N. M., Bras, R. L., and Rybarczyk, S. M.: An object-oriented framework for distributed hydrologic and geomorphologic modeling using triangulated ir-regular networks, Comp. Geosci., 27(8), 959–973, 2001. Van Horne, M. P., Vivoni, E. R., Entekhabi, D., Hoffman, R. N., and
Grassotti, C.: Evaluating the effects of image filtering in short-term radar rainfall forecasting for hydrological applications, Me-teor. App., 13(3), 289–303, 2006.
VanderKwaak, J. E. and Loague, K.: Hydrologic-response simula-tions for the R-5 catchment with a comprehensive physics-based model, Water Resour. Res., 37(4), 999–1013, 2001.
Assoc., 39(4), 757–769, 2003.
Vivoni, E. R., Ivanov, V. Y., Bras, R. L., and Entekhabi, D.: Gen-eration of triangulated irregular networks based on hydrological similarity, J. Hydrol. Eng., 9(4), 288–302, 2004.
Vivoni, E. R., Ivanov, V. Y., Bras, R. L., and Entekhabi, D.: On the effects of triangulated terrain resolution on distributed hy-drologic model response, Hydrol. Process., 19(11), 2101–2122, 2005.
Vivoni, E. R., Entekhabi, D., Bras, R. L., Ivanov, V. Y., Van Horne, M. P., Grassotti, C., and Hoffman, R. N.: Extending the pre-dictability of hydrometeorological flood events using radar rain-fall nowcasting, J. Hydrometeor., 7(4), 660–677, 2006.
Western, A. W., Grayson, R. B., Bl¨oschl, G., Willgoose, G. R., and McMahon, T. A.: Observed spatial organization of soil moisture and its relation to terrain indices, Water Resour. Res., 35(3), 797– 810, 1999.
Western, A. and Grayson, R.: Soil moisture and runoff processes at Tarrawarra, in: Spatial Patterns in Catchment Hydrology: Obser-vations and Modelling, edited by: Grayson, R. and Bl¨oschl, G., Cambridge University Press, Cambridge, UK, 209–246, 2000. Weyman, D. R.: Throughflow on hillslopes and its relation to the
stream hydrograph, Hydrol. Sci. Bull., 15, 25–33, 1970. Wigmosta, M. S., Vail, L. W., and Lettenmaeir, D. P.: A distributed
hydrology-vegetation model for complex terrain, Water Resour. Res., 30(6), 1665–1679, 1994.

![Fig. 5. Catchment scale-dependence (ditions (wet, medium and dry). Dashed lines represent log-linearregressions for each initial state: wet (medium (A in km2) of the mean depthto groundwater (µ [Nwt] in m) for the three initial moisture con-Nfit=0.39(log10A](https://thumb-us.123doks.com/thumbv2/123dok_us/9266004.996134/8.595.311.544.65.247/catchment-dependence-ditions-dashed-represent-linearregressions-groundwater-moisture.webp)