http://www.scirp.org/journal/psych ISSN Online: 2152-7199 ISSN Print: 2152-7180
Factor Structure and Validity Indicators of the
Job Content Questionnaire: Discussing
Stress in the Work Contexts
Kionna Oliveira Bernardes Santos
1, Fernando Martins Carvalho
2, Tânia Maria de Araújo
31Departamento de Fisioterapia, Universidade Federal da Bahia (UFBA), Salvador, Brazil
2Departamento de Medicina Preventiva e Social, Universidade Federal da Bahia, Salvador, Brazil 3Departamento de Saúde, Universidade Estadual de Feira de Santana (UEFS), Feira de Santana, Brazil
Abstract
Study assessed the dimensional structure of the Job Content Questionnaire’s (JCQ 2.0) main scales in two different work contexts. We evaluated two surveys among Brazilian workers, comprising 3084 health workers and 489 industrial workers. An exploratory factor analysis with oblique Geomin rotation explored the model, and subsequently, a confirmatory factor analysis assessed the factor structure and possi-ble modifications of the model. The internal consistency of JC scales was assessed by using estimates of composite reliability and Cronbach’s alpha. The structural model was confirmed, with a good fit in the two studies, despite low factors’ loads for some items of “decision authority” and “psychological job demands”. We concluded that the JCQ dimensional structure corresponded to its theoretical framework in the two work contexts analyzed.
Keywords
Reproducibility of Results, Stress, Work, Validation Studies, Factor Analysis
1. Introduction
The Job Content Questionnaire (JCQ) is a multiscale instrument for evaluating work psychological aspects. The questionnaire evaluates two main dimensions that provide theoretical framework to the Job Strain Model (JSM): psychological demands and job control. The JSM assumes that environmental factors are the main determinants of the occupational stress production process, but it also takes into account individual factors,
How to cite this paper: Santos, K. O. B., Carvalho, F. M., & de Araújo, T. M. (2016). Factor Structure and Validity Indicators of the Job Content Questionnaire: Discussing Stress in the Work Contexts. Psychology, 7, 1424-1437.
http://dx.doi.org/10.4236/psych.2016.712142
Received: June 19, 2016 Accepted: November 4, 2016 Published: November 7, 2016
Copyright © 2016 by authors and Scientific Research Publishing Inc. This work is licensed under the Creative Commons Attribution International License (CC BY 4.0).
like coping strategies (Karasek, 1979). The JCQ has been used in many cultural and occupational contexts (Kawakami et al., 1995; Niedhammer, 2002; Sale & Kerr, 2002; Cheng, Luh, & Guo, 2003; Gimeno, Benavides, Amick, Benach, & Martinez, 2004; Li, Yang, Liu, Xu, & Choi., 2004; Edimansyah, Rusli, Naing, & Mazalisah, 2006; Niedhammer, Ganem, Gendrey, David, & Degioanni, 2006; Eum et al., 2006; Araújo & Karasek, 2008; Choi et al., 2008; Phakthongsuk & Apakupakul, 2008; Choobineh, Ghaem, & Ahmedinejad, 2011; Gomez-Ortiz & Moreno, 2009; Griep, Rotenberg, Landsbergis, & Vasconcellos-Silva, 2011; Mase et al., 2012; Nehzat, Huda, & Tajuddin,
2014).
JCQ recommended version has 49 items, including latitude of decision, which is the worker’s control over their own work, made by decision of authority and discretion ability subscales, psychological requirements, supervisor and social support coworker subscales, physical demands of the job, and job insecurity (Karasek, 1985). A new ver-sion of the questionnaire (JCQ 2.0), introducing the emotional demands scale, is under test. Detailed information about JCQ recommended version and its new version is available at http://www.jcqcenter.org.
The multidimensional characteristic of the work psychosocial aspects reveals the complexity of JCQ analysis object (Bakker, Van Veldhoven, & Xanthopoulou, 2010). JCQ Center researchers constantly review the existing scales and have implemented new scales and subscales, aiming to improve the questionnaire measurement capacity.
Several studies have analyzed the JCQ dimensional structure. However, different evaluation methods and the instrument different versions have hampered the compa-rability of results drawn from these studies. The JCQ dimensional structure was mainly described by means of exploratory techniques (Kawakami et al., 1995; Cheng et al., 2003; Gimeno et al., 2004; Li et al., 2004; Edimansyah et al., 2006; Eum et al., 2006; Araújo & Karasek, 2008; Choobineh et al., 2011; Gomez-Ortiz & Moreno, 2009; Mase et
al., 2012; Nehzat et al., 2014). The confirmatory factorial analysis can improve the
con-struct measurement theory of a research instrument and deepen the analysis when it considers the theoretical framework that presupposes the measure that the instrument will make. According to this technique, the measurement theory previously tested by an exploratory method is used for specifying the number of factors and items that will compose the factorial model (Hair, Black, Babin, Anderson, & Tatham, 2006). Some studies have already applied this technique to JCQ and have proposed structural changes in this instrument (Niedhammer, 2002; Sale & Kerr, 2002; Santavirta, 2003; Niedhammer et al., 2006; Choi et al., 2008; Phakthongsuk & Apakupakul, 2008;
Hökerberg et al., 2010; Griep et al., 2011; Hökerberg et al., 2014). This study aimed to
assess the dimensional structure of the Job Content Questionnaire’s (JCQ) main scales in two different work contexts in Brazil.
2. Methods
health care and medium complexity from five cities from State of Bahia, Brazil. The sample was stratified according to geographical área, complexity level and professional groups. Data collection occurred in 2011/2012. Study 2 was a census among 489 permanent workers in a petroleum industry in the Sate of Bahia, Brazil, in 2008
(Fon-seca, Araújo, Santos, & Amado 2014).
2.1. Research Instrument
Both studies have used the newest version of the Job Content Questionnaire (JCQ 2.0) to evaluate psychosocial job aspects, measured in Likert-type scales that vary from 1 (strongly disagree) to 4 (strongly agree). Each study evaluated different scales, representing different dimensions of the JCQ. Study 1 evaluated the scales: psychologi-cal job demands; Decision latitude (worker control upon the own job, including the de-cision latitude and skill discretion subscales; social support from supervisor and social support from coworkers; physical job demands; job insecurity, and the emotional de-mands scale. Study 2 evaluated the same scales, except the emotional dede-mands scale.
2.2. Data Analysis
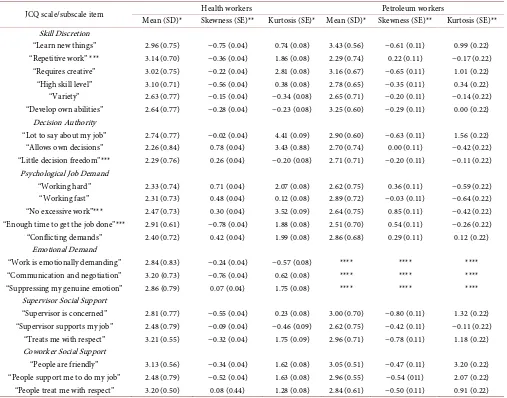
Descriptive analysis. Initially, the workers sociodemographic characteristics (sex, age, and schooling) were described. Subsequently, skewness and kurtosis distributions of the items included in the factorial model were measured. Items presenting absolute values of skewness > 3 or kurtosis > 7 were considered as having poor sensitivity (Kline, 1994).
Exploratory and confirmatory factor analysis. Factors were extracted by using paral-lel analysis, a reliable method that allows the comparison of the empirical sample ei-genvalues with those from a random sample generated by the data processing program
(Horn, 1965). The scree plot (Cattell, 1966) technique was used for confirming the
number of factors extracted by factor analysis.
Preliminarly, an exploratory factor analysis of the JCQ dimensional structure was performed, by using geomin oblique type rotation. Factor loadings ≥ 0.30 were as-sumed as relevant for model structure interpretation [24]. Subsequently, a confirmatory factor analysis (CFA) proceeded, in order to evaluate the factor structure acceptability and possible model modifications, by using the software Mplus 7.1 (Muthén & Muthén,
2012). CFA used the Weighted Least Squares Mean andVariance Adjusted (WLSMV)
estimator. Likert scales structure were analysed by using polychoric correlation matric-es.
Three indices evaluated the model goodness of fit. The Root Mean Square Error of Approximation (RMSEA) was considered as a tool for sample size adjustment. Values below 0.06 denote that the model fit is good (Hu & Bentler, 1999). Other authors
(Brown & Cudeck, 1993) report that RMSEA values below 0.05 indicate excellent fit;
va-riables. Both indices vary from 0 to 1 and values above 0.90 indicate adequate fit
(Brown, 2006).
2.3. Internal Consistency
JCQ internal consistency was evaluated by comparing Composite Reliability (CR) and Cronbach’s alpha estimates for the questionnaire scales. Composite Reliability was es-timated for each factor according to the items factor loadings and respective measure-ment errors. CR was obtained by dividing the sum of square of factor loadings (λi) in each construct by the sum of the error variance terms for the same construct (δi). Val-ues ≥0.70 denoted satisfactory internal consistency (Hair et al., 2006).
Cronbach’s alpha was calculated by using the Statistical Package for the Social Sciences version 15.0. Values ranging 0.65 - 0.90 indicate satisfactory performance
(Nunnaly, 1978).
Criteria for Convergent and Discriminant validity. The indices of composite reliabil-ity and average variance extracted (AVE) were taken as criteria to judge the model convergent validity. AVE was evaluated by the average square factor loading. AVE val-ues ≥50 represent adequacy and indicate that at least 50% of the measurement is due to the extracted construct (Hair et al., 2006). The discriminant validity assessed the multi-dimensional nature of the instrument by means of the square root of AVE (√AVE), by comparing factors correlations. Discriminant capacity was identified when √AVE value were higher than the correlations values of determined factor with any other factor present in the factorial model (Fornell & Larcker, 1981).
2.4. Ethical Aspects
Studies 1 and 2 have been previously approved by Ethical Boards; the Collective Health Institute of Federal University of Bahia Ethical Board (Process number CAAE 18723813.9.0000.5030) has approved this study.
3. Results
Table 1. Sociodemographic characteristics of two workers populations evaluated by the Job Content Questionnaire, State of Bahia, Brazil, 2008/2012.
Characteristic
Health workers Petroleum workers (N = 3084) (N = 489)
n % n %
Sex
Male 672 19.3 332 68.2
Female 2405 69.1 155 31.8
Age (years)
<30 705 23.0 24 4.9
31 to 45 1454 47.5 249 50.9
46 to 55 587 19.2 186 38.0
56 or more 315 10.3 30 6.1
Schooling level
Fundamental (1 to 9 years) 122 4.0 6 1.2 Medium (10 to 12 years) 1611 53.0 205 42.2 Higher (undergraduate/graduate) 1309 43.0 275 56.6
Table 2. Descriptive statistics of the job content questionnaire items in two workers populations, State of Bahia, Brazil, 2008/2012.
JCQ scale/subscale item Mean (SD)* Skewness (SE)** Health workers Kurtosis (SE)* Mean (SD)* Skewness (SE)** Petroleum workers Kurtosis (SE)** Skill Discretion
“Learn new things” 2.96 (0.75) −0.75 (0.04) 0.74 (0.08) 3.43 (0.56) −0.61 (0.11) 0.99 (0.22) “Repetitive work” *** 3.14 (0.70) −0.36 (0.04) 1.86 (0.08) 2.29 (0.74) 0.22 (0.11) −0.17 (0.22)
“Requires creative” 3.02 (0.75) −0.22 (0.04) 2.81 (0.08) 3.16 (0.67) −0.65 (0.11) 1.01 (0.22) “High skill level” 3.10 (0.71) −0.56 (0.04) 0.38 (0.08) 2.78 (0.65) −0.35 (0.11) 0.34 (0.22) “Variety” 2.63 (0.77) −0.15 (0.04) −0.34 (0.08) 2.65 (0.71) −0.20 (0.11) −0.14 (0.22) “Develop own abilities” 2.64 (0.77) −0.28 (0.04) −0.23 (0.08) 3.25 (0.60) −0.29 (0.11) 0.00 (0.22)
Decision Authority
“Lot to say about my job” 2.74 (0.77) −0.02 (0.04) 4.41 (0.09) 2.90 (0.60) −0.63 (0.11) 1.56 (0.22) “Allows own decisions” 2.26 (0.84) 0.78 (0.04) 3.43 (0.88) 2.70 (0.74) 0.00 (0.11) −0.42 (0.22) “Little decision freedom”*** 2.29 (0.76) 0.26 (0.04) −0.20 (0.08) 2.71 (0.71) −0.20 (0.11) −0.11 (0.22)
Psychological Job Demand
“Working hard” 2.33 (0.74) 0.71 (0.04) 2.07 (0.08) 2.62 (0.75) 0.36 (0.11) −0.59 (0.22) “Working fast” 2.31 (0.73) 0.48 (0.04) 0.12 (0.08) 2.89 (0.72) −0.03 (0.11) −0.64 (0.22) “No excessive work”*** 2.47 (0.73) 0.30 (0.04) 3.52 (0.09) 2.64 (0.75) 0.85 (0.11) −0.42 (0.22) “Enough time to get the job done”*** 2.91 (0.61) −0.78 (0.04) 1.88 (0.08) 2.51 (0.70) 0.54 (0.11) −0.26 (0.22) “Conflicting demands” 2.40 (0.72) 0.42 (0.04) 1.99 (0.08) 2.86 (0.68) 0.29 (0.11) 0.12 (0.22)
Emotional Demand
“Work is emotionally demanding” 2.84 (0.83) −0.24 (0.04) −0.57 (0.08) **** **** **** “Communication and negotiation” 3.20 (0.73) −0.76 (0.04) 0.62 (0.08) **** **** **** “Suppressing my genuine emotion” 2.86 (0.79) 0.07 (0.04) 1.75 (0.08) **** **** ****
Supervisor Social Support
“Supervisor is concerned” 2.81 (0.77) −0.55 (0.04) 0.23 (0.08) 3.00 (0.70) −0.80 (0.11) 1.32 (0.22) “Supervisor supports my job” 2.48 (0.79) −0.09 (0.04) −0.46 (0.09) 2.62 (0.75) −0.42 (0.11) −0.11 (0.22)
“Treats me with respect” 3.21 (0.55) −0.32 (0.04) 1.75 (0.09) 2.96 (0.71) −0.78 (0.11) 1.18 (0.22) Coworker Social Support
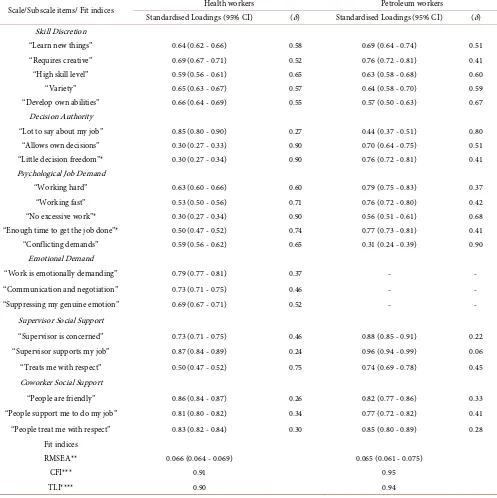
[image:5.595.47.554.310.708.2]The item “Repetitive work” presented factor loadings < 0.30, hampering the struc-tural model goodness of fit in study 1 (RMSEA 0.071; CFI 0.90; and TLI 0.88) and in study 2 (RMSEA 0.072; CFI 0.93; and TLI 0.92). Then, the model performance was tested without the item “Repetitive work”, and the indices showed good fit in both stu-dies: RMSEA 0.066; CFI 0.91; and TLI 0.90 in study 1; and RMSEA 0.065; CFI 0.95; and TLI 0.94 in study 2 (Table 3).
Table 3. Model standardised loading, measurement errors ((δ)) and fit indices at confirmatory factor analysis in two workers populations, State of Bahia, Brazil, 2008/2012.
Scale/Subscale items/ Fit indices Health workers Petroleum workers
Standardised Loadings (95% CI) (δ) Standardised Loadings (95% CI) (δ) Skill Discretion
“Learn new things” 0.64 (0.62 - 0.66) 0.58 0.69 (0.64 - 0.74) 0.51 “Requires creative” 0.69 (0.67 - 0.71) 0.52 0.76 (0.72 - 0.81) 0.41 “High skill level” 0.59 (0.56 - 0.61) 0.65 0.63 (0.58 - 0.68) 0.60 “Variety” 0.65 (0.63 - 0.67) 0.57 0.64 (0.58 - 0.70) 0.59 “Develop own abilities” 0.66 (0.64 - 0.69) 0.55 0.57 (0.50 - 0.63) 0.67
Decision Authority
“Lot to say about my job” 0.85 (0.80 - 0.90) 0.27 0.44 (0.37 - 0.51) 0.80 “Allows own decisions” 0.30 (0.27 - 0.33) 0.90 0.70 (0.64 - 0.75) 0.51 “Little decision freedom”* 0.30 (0.27 - 0.34) 0.90 0.76 (0.72 - 0.81) 0.41 Psychological Job Demand
“Working hard” 0.63 (0.60 - 0.66) 0.60 0.79 (0.75 - 0.83) 0.37 “Working fast” 0.53 (0.50 - 0.56) 0.71 0.76 (0.72 - 0.80) 0.42 “No excessive work”* 0.30 (0.27 - 0.34) 0.90 0.56 (0.51 - 0.61) 0.68 “Enough time to get the job done”* 0.50 (0.47 - 0.52) 0.74 0.77 (0.73 - 0.81) 0.41 “Conflicting demands” 0.59 (0.56 - 0.62) 0.65 0.31 (0.24 - 0.39) 0.90
Emotional Demand
“Work is emotionally demanding” 0.79 (0.77 - 0.81) 0.37 - - “Communication and negotiation” 0.73 (0.71 - 0.75) 0.46 - - “Suppressing my genuine emotion” 0.69 (0.67 - 0.71) 0.52 - -
Supervisor Social Support
“Supervisor is concerned” 0.73 (0.71 - 0.75) 0.46 0.88 (0.85 - 0.91) 0.22 “Supervisor supports my job” 0.87 (0.84 - 0.89) 0.24 0.96 (0.94 - 0.99) 0.06 “Treats me with respect” 0.50 (0.47 - 0.52) 0.75 0.74 (0.69 - 0.78) 0.45 Coworker Social Support
“People are friendly” 0.86 (0.84 - 0.87) 0.26 0.82 (0.77 - 0.86) 0.33 “People support me to do my job” 0.81 (0.80 - 0.82) 0.34 0.77 (0.72 - 0.82) 0.41 “People treat me with respect” 0.83 (0.82 - 0.84) 0.30 0.85 (0.80 - 0.89) 0.28
Fit indices
RMSEA** 0.066 (0.064 - 0.069) 0.065 (0.061 - 0.075)
CFI*** 0.91 0.95
Factor 1, “Skill Discretion”, presented similar structure in both studies. Its lowest loading factor value was 0.59 for the item “High skill level”, in study 1; and 0.57 for the item “Develop own habilities”, in study 2. The item “Requires creative” presented the highest loading values: 0.69 and 0.76, in study 1 and study 2, respectively. “Authority Decision”, a subscale of the Decision Latitude scale, was evaluated in Factor 2. In study 1, the item “Lot to say about my job” showed the highest loading (0.85) and the other two items showed low loading values (0.30). In study 2, the same item presented the smallest loading values (0.44), while the other two items presented loading values ade-quate for factor evaluation (≥0.70). Psychological Job Demands were evaluated in Fac-tor 3. The item “Working hard” presented the highest loading value in both studies. The items “No excessive work” from study 1 and the item “Conflicting demands” from study 2 had big measurement errors (0.90), but they were kept in the model for the sake of its dimensional structure evaluation.
The “Emotional Demand” scale was assessed in study 1, only. Factorial loadings va-ried from 0.69 to 0.79, in the items “Suppressing my genuine emotions” and “Work is emotionally demanding”, respectively.
The scales “Supervisor Social Support” and “Coworker Social Support” showed out-standing high loading factor items. In study 1, all items of the subscale “Coworker So-cial Support” had loading values greater than 0.80. However, in the subscale “Supervi-sor Social Support”, the item “Treats me with respect” had loading value of 0.50, only. In study 2, the item “Treats me with respect” presented loading value of 0.74, and the remaining ones, values above 0.80.
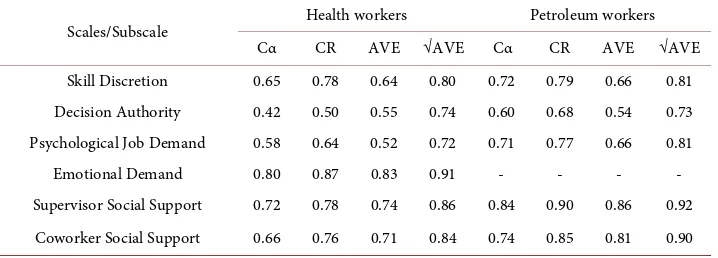
[image:7.595.197.556.579.708.2]In general, the JCQ dimensions showed good internal consistency in both studies, as revealed by adequate Cronbach’s alpha coefficients (Table 4). However, Cronbach’s alpha coefficients below 0.65 were found for the subscale “Authority Decision” in both studies, and for the scale “Psychological Job Demand”, in study 1. The Composite Re-liability presented good correlation (above 0.70) in most scales and subscales of both studies, particularly in the scales “Emotional Demand” (0.87), “Coworker Social Sup- port” (0.78), and “Skill Discretion”(0.78) in study 1; and “Supervisor Social Sup-port”(0.90) and “Coworker Social Support” (0.85) in study 2.
Table 4.Cronbach’s alpha (Cα), Composite Reliability (CR), Average Variance Extracted (AVE) Square Root of the Average Variance Extracted (√AVE) of JCQ in two workers populations, State of Bahia, Brazil, 2008/2012.
Scales/Subscale Health workers Petroleum workers Cα CR AVE √AVE Cα CR AVE √AVE Skill Discretion 0.65 0.78 0.64 0.80 0.72 0.79 0.66 0.81 Decision Authority 0.42 0.50 0.55 0.74 0.60 0.68 0.54 0.73 Psychological Job Demand 0.58 0.64 0.52 0.72 0.71 0.77 0.66 0.81 Emotional Demand 0.80 0.87 0.83 0.91 - - - - Supervisor Social Support 0.72 0.78 0.74 0.86 0.84 0.90 0.86 0.92
AVE values denoted good convergent validity for JCQ scales in the two studies. All scales and subscales showed AVE values above 0.50, representing that at least half of the variance was due to the extracted construct. Social support scales presented the highest proportion of explained variance, in both studies.
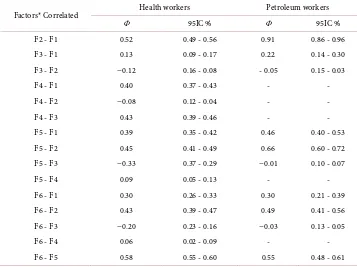
Correlations between factors were independently analysed, in each study (Table 5). Among health workers, factors F5 and F6 presented the highest positive correlation (0.58), followed by F1 and F2 (0.52). Relevant negative correlations were observed be-tween factors F3 and F2, F4 and F2, F5 and F3, and F6 and F3. JCQ scales and subcales had adequate discriminant validity, according to the square root of AVE parameter. Among petroleum workers, factors F1 and F2 presented the highest correlation (0.91), followed by F5 and F2 (0.66), and F6 and F5 (0.55). The Decision Latitude subscales “Sill Discretion” and “Authority Decision” had some restrictions concerning their dis-criminant validity, because they presented at least one factor with correlation value higher than the √AVE value.
4. Discussion
[image:8.595.195.552.418.685.2]The confirmatory factor analysis revealed correspondence between the theoretical con-ception and the dimensional structure of the model in the two work contexts. The lite-rature reports that, independently of the JCQ version, the scale “Job Psychological De-mand”, and the subscales “Skill Discretion” and “Decision Authority” that constitute
Table 5. Correlations between factors (φ) of JCQ in two workers populations, State of Bahia, Brazil, 2008/2012.
Factors* Correlated Health workers Petroleum workers
Φ 95IC % Φ 95IC %
F2 - F1 0.52 0.49 - 0.56 0.91 0.86 - 0.96 F3 - F1 0.13 0.09 - 0.17 0.22 0.14 - 0.30 F3 - F2 −0.12 0.16 - 0.08 - 0.05 0.15 - 0.03
F4 - F1 0.40 0.37 - 0.43 - -
F4 - F2 −0.08 0.12 - 0.04 - -
F4 - F3 0.43 0.39 - 0.46 - -
F5 - F1 0.39 0.35 - 0.42 0.46 0.40 - 0.53 F5 - F2 0.45 0.41 - 0.49 0.66 0.60 - 0.72 F5 - F3 −0.33 0.37 - 0.29 −0.01 0.10 - 0.07
F5 - F4 0.09 0.05 - 0.13 - -
F6 - F1 0.30 0.26 - 0.33 0.30 0.21 - 0.39 F6 - F2 0.43 0.39 - 0.47 0.49 0.41 - 0.56 F6 - F3 −0.20 0.23 - 0.16 −0.03 0.13 - 0.05
F6 - F4 0.06 0.02 - 0.09 - -
F6 - F5 0.58 0.55 - 0.60 0.55 0.48 - 0.61
the “Decision Latitude”, are distinct (Griep et al., 2011; Hökerberg et al., 2010; Choi et
al., 2008). In spite of the presence of low factorial loadings in some items of “Decision
Authority” and “Job Psychological Demand”, the structural model was confirmed, with good fit, in both studies. Most scales and subscales presented adequate internal consis-tency, according to Cronbach’s alpha and composite reliability, in both studies. Cron-bach’s alpha has been frequently used for evaluating the internal consistency of JCQ scales and subscales (Kawakami et al., 1995; Niedhammer, 2002; Sale & Kerr, 2002; Cheng et al., 2003; Gimeno et al., 2004; Li et al., 2004; Edimansyah et al., 2006; Niedhammer et al., 2006; Eum et al., 2006; Araújo & Karasek, 2008; Choi et al., 2008; Phakthongsuk & Apakupakul, 2008; Choobineh et al., 2011; Griep et al., 2011; Mase et
al., 2012; Tabatabaee Jabali et al., 2013; Nehzat et al., 2014). However, the isolate use of
Cronbach’s alpha has been criticised because it yield underestimate measurements, be-cause of the instrument multidimensional nature, and bebe-cause it violates the model tau-equivalence (Tavakol & Dennick, 2011; Green & Thompson, 2005), a condition that assumes that each item measures the same latent trace of the instrument.
The control (“Decision Latitude”) dimension, evaluated by the subscales “Skill Dis-cretion” and “Decision Authority”, performed distinctly in the two studies, considering the loading factors magnitude of their items. However, the subscales showed positive correlations between them. Other studies have reported moderate correlations
(Niedhammer, 2002; Li et al., 2004). “Decision Authority” showed negative, though
low, correlations with “Psychological Job Demand” (studies 1 and 2) and with “Emo-tional Demand” (study 1). The abitity to decide how to do the own job may acts posi-tively upon the tensions produced by the job strain, helping the workers to find ways and strategies adapted to their capacities in order to give adequate answers to the job demands. The moderating effect of the control dimension upon the negative effects of job demands operates this way (Collins, 2008; Bakker et al., 2010). Therefore, the find-ings of negative correlations between these two work dimensions corroborate such hy-pothesis.
The “Psychological Job Demand” was positively associated to the “Skill Discretion” in both studies. A plausible explanation considers that work contexts with intellectual and polyvalent demands require continuous updating from the workers in order to cope with the activity specific skills (Kawakami et al., 1995). Another explanation rein-forces a positive understanding of the job demands, particularly when associated with the use of resources (workers’ abilities and/or organizational context) to obtain career opportunities [20]. From this perspective, demands comprise not only the compliance with the job requirements, but they also learning and achievement of new skills, thereby forging a straight relationship between the work psychological dimensions.
“Repetitive work” presented low factor loading and, for this reason, it was removed from the model. This item has shown irregular performance compared with the other items from the “Skill Discretion” subscale (Niedhammer, 2002; Li et al., 2004; Eum et
al., 2006; Hökerberg et al., 2010; Chungkham et al., 2013; Hökerberg et al., 2014). In
demands than to a component from the autonomy dimension. When the work occurs under tight managerial control, frequently also occurs the definition of rhythms, in-tense movements and time pressure, implying in repetitiveness and acceleration of ac-tivities. All this process makes repetitive work be perceived as a job demand compo-nent. Therefore, the perception of this item can arise dubiety when assessing the worker control upon his job (skill discretion).
The “Psychological Job Demand” scale presented an acceptable structure. The item “No excessive work” had low factor loadings among health workers. Among petroleum workers, the item “Conflicting demands” had low factor loading. This item usually presents low discriminant power and poor correlation with the remaining items, sug-gesting the need of reviewing this scale structure (Niedhammer, 2002; Sale & Kerr,
2002; Li et al., 2004; Araújo & Karasek, 2008). The discussion about the “Psychological
Job Demand” scale has focused on the content multidimensionality and on its psycho-metric deficiencies (Choi et al., 2008). Different work contexts may comprise quantita-tive (excessive demands) and qualitaquantita-tive (intellectual demands) natures. Therefore, this scale irregular performance can be associated to possible correlations between control (“Decision Latitude”) subscales, whereas some work contexts do not have fixed routine but high skill and creativity levels (Mase et al., 2012). In spite of the complexity and the difficulty to evaluate this construct, this study found negative, albeit low, correlations between “psychological job demands” and components of social support and of author-ity decision. Social support components play important role in the organization and reduction of work burden, and they favour the use of appropriate resources for task ex-ecution (Collins, 2008).
(Bakker et al., 2010).
In both studies, social support subscales showed strong correlations, presented high factor loadings that contribute to model interpretation, and their items satisfied the in-ternal consistency criteria. Keeping these subscales in the dimensional structure did not affect the model fit criteria, differing from other studies findings (Hökerberg et al.,
2010; Chungkham et al., 2013). As expected, social support subscales showed positive
correlations with skill discretion, and decision authority; and negative correlations with psychological job demands, in both studies.
The permanence of the social support dimension and its subscales in the JCQ has been discussed (Sale & Kerr, 2002; Sanne, Torp, Mykletun, & Dahl, 2005; Hökerberg et
al., 2010; Chungkham et al., 2013; Hökerberg et al., 2014), and most authors approved
their preservation in the model (Li et al., 2004; Edimansyah et al., 2006; Eum et al., 2006; Niedhammer et al., 2006; Araújo & Karasek, 2008; Phakthongsuk & Apakupakul,
2008; Choobineh et al., 2011; Chungkham et al., 2013; Nehzat et al., 2014).
Psychome-tric evaluations revealed consistent and coherent measurements for the construct eva-luated with these subscales, in both studies. The social support subscales performed differently, probably because of the JCQ several formats. The maintenance of the social support dimension this instrument should be determined by theoretical criteria, or by the research subject (Chungkham et al., 2013). Factor loadings, average variance ex-tracted (AVE) and composite reliability indicated convergent validity in the two stu-dies. JCQ scales showed acceptable proportion of extracted variance, even when factor loadings and composite reliability were low. This fact demonstrates that the instrument shares the explained variance, and its items consistently represent the latent construct evaluated by its scales and subscales (Hair et al., 2006).
The JCQ discriminant validity indicator (√AVE) had adequate performance in the two studies, revealing the ability of the instrument scales to remain unmodified by con-structs that diverge about the proposed measurement object. Nonetheless, in the petro-leum workers study, the control subscales did not show good discriminant capacity of the construct, since the high correlations found among factors denote poor distinction among the subscales. Similar results have been reported by other authors (Sanne et al.,
2005; Phakthongsuk & Apakupakul, 2008), who argued that the heterogeneity of the
working populations could have affected the discriminant ability of the control subs-cales.
The work in the health area has strong influence of the worker autonomy and of co-worker social support, while the work in the petroleum industry is highly hierarchical and organized in a well-defined institutional space. In spite of these different occupa-tional contexts, the JCQ showed correspondence with its theoretical framework, and has confirmed the structure of its scales and subscales.
the important item “repetitive work” from the “Skill Discretion” subscale to another scale or subscale of the instrument. The other validity indicators we analysed in this study support the structure proposed by the JCQ for the evaluation of the work subjec-tive characteristics.
5. Conclusion
The JCQ dimensional structure corresponded to its theoretical framework in the two work contexts analyzed.
References
Araújo, T. M., & Karasek, R. (2008). Validity and Reliability of the Job Content Questionnaire in Formal and Informal Jobs in Brazil. Scandinavian Journal of Work, Environment & Health, 34,
52-59.
Bakker, A. B., Van Veldhoven, M., & Xanthopoulou, D. (2010). Beyond the Demand-Control model: Thriving on High Job Demands and Resources. Journal of Personnel Psychology, 9,
3-16.http://dx.doi.org/10.1027/1866-5888/a000006
Brown, M. W., & Cudeck, R. (1993). Alternative Ways of Assessing Model Fit. In K. A. Bollen, & J. S. Long (Eds.), Testing Structural Equation Models (pp. 136-162). Newbury Park, CA: Sage. Brown, T. A. (2006). Confirmatory Factor Analysis for Applied Research. New York: Guilford
Press.
Cattell, R. B. (1966). The Scree Test for the Number of Factors. Multivariate Behavioral Research, 1, 245-276.http://dx.doi.org/10.1207/s15327906mbr0102_10
Cheng Y., Luh W. M., & Guo, Y. L. (2003). Reliability and Validity of the Chinese Version of the Job Content Questionnaire in Taiwanese Workers. International Journal of Behavioral Medi-cine, 10, 15-30.http://dx.doi.org/10.1207/S15327558IJBM1001_02
Choi, B., Kawakami, N., Chang, S., Koh, S., Bjorner, J., Punnett, L., & Karasek, R. (2008). A Cross-National Study on the Multidimensional Characteristics of the Five-Item Psychological Demands Scale of the Job Content Questionnaire. International Journal of Behavioral Medi-cine, 15, 120-132.http://dx.doi.org/10.1080/10705500801929742
Choobineh, A., Ghaem, H., & Ahmedinejad, P. (2011). Validity and Reliability of the Persian (Farsi) Version of the Job Content Questionnaire: A Study among Hospital Nurses. Easter Me-diterranean Health Journal, 17, 335-341.
Chungkham, H. S., Ingre, M., Karasek, R., Westerlund, H., & Theorell, T. (2013). Factor Struc-ture and Longitudinal Measurement Invariance of the Demand Control Support Model: An Evidence from the Swedish Longitudinal Occupational Survey of Health (SLOSH). PloS ONE, 8, 705-741.http://dx.doi.org/10.1371/journal.pone.0070541
Collins, S. (2008). Statutory Social Workers: Stress, Job Satisfaction, Coping, Social Support and Individual Differences. British Journal of Social Work, 38, 1173-1193.
http://dx.doi.org/10.1093/bjsw/bcm047
Edimansyah, B. A., Rusli, B. N., Naing, L., & Mazalisah, M. (2006). Reliability and Construct Va-lidity of the Malay Version of the Job Content Questionnaire (JCQ). The Southeast Asian Journal of Tropical Medicine and Public Health, 37, 412-416.
Eum, K. D., Li, J., Juhn, H. J., Parque, J. T., Tak, S. W., Karasek, R., & Cho, S. I. (2006). Psycho-metric Properties of the Korean Version of the Job Content Questionnaire: Data from Health Care Workers. International Archives of Occupational and Environmental Health, 80, 497-504.
Fonseca, I. S. S., Araújo, T. M., Santos, K. O. B., & Amado, N. (2014). Social Support and Job Sa-tisfaction in Employees of an Oil Company. Psicología para América Latina, 25, 43-56. Fornell, C., & Larcker, D.F. (1981). Evaluating Structural Equation Models with Unobservable
Variables and Measurement Error. Journal of Marketing Research, 18, 39-50.
http://dx.doi.org/10.2307/3151312
Gimeno, D., Benavides, G., Amick, B. C., Benach, J., & Martinez, J. M. (2004). Psychosocial Fac-tors and Work Related Sickness Absence among Permanent and Non-Permanent Employees.
Journal of Epidemiology & Community Health, 58, 870-876.
http://dx.doi.org/10.1136/jech.2003.016634
Gomez-Ortiz, V., & Moreno, L. (2009). Psychosocial Work Factors (Demand-Control and Effort- Reward Imbalance), Mental Health and Blood Pressure: A Study with School Teachers in Bo-gotá, Colombia. Universitas Psychologica, 9, 393-407.
Green, S., & Thompson, M. (2005). Structural Equation Modeling in Clinical Psychology Re-search. In M. Roberts, & S. Ilardi (Eds.), Handbook of Research in Clinical Psychology. Ox-ford: Wiley-Blackwell.
Griep, R. H., Rotenberg, L., Landsbergis, P., & Vasconcellos-Silva, P. R. (2011). Combined Use of Job Stress Models and Self-Rated Health in Nursing. Revista de Saúde Publica, 45, 145-152.
http://dx.doi.org/10.1590/S0034-89102011000100017
Hair, J. F., Black, H. C., Babin, B. J., Anderson, R. E., & Tatham, R. L. (2006). Multivariate data analysis (6th ed.). Upper Saddle River, NJ: Pearson Prentice Hall.
Hökerberg, Y. H. M., Aguiar, O. B., Reichenheim, M., Valente, J. G., Fonseca, M. J., & Passos, S. R. (2010). Dimensional Structure of the Demand Control Support Questionnaire: A Brazilian Context. International Archives of Occupational and Environmental Health, 83, 407-416.
http://dx.doi.org/10.1007/s00420-009-0488-4
Hökerberg, Y. H. M., Reichenheim, M. E., Faerstein, E., Valente, J. G., Fonseca, M. J., & Passos, S. R. (2014). Cross-Cultural Validity of the Demand-Control Questionnaire: Swedish and Brazil-ian Workers. Revista de Saúde Pública, 48, 486-496.
http://dx.doi.org/10.1590/S0034-8910.2014048005126
Horn, J. L. (1965). A Rationale and Test for the Number of Factors in Factor Analysis. Psycho-metrika, 30, 179-185. http://dx.doi.org/10.1007/BF02289447
Hu, L.-T., & Bentler, P. M. (1999). Cutoff Criteria for Fit Indexes in Covariance Structure Analy-sis: Conventional Criteria versus New Alternatives. Structural Equation Modeling: A Multidis-ciplinary Journal, 6, 1-55. http://dx.doi.org/10.1080/10705519909540118
Karasek, R. (1979). Job Demand, Job Decision Latitude, and Mental Strain: Implications for Job Redesign. Administrative Science Quarterly, 24, 285-308. http://dx.doi.org/10.2307/2392498
Karasek RA 1985. Job Content Questionnaire and User’s Guide. University of Massachusetts. Karasek, R. (2008). Low Social Control and Physiological Deregulation—The Stress-Dise-
quili-brium Theory, towards a New Demand-Control Model. Scandinavian Journal of Work, Envi-ronment & Health, 34, 117-135.
Kawakami, N., Kobayashi, F., Araki, S., Haratani, T., & Furui, H. (1995). Assessment of Job Stress Dimensions Based on the Job Demand-Control Model of Employees of Telecommunication and Electric Power Companies in Japan: Reliability and Validity of the Japanese Version of Job Content Questionnaire. International Journal of Behavioral Medicine, 2, 358-375.
http://dx.doi.org/10.1207/s15327558ijbm0204_5
Kline, P. (1994). An Easy Guide to Factors Analysis. Abingdon, VA: Routledge, Taylor and Fran-cis Group.
(Mainland) Version of Job Content Questionnaire: A Study in University Hospitals. Industrial Health, 42, 260-267.
Mase, J., Ota, A., Inoue, K., Iida, T., Tsutsumi, U., Yatsuya, H., & Ono, Y. (2012). Reliability and Validity of the Japanese Translated Version of the Swedish Demand-Control-Support Ques-tionnaire. Industrial Health, 50, 467-475.
Muthén, L. K., & Muthén, B. O. (2012). Mplus User’s Guide (7th ed.). Los Angeles, CA: Muthén & Muthén.
Nehzat, F., Huda, B. Z., & Tajuddin, S. H. (2014). Reliability and Validity of Job Content Ques-tionnaire for University Research Laboratory Staff in Malaysia. The Southeast Asian Journal of Tropical Medicine and Public Health, 45, 481-489.
Niedhammer, I. (2002). Psychometric Properties of the French Version of the Karasek Job Con-tent Questionnaire: A Study of the Scales of Decision Latitude, Psychological Demands, Social Support, and Physical Demands in the GAZEL Cohort. International Archives of Occupational and Environmental Health, 75, 129-144. http://dx.doi.org/10.1007/s004200100270
Niedhammer, I., Ganem, V., Gendrey, L., David, S., & Degioanni, S. (2006).Propriétes psycho- métriques de la version française des échelles de La demande psychologique, de la latitude décisionnelle et du soutien social du “Job Content Questionnaire” de Karasek: Résultats de I’enquête nationale SUMER. Santé Publique, 18, 413-427.
http://dx.doi.org/10.3917/spub.063.0413
Nunnaly, J. (1978). Psychometric Theory. New York: McGraw-Hill.
Phakthongsuk, P., & Apakupakul, N. (2008). Psychometric Properties of the Thai Version of the 22-Item and 45-Item Karasek Job Content Questionnaire. International Journal Occupational Medicine and Environment Health, 21, 331-344. http://dx.doi.org/10.2478/v10001-008-0036-6
Sale, J. E. M., & Kerr, M. S. (2002). The Psychometric Properties of Karasek’s Demand and Con-trol Scales within a Single Sector: Data from a Large Teaching Hospital. International Archives of Occupational and Environmental Health, 75, 145-152.
http://dx.doi.org/10.1007/s004200100289
Sanne, B., Torp, S., Mykletun, A., & Dahl, A. A. (2005). The Swedish Demand-Control- Support Questionnaire (DCSQ): Factor Structure, Item Analyses, and Internal Consistency in a Large Population. Scandinavian Journal of Public Health, 33, 166-174.
http://dx.doi.org/10.1080/14034940410019217
Santavirta, N. (2003). Construct Validity and Reliability of the Finnish Version of the De-mand-Control Questionnaire in Two Samples of 1028 Teachers and 630 Nurses. Educational Psychology, 23, 423-436. http://dx.doi.org/10.1080/01443410303208
Tabatabaee Jabali, S. M. T., Ghaffari, M., Pournik, O., Ghalichi, L., Tehrani Yazdi, A. R., & Mo-tevalian, S. A. (2013). Reliability and Validity of Persian Version of Job Content Questionnaire in Health Care Workers in Iran. International Journal Occupational Medicine and Environ-ment Health, 4, 96-101.
Submit or recommend next manuscript to SCIRP and we will provide best service for you:
Accepting pre-submission inquiries through Email, Facebook, LinkedIn, Twitter, etc. A wide selection of journals (inclusive of 9 subjects, more than 200 journals)
Providing 24-hour high-quality service User-friendly online submission system Fair and swift peer-review system
Efficient typesetting and proofreading procedure
Display of the result of downloads and visits, as well as the number of cited articles Maximum dissemination of your research work