http://www.scirp.org/journal/fns ISSN Online: 2157-9458
ISSN Print: 2157-944X
Effect of Cooking and Reconstitution
Methods on the Loss of Bioactive Compounds in
Pigmented and Unpigmented Potatoes
Mohammed Z. Alam1, Gefu Wang-Pruski1*, Mark Hodges2, Garry R. Hawkins3, Martin Dino Kubik4, Sherry A. E. Fillmore2
1Faculty of Agriculture, Dalhousie University, Truro, Canada
2Atlantic Food and Horticulture Research Centre, Agriculture and Agri-Food Canada, Kentville, Canada
3McCain Foods Ltd., Florenceville-Bristol, Canada
4Agriculture and Agri-Food Canada, Ottawa, Canada
Abstract
Total phenolics, anthocyanins and antioxidant capacity of five coloured/pigmented (AR2009-10, Adirondack Red, Adirondack Blue, Congo, and POROIPG22-1) and two unpigmented potato genotypes (“Anuschka” and “Russet Burbank”) were as-sessed in fresh (with and without skin) and commercially processed/cooked/recon- stituted products. Ascorbate profiles of the seven genotypes also were investigated using fresh tuber/tissue only. The results showed that genotypes greatly varied in their contents of bioactive compounds. Ascorbate profiles of the genotypes were not associated to any particular flesh colour/pigment. However, the pigmented potatoes had 1.5 to 2.5 times more the phenolics, 2 to 3 times more antioxidant capacity and higher levels of anthocyanins (13.98 to 38.57 mg C3GE−100g FW) compared to
un-pigmented genotypes. No anthocyanins were detected in the unun-pigmented potatoes. Significant losses of total phenolics, anthocyanins and total antioxidant capacity were found during peeling (18% - 23%), blanching process (40% - 60%) and further cook-ing/reconstitution (7% - 12%) with no prominent genotype differences. Together, 65 to 90% of these bioactive compounds were lost during processing. The results sug-gested that pigmented potatoes contained higher amounts of total phenolics and an-thocyanins and blanching step took away the most of the original bioactive com-pounds.
Keywords
Potato, Phenolics, Antioxidant Capacity, Cooking, Reconstitution
1. Introduction
Population-based epidemiological studies have stressed the important role of diet and
How to cite this paper: Alam, M.Z., Wang-Pruski, G., Hodges, M., Hawkins, G.R., Kubik, M.D. and Fillmore, S.A.E. (2017) Effect of Cooking and Reconstitu-tion Methods on the Loss of Bioactive Compounds in Pigmented and Unpig-mented Potatoes. Food and Nutrition Sci- ences, 8, 31-55.
http://dx.doi.org/10.4236/fns.2017.81003 Received: September 16, 2016
Accepted: December 9, 2016 Published: December 12, 2016 Copyright © 2017 by authors and Scientific Research Publishing Inc. This work is licensed under the Creative Commons Attribution International License (CC BY 4.0).
http://creativecommons.org/licenses/by/4.0/
lifestyle in the emergence of many degenerative chronic diseases, such as cancers and cardiovascular diseases, in both developed and developing countries [1]. If a global health goal is to increase the amounts of vitamins, minerals or phytonutrients con-sumed in the diet, then a sensible approach is to further enhance the nutritional content of highly consumed crops. The nutritional value of the potato (Solanum tuberosum L.) is worth considering with regard to the high consumption of potatoes in the world and the body of evidence showing the relationship between diet and human diseases [1] [2]. Potato is currently the fourth most important crop worldwide after rice, wheat and maize with about 324 million tonnes production in 2010 [3]. The annual diet of an av-erage global citizen in the first decade of the 21st century included about 33 kg of pota-toes. In many developed countries, potato represents a secondary staple crop, with an average per capita consumption of around 75 kg∙year−1 in 2007 [4]. In developing
countries, its consumption is around 20 kg∙year−1 per capita but rapid expansion over
the past few decades has occurred in southern and eastern Asia [4]. In the Andes of South America, the potato consumption can reach 250 kg∙year−1 per capita. In these
re-gions, potato constitutes the main staple crop, and most households cultivate 10-12 va-rieties in order to reduce their vulnerability to environmental conditions [5].
Potato is an exceptionally high-yielding carbohydrate-rich crop and much of the world’s production is occupied by modern yellow-and white-fleshed potatoes. Other notable features are a high-quality protein, a significant level of vitamin C [6] [7] [8] that contributes substantially to the Recommended Daily Allowance [8], also certain minerals such as potassium, phosphorus, and magnesium [5]. Beyond these basic nu-trients, less well known are significant amounts of bioactive compounds (including phenolics and carotenoids) in potato which are potent antioxidants [9] [10].
Promising routes for enhancing the quality of staple crops include biotechnologies and conventional plant breeding. Although some efforts to improve potato carotenoid [11] or phenolic contents [12] are currently made through transgenic approaches, natural variations in the potato germplasm may also offer nutritionally interesting po-tato genotypes. Of particular interest are the native Andean popo-tato landraces (pig-mented potatoes). Andean potato landraces are extremely diverse as compared to modern potato varieties, ranging from diploids to pentaploids; a wide variability in tu-ber shape, flesh and skin color, and flavour; in storage and cooking quality [10] [12] [13] and, so far, are largely unexplored from nutritional point of view.
peel, approaching 900 mg in purple-fleshed and 500 mg in red-fleshed types per 100 g FW (of the peel alone).
Given that potato is not consumed fresh by humans, it is fundamental to measure the bioactive compounds after cooing. However, other than domestic cooking; there is little published information on the effects of commercial cooking/processing on its con-stituents (except vitamin C) particularly in different colour-fleshed potatoes. Physical and/or chemical (degradation or losses of sensitive nutrients) alterations are possible depending on methods used to process potatoes [6] [16] [17] and obtaining processed products that keep more of their original characteristics are one of the most tangible challenges in potato processing industry, because of their content of antioxidant meta-bolites which are readily prone to thermal degradation. If a substantial amount of po-tato bioactive components survive cooking, then introducing new genotypes with even higher amounts would be a logical approach to boosting dietary intake.
There are contradictory reports on the effects of cooking on bioactive compounds of potato in the literature. A number of studies have charted the loss of vitamin C during diverse cooking and processing steps. In a review, Brown [18] reported that 20% to 45% of vitamin C is lost due to diffusion into the water bath during blanching (an important part of pre-cooked French fry production) and processing of potato into flakes almost totally eradicated vitamin C. Other studies have shown that different cooking treat-ments reduce various phenolic compounds in potatoes [6] [16] [19]. One study exam-ining the effects of cooking procedures on mature potatoes showed that baking in an oven at 212˚C for 45 min, boiling in water for 30 min, or microwaving at 218˚C for 30 min, decreased chlorogenic acid to 0%, 35%, and 55% of the original amount, respec-tively [20].
In contrast, scientifically optimized microwaving (2 min 30 s at high in an 1100 W microwave), baking (375˚C for 30 min), boiling (18 min), steaming (15 min) and stir- frying in cold-pressed canola oil (18 min) of developmentally young (small sized) po-tatoes of three genotypes resulted in an increase in recoverable amounts of the total phenolics, chlorogenic acids, rutin, kaempferol-rutinose, vitamin C and antioxidant ac-tivities [8]. Other studies showed an increase in most of the individual phenolic com-pounds and antioxidant activity cooked by baking, frying and microwaving when compared to uncooked tuber samples [7] [8]. However, published data on the extent of variation with regard to phytonutrient contents in commercially processed potato products especially within the colour-fleshed potatoes are scarce.
Aims of this study were to quantify the bioactive components (ascorbate, total anti-oxidants, total phenolics and anthocyanin) of seven potato genotypes and selections and evaluate how the commercial processing methods and subsequent freezing and fi-nal reconstituted cooking methods affect their bioactive components.
2. Materials & Methods
2.1. Potato GenotypesFigure 1. Skin and flesh colour of the potato genotypes. Potato genotypes: Clockwise from the left; AR2009-10 (recently registered as “AAC Blue Steele”), Adirondack Red, Adirondack Blue, Anuschka, Congo, POROIPG22-1, and Russet Burbank.
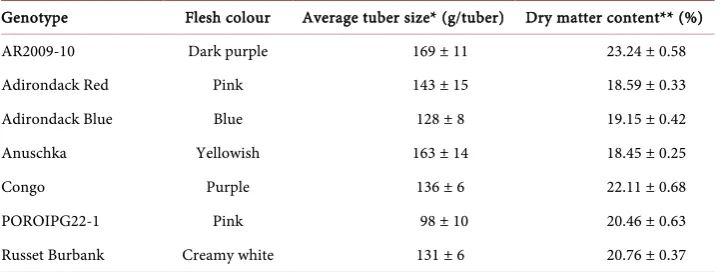
Table 1. Name, flesh colour, average tuber size and dry matter content of the genotypes.
Genotype Flesh colour Average tuber size* (g/tuber) Dry matter content** (%) AR2009-10 Dark purple 169 ± 11 23.24 ± 0.58 Adirondack Red Pink 143 ± 15 18.59 ± 0.33 Adirondack Blue Blue 128 ± 8 19.15 ± 0.42 Anuschka Yellowish 163 ± 14 18.45 ± 0.25 Congo Purple 136 ± 6 22.11 ± 0.68 POROIPG22-1 Pink 98 ± 10 20.46 ± 0.63 Russet Burbank Creamy white 131 ± 6 20.76 ± 0.37 *Average weight ± SE (n = 28). **Mean dry matter content ± SE (n = 4).
Food Canada (AAFC) selections; POROIPG and “Anuschka” were McCain Foods Ltd. Canada selections; Congo and “Russet Burbank” were used as control. AR2009-10 has now been registered as a variety “AAC Blue Steele” in Canada.
2.2. Field Trials
The tubers were grown on the research farm of McCain Foods Ltd., 200 Greenfield Road, Greenfield, New Brunswick, Canada (46˚27.58'N, 67˚38.06'W). The soil of the trial plot was predominantly Caribou gravelly silt loam series; well drained with less than 5% slope on most of the farm; high in P and K; medium in Ca2+ and Mg2+; 2.3% -
[image:4.595.195.556.420.556.2]On 25 May 2012, plots were staked off in the field and furrows opened and fertilizer (16-9-30 3B at 200 kg∙ha−1) banded using a modified pea planter. Cut seeds (~60 g in
weight) of the seven genotypes were hand dropped at 30 - 40 cm spacing in 9 m long rows for each genotype. Each plot (9.0 m × 1.82 m = 16.38 m2) consisted of two rows at
91 cm apart. Seeds were covered using disks mounted to a tractor. The plots were ar-ranged in a randomized complete block design with four replications. Hilling was com-pleted once 20 days after planting using a single pass row forming hiller. Standard pest protection measures were taken with routinely sprayed fungicides (mainly to control late blight) and insecticides (mainly to control Colorado potato beetle and flea beetles). The plants received a total of 366 mm of precipitation during the 120-day growth pe-riod (since 25 May to 25 September 2012). Maximum and minimum daily temperatures during the growing period ranged between 10.6˚C to 31.3˚C and 0.8˚C to 19.8˚C re-spectively.
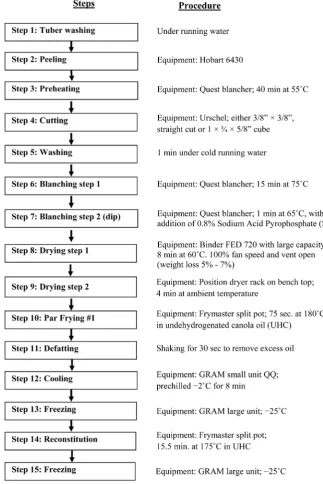
On 25 September 2012, plots were harvested with a two-row potato digger and picked up by hand. After grading, the tubers were stored at the McCain Food Research Farm storage at 13˚C and 90% RH. A portion of the representative tuber samples (around 25 tubers for each genotype and replicates) were shipped to AAFC, Kentville, Nova Scotia (NS) laboratory and portions of the rest tubers were processed at McCain’s commercial potato processing facility [on 20 Nov. 2012 (rep 1), 22 Nov. 2012 (rep 2), 4 Jan. 2013 (rep 3) and 16 Jan. 2013 (rep 4)]. Based on types of industrial products, de-fined methods for processing, cooking and reconstitution were selected. Processing methods were blanching and freezing; cooking methods were microwave and frying; reconstitution methods were oven baking and frying. Combinations of these methods were made, generating five types of samples: Blanching-freezing (BF), Blanching- freezing microwave (BFM), Blanching-frying-freezing (BFF), Blanching-frying-freezing oven (BFFO), and Blanching-frying-freezing fryer (BFFF) samples. Step by step potato processing at McCain Foods Ltd. has been presented in Figure 2. The processed sam-ples were shipped (in dry ice) to AAFC, Kentville, NS. The samsam-ples were subsequently freeze-dried, ground and stored at −80˚C until further analysis.
2.3. Tuber Storage and Tissue Sampling
The refrigerated shipment from McCain Foods Ltd., NB, Canada of around 25 whole tubers for each genotype and replication were received at AAFC, Kentville, NS on 11 October 2012. Tubers were stored immediately at 13˚C and at 90% RH. After four weeks, the storage room temperature was reduced to 12˚C. Thereafter, the temperature was reduced by 1˚C every two weeks till it reached to 9˚C and this temperature was maintained till the end of the study. The humidity remained always the same (90% RH) until the end of the study.
2.3.1. Initial Fresh (IF) Samples
Figure 2. Step by step potato processing (at MaCain Foods Ltd.) followed for this study. Note: Samples and steps involved; BF = 1 - 9 & 15; BFM = 1 - 9 & 13 - 15; BFF = 1 - 13; BFFO and BFFM = 1 - 15.
of the seven tubers. The remaining portions of the tubers were put aside. The coins were cut again at the center portion to take two ~1 cm2 bars. The skin from both ends
(
)
% Moisture= fresh weight−actual dry weight fresh weight 100×
(
)
% Dry matter= actual dry weight fresh weight ×100
The remaining portions of the seven tubers were longitudinally cut into two halves. One half was discarded and the other halves from each portion were chopped together into small pieces as ascorbate samples but including the skin. These with skin samples and the left over (without skin) samples from sacorbate analysis were thoroughly mixed together, frozen in liquid nitrogen, freeze-dried and preserved at −80˚C which com-prised initial fresh (IF) samples. Therefore, IF samples were actually a combination of with skin (~60%) and without skin (~40%) samples.
2.3.2. Fresh “with Skin” (FWS) and Fresh “No Skin” (FNS) Samples
These samples were processed on 9th, 10th, 11th and 22nd of January 2013, respectively,
for Rep 1, 2, 3 and 4 (about 9 - 10 weeks after processing the initial fresh samples). For FWS and FNS samples, eight whole tubers from each genotype and rep were randomly chosen from the storage, washed and dried as described above. Each tuber was longitu-dinally cut into halves. Then one half was peeled using a standard kitchen peeler (at 1 - 2 mm depth) and chopped together. The other halves were chopped together with skin. The samples were separately frozen in liquid nitrogen, freeze-dried and preserved at −80˚C similarly as initial fresh samples.
The above sampling produced three groups of fresh samples for each genotype. After the industrial processed samples arrived, they were freeze-dried and stored at −80˚C until further analysis. Together, final samples for each genotype/selection were: I) Ini-tial fresh (IF); II) Fresh with skin (FWS); III) Fresh no skin (FNS); IV) Blanching- freezing (BF); V) Blanching-freezing microwave (BFM);VI) Blanching-frying-freezing (BFF); VII) Blanching-frying-freezing oven (BFFO); and VIII) Blanching-frying-freez- ing fryer (BFFF).
2.4. Determination of Total and Reduced Ascorbate Contents
acid (100 µL) was added to each sample and standard to neutralize dithiothreitol and to acidify the solution for high performance liquid chromatography (HPLC) analysis. Samples were then filtered through 0.2 µm polyvinylidene fluoride filters (Chroma-tographic Specialties Inc., Canada) fitted to a glass syringe that was rinsed three times with methanol between samples. Reduced and total ascorbates were quantified with an isocratic HPLC (Waters Corp., Milford, MA) with a C18 guard and analytical column (Luna 5 µL 150 × 4.6 mm i.d., Phenomenex, Torrance, CA). Recoveries for ascorbate spiked samples were >95%.
2.5. Determination of Total Phenolics
Total phenolics were extracted and analyzed based on the method developed by Single-ton and Rossi [22] and Folin and Ciocalteu [23] with some modifications. Powdered freeze-dried samples for each genotype and replicate were taken from −80˚C and 0.250 g of white/yellow or 0.125 g of pink/purple/blue potato tissue samples were weight out in 50 mL centrifuge tubes. A 10 mL of extraction solution (40% acetone, 40% methanol, 20% Milli-Q water and 0.1% formic acid) was added, vortexed and sonicatedat#15 for 30 sec and left under dim light for 30 min. The sample was then centrifuged at 10,000 × g for 15 minand the supernatant was transferred to clean 50 mL centrifuge tubes and kept in fridge until use. A second extraction was done similarly and the supernatant was added together to have a 20 mL volume. A 25 µL of standard or sample extract into 4 wells each of a 96-well microplate was used for activity assay at 750 nm on a Mul-tiskan Spectrum microplate reader (Thermo Fisher Scientific, Ventaa, Finland) using 250 µL Milli-Q water, 50 µL Folin-Ciocalteu reagent and 12.5 µL saturated Na2CO3.
Re-gression line was generated from the standard absorbance and used to quantitate the samples absorbance to obtain “mg∙gE/g DW” (mg∙gallic Acid Equivalent/g Dry Weight) values using the following formula:
( )
(
Sample mg L extraction volume L×)
tissue weight g( )
=mg gEg⋅ −1DW2.6. Determination of Total Antioxidant Capacity by ORAC
azobis (2-amidinopropane) dihydrochloride (AAPH) as a peroxyl generator and 6- hydroxy-2,5,7,8-tetramethylchroman-2-carboxylic acid (Trolox) as a standard accord-ing to the method developed by Prior et al. [24]. The antioxidant capacity was ex-pressed as TE∙g−1 DW.
2.7. Determination of Anthocyanin
Anthocyanins were determined based on the methods developed by Lee et al. [25] with some modifications. About 50 mg finely ground lyophilized potato tissue was weighed into 50 mL centrifuge tubes. A 10mL of extraction solution (40% acetone, 40% metha-nol, 20% Milli-Q water and 0.1% formic acid) was added, vortexed and sonicated at #15 for 30 sec and left under dim light for 1 h and 30 min but vortexed every 10 - 15 min. The sample was then centrifuged at 15,000 × g for 15 min then 8 mL of the supernatant was transferred into clean glass tubes and placed under flow of nitrogen. After drying, 2 mL of Milli-Q water was added, shaken well and transferred intopre-weighed small glass vials and placed for freeze-drying. After freeze-drying, weight of the vials were recorded again and 1 mL of Milli-Q water was added to each vial. Two 96-well mi-croplates were used for each set of samples (sample + pH 1.0 buffer; and sample + pH 4.5 buffer) for assay at 700 nm and 520 nm on a “Multiskan Go” microplatereader (Thermo Fisher Scientific, Ventaa, Finland). Final volume in wells was 300 µL. The re-sults were expressed as mg C3GE−100g FW (Cyanidin-3-glucoside equivalents).
2.8. Statistical Analysis
The treatments were arranged as a two-factor (potato genotypes and cooking/recanta- tion methods) factorial randomized complete block design with four replications. Data were subjected to analysis of variance using SAS (SAS Institute, Inc., Cary, NC). When F was significant at the P < 0.05 level, treatment means were compared and separated using the least significant difference test (LSD). Regression analyses were performed to investigate the relationships betweenphenolics vs antioxidant capacity; anothocyanins vs total antioxidant capacity; anthocyanins vs total phenolics; and total ascorbate vs to-tal antioxidant capacity.
3. Results
3.1. Total, Reduced and Oxidized Ascorbates
Total ascorbate (AsA) contents significantly varied (P < 0.0001) between genotypes and ranged between 152 - 358 µg∙g−1 FW with the highest content in “Anuschka”, followed
by Adirondack Blue (315 µg∙g−1 FW; Figure 3(a)). The lowest amount was determined
in POROIPG22-1 (152 µg∙g−1 FW) followed by Adirondack Red (195 µg∙g−1 FW). Russet
Burbank, Congo and AR2009-10 had similar and intermediate amounts of total ascor-bates (~250 µg∙g−1 FW). Reduced ascorbate contents followed similar trends among the
genotypes and on average of all genotypes was about 76% of the total ascorbate (i.e. ~24% oxidized ascorbate, Figure 3(a)). Regarding oxidized ascorbate, AR2009-10 had the highest amount (93 µg∙g−1 FW) followed by Congo (74 µg∙g−1 FW). Adirondack Red,
(a)
[image:10.595.249.503.69.468.2](b)
Figure 3. Total, reduced and oxidized ascorbate contents (a) and oxidized/reduced ascorbate ra-tio (b) of the seven potato genotypes (uncooked). The bars represent mean values of four
repli-cates (±SE). Means with different letters (within a group) are significantly different at P < 0.05.
The boxed value indicates percent of total ascorbate content.
Congo, Anuschka and Russet Burbank (Figure 3(a)). Regarding the ratio of oxidized/ reduced ascorbate, AR2009-10 had the highest oxidized/reduced ascorbate ratio fol-lowed by Congo. Anuschka had the lowest oxidized/reduced ascorbate ratio and other genotypes were statistically similar with either Anuschka or Congo (Figure 3(b)).
3.2. Total Phenolic Contents in Fresh Potatoes
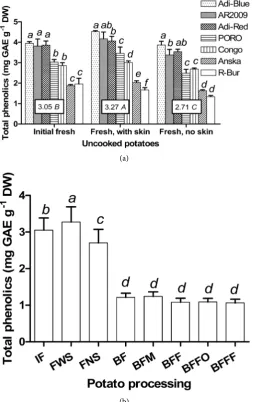
Genotypic differences in total phenolic contents, effects of processing/reconstitution and interaction between genotype × processing were highly significant (P < 0.0001). Total phenolics contents in initial fresh (IF, 60% no skin, 40% with skin) samples ranged between 1.88 to 3.96 mg∙g−1 DW. Adirondack Blue, AR2009-10 and Adirondack
(a)
(b)
Figure 4. Total phenolics contents of the seven uncooked potato genotypes (a) and effect of cooking (average over all genotypes) on total phenolics (b). The bars represent mean values of
four replicates (±SE). Bars with different letters within a group are significantly different at P <
0.05. The boxed values indicate average over all genotypes. IF = Initial fresh; FWS = Fresh, with skin; FNS = Fresh, no skin; BF = Blanching-freezing; BFM = Blanching-freezing microwave; BFF = Blanching-frying-freezing; BFFO = Blanching-frying-freezing oven; BFFF = Blanching-frying- freezing fryer.
Total phenolic contents in fresh-with skin (FWS) samples ranged between 1.67 to 4.52 mg∙g−1 DW (Figure 4(a)). In general, coloured potato genotypes (AR2009-10,
Adirondack Blue, Adirondack Red, Congo and POROIPG22-1) had 1.7- to 2.5-fold greater phenolics than the yellowish/white genotypes (Anuschka and Russet Burbank). Adirondack Blue had the highest amount of phenolics (4.52 mg∙g−1 DW) and the lowest
was in Russet Burbank (1.67 mg∙g−1 DW). However, the content in AR2009-10 was
[image:11.595.248.504.73.476.2]Peeling in general caused significant reduction in phenolic contents. Total phenolic contents in fresh-no skin (FNS) samples ranged between 1.34 to 3.87 mg∙g−1 DW (11%
to 28% reductions compared to FWS samples) with the highest reduction in POROIPG22-1 (28%) followed by AR2009-10, Anuschka and Russet Burbank (~20% reduction). Re-duction in other genotypes ranged between 11-14% (Figure 4(a)). On average over all genotypes, FWS samples had significantly higher amounts of total pehnolics (3.27 mg∙g−1 DW) compared to IF (3.05 mg∙g−1 DW) and IF samples had significantly greater
total phenolics compared to FNS (2.71 mg∙g−1 DW) samples.
3.3. Effect of Processing/Cooking/Reconstitution on Total Phenolics In this study, we aimed at investigating the effects of processing/cooking/reconstitu- tion, therefore, the data were averaged over all genotypes. It was found that fresh with skin (FWS) samples had the highest value at 3.27 mg∙g−1 DW total phonolics (Figure
4(b)). Initial fresh (IF) and fresh no skin (FNS) samples had, respectively, 7 and 18% lesser phenolics compared to FWS samples which were statistically significant (P < 0.05; Figure 4(b)). Cooking/reconstitution of the potatoes, blanching-freezing (BF) in particular, eliminated about 65% phenoics compared to FWS (and 58% compared to FNS). Further cooking/reconstitution processes (microwave, frying, oven and fryer) did not cause additional reductions in phenolic contents (Figure 4(b)).
3.4. Effect of Processing/Cooking/Reconstitution on Phenolics of Individual Genotype
Regarding individual genotypes, phenolic contents in IF and FWS samples did not dif-fer significantly (P > 0.05) in most genotypes except for Adirondack Blue and POROIPG22-1. However, peeling (FNS samples) caused significant (P < 0.05) amount of phenolic losses (compared to FWS) in most genotypes except for Congo and Russet Burbank (Table 2(a)).
Blanching removed most of the pehnolics in all genotypes with little or no further reductions with further processing/reconstitution, except for Congo. Congo had kept significantly (P < 0.05) greater (~7%) amounts of phenolics in BF samples compared to other cooking/reconstitution methods (Table 2(a)). In general, genotypes with greater initial levels of phenolics (coloured genotypes) lost more (~65%) and genotypes those had less phenolics to start with (Anuschka and Russet Burbank), lost less (~50%) to cooking/reconstitution (Table 2(a)).
3.5. Anthocyanin Contents in Fresh Potatoes
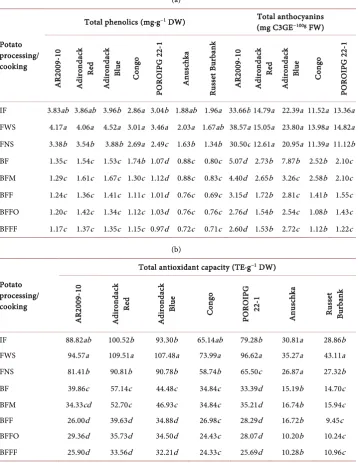
Table 2. (a) Effect of potato processing/cooking on total phenolics and anthocyanins of individu-al potato genotypes; (b) Effect of potato processing/cooking on totindividu-al antioxidant capacity of indi-vidual potato genotypes.
(a)
Potato processing/ cooking
Total phenolics (mg∙g−1 DW) Total anthocyanins
(mg C3GE−100g FW)
A R20 09 -10 Adiro nd ac k Red Adiro nd ac k Blu e C on go POR OI PG 2 2-1 A nu schka Russe t B ur ba nk A R20 09 -10 Adiro nd ac k Red Adiro nd ac k Blu e C on go POR OI PG 2 2-1
IF 3.83ab 3.86ab 3.96b 2.86a 3.04b 1.88ab 1.96a 33.66b 14.79a 22.39a 11.52a 13.36a
FWS 4.17a 4.06a 4.52a 3.01a 3.46a 2.03a 1.67ab 38.57a 15.05a 23.80a 13.98a 14.82a
FNS 3.38b 3.54b 3.88b 2.69a 2.49c 1.63b 1.34b 30.50c 12.61a 20.95a 11.39a 11.12b
BF 1.35c 1.54c 1.53c 1.74b 1.07d 0.88c 0.80c 5.07d 2.73b 7.87b 2.52b 2.10c
BFM 1.29c 1.61c 1.67c 1.30c 1.12d 0.88c 0.83c 4.40d 2.65b 3.26c 2.58b 2.10c
BFF 1.24c 1.36c 1.41c 1.11c 1.01d 0.76c 0.69c 3.15d 1.72b 2.81c 1.41b 1.55c
BFFO 1.20c 1.42c 1.34c 1.12c 1.03d 0.76c 0.76c 2.76d 1.54b 2.54c 1.08b 1.43c
BFFF 1.17c 1.37c 1.35c 1.15c 0.97d 0.72c 0.71c 2.60d 1.53b 2.72c 1.12b 1.22c
(b)
Potato processing/ cooking
Total antioxidant capacity (TE∙g−1 DW)
A R20 09 -10 Adiro nd ac k Red Adiro nd ac k Blu e C on go POR OI PG 22 -1 A nu schka Russe t Bu rb an k
IF 88.82ab 100.52b 93.30b 65.14ab 79.28b 30.81a 28.86b
FWS 94.57a 109.51a 107.48a 73.99a 96.62a 35.27a 43.11a
FNS 81.41b 90.81b 90.78b 58.74b 65.50c 26.87a 27.32b
BF 39.86c 57.14c 44.48c 34.84c 33.39d 15.19b 14.70c
BFM 34.33cd 52.70c 46.93c 34.84c 35.21d 16.74b 15.94c
BFF 26.00d 39.63d 34.88d 26.98c 28.29d 16.72b 9.45c
BFFO 29.36d 35.73d 34.50d 24.43c 28.07d 10.20b 10.24c
BFFF 25.90d 33.56d 32.21d 24.33c 25.69d 10.28b 10.96c
Note: Means with different lower case letters in a column are significantly different at P < 0.05. IF = Initial fresh; FWS = Fresh, with skin; FNS = Fresh, no skin; BF = Blanching-freezing; BFM = Blanching-freezing microwave; BFF = Blanching-frying-freezing; BFFO = Blanching-frying-freezing oven; BFFF = Blanching-frying-freezing fryer.
ever, contents in Congo were the lowest (Figure 5(a)). Anthocyanin contents in fresh- with skin (FWS) samples ranged between 13.98 to 38.57 mg C3GE−100g FW (Figure
5(a)) with the highest amount in AR2009-10 (38.57 mg C3GE−100g FW) followed by
Adirondack Blue (23.80 mg C3GE−100g FW). AdirondackRed, POROIGP22-1 and
Congo had similar and the lowest amounts of anthocyanins (~14.5 mg C3GE−100g FW).
[image:13.595.196.555.120.584.2](a)
[image:14.595.251.498.72.474.2](b)
Figure 5. Anthocyanin contents in five uncooked coloured-flesh potato genotypes (a) and effect of cooking (b) on anthocyanins (average over all genotypes). The bars represent mean values of
four replicates (±SE). Bars with different letters within a group are significantly different at P <
0.05. The boxed values indicate average over all genotypes. IF = Initial fresh; FWS = Fresh, with skin; FNS = Fresh, no skin; BF = Blanching-freezing; BFM = Blanching-freezing microwave; BFF = Blanching-frying-freezing; BFFO = Blanching-frying-freezing oven; BFFF = Blanching-frying- freezing fryer.
C3GE−100g FW) anthocyanins. Initial fresh (IF) and FNS samples had, respectively, 10%
and 19% lesser anthocyanins compared to FWS samples which were statistically sig-nificant (P < 0.05; Figure 5(b)).
3.6. Effect of Processing/Cooking/Reconstitution on Anthocyanin Contents
more) compared to BF samples (Figure 5(b)). Anthocyanins in BFM samples were sta-tistically similar with the BF samples and also were not significantly different from the BFF, BFFO and BFFF samples.
3.7. Effect of Processing/Cooking/Reconstitution on Anthocyanins of Individual Genotype
Regarding individual genotypes, peeling (FNS) did not significantly (P > 0.05) reduce anthocyanins in other genotypes except for AR2009-10 and POROIPG22-1 (Table 2(a)). Regarding initial fresh (IF) samples, only AR2009-10 had significantly (P < 0.05) lesser amount of anthocyanins compared to FWS samples (Table 2(a)). Nevertheless, it possessed the highest amounts of anthocyanins in fresh samples compared to all the other four genotypes. Cooking/reconstitution processes, blanching in particular, greatly eliminated anthocyanins in all genotypes with no further reductions with further proc-essing/reconstitution except for Adirondack Blue. Adirondack Bluehad significantly (P < 0.05) greater (~7%) amounts of anthocyanins in BF samples compared to other cooking/reconstitution methods (Table 2(a)).
3.8. Total Antioxidant Capacity of Fresh Potatoes
Genotypic differences in total antioxidant capacity, effects of processing/cooking/re- constitution and interaction between genotypes × processing were highly significant (P < 0.0001). In general, pigmented genotypes (AR2009-10, Adirondack Blue, Adiron-dack Red, Congo and POROIPG22-1) had 2- to 3-fold greater antioxidant capacities than the unpigmented genotypes (Anuschka and Russet Burbank; Figure 6(a)). Total antioxidant capacity in initial fresh (IF) samples ranged between 31 to 101 TE g−1 DW.
Adirondack Red had greater antioxidant capacity compared to AR2009-10. However, antioxidant capacity of Adirondack Blue was not significantly (P > 0.05) different from Adirondack Red and AR2009-10. Congo and POROIPG22-1, in this order respectively, had significantly (P < 0.005) lower antioxidant capacity compared to Adirondack Red, AR2009-10 and Adirondack Blue. Russet Burbank and Anuschka had similar and sig-nificantly (P < 0.005) lower antioxidant capacity compared to all five other genotypes (Figure 6(a)).
Total antioxidant capacity in fresh-with skin (FWS) samples ranged between 35 to 110 TE∙g−1 DW. Adirondack Red and Adirondack Blue had similar and the highest
an-tioxidant capacity followed by POROIPG22-1 and AR2009-10 (~95 TE∙g−1 DW).Congo,
Russet Burbank and Anuschka, in this order, respectively had significantly (P < 0.05) lower antioxidant capacity compared to other genotypes (Figure 6(a)). Fresh-no skin (FNS) potatoes had significantly (P < 0.05) lesser antioxidant capacity compared to fresh-with skin (FWS) potatoes and ranged between 27 to 92 TE∙g−1 DW (Figure 6(a)).
Maximum loses were recorded in POROIPG22-1 and Russet Burbank (~35%) and the least reductions were recorded in AR2009-10, Adirondack Blue and Adirondack Red (~16%). On average over all genotypes, total antioxidant capacity of FWS samples was 80 TE∙g−1 DW. About 21% antioxidant capacity was lost due to peeling. Initial fresh (IF)
(a)
[image:16.595.220.530.76.436.2](b)
Figure 6. Total antioxidant capacity of seven uncooked potato genotypes (a) and effect of cook-ing (b) on total antioxidant capacity (average over all genotypes). The bars represent mean values
of four replicates (±SE). Bars with different letters within a group are significantly different at P <
0.05. The boxed values indicate average over all genotypes. IF = Initial fresh; FWS = Fresh, with skin; FNS = Fresh, no skin; BF = Blanching-freezing; BFM = Blanching-freezing microwave; BFF = Blanching-frying-freezing; BFFO = Blanching-frying-freezing oven; BFFF = Blanching- frying-freezing fryer.
3.9. Effect of Processing/Cooking/Reconstitution on Total Antioxidant Capacity
On average over all genotypes, blanching alone (BF samples) reduced 58% antioxidant capacity compared to FWS samples (45% compared to FNS samples).Further cooking/ reconstitutions (BFF, BFFO and BFFF), also similarly and significantly (P < 0.05) re-duced total antioxidant capacity (~12%) except for BFM processing (Figure 6(b)).
3.10. Effect of Processing/Cooking/Reconstitution on Antioxidant Capacity of Individual Genotype
Blanching greatly reduced total antioxidant capacity in all genotypes with some dif-ferences among them. Further cooking/reconstitution did not cause further reductions in antioxidant capacity except for Adirondack Red, Adirondack Blue and AR2009-10 (Table 2(b)). BF samples of these three genotypes had about 13% more antioxidant ca-pacity compared to BFF, BFFO and BFFF samples. However, as contrary to the total phenolics, genotypes with greater initial levels(pigmented genotypes) and genotypes with lesser initial levels (Anuschka and Russet Burbank); similarly lost about 65% of the total antioxidant capacity to blanching and further cooking/reconstitution (Table 2(b)).
3.11. Bioactive Compounds Loses Due to Processing and Relationships between Total Phenolics, Anthocyanins, Total Antioxidant Capacity and Total Ascorbates
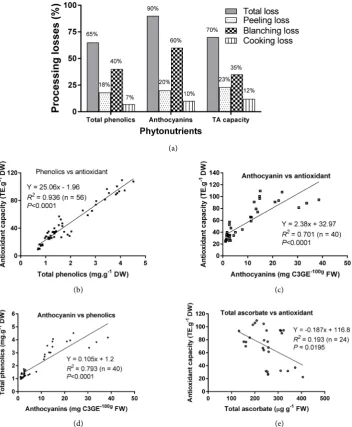
On average over all genotypes, ~65% of the total phenolics were lost during potato processing. Of which, ~18% was lost to peeling, 40% to blanching and ~7% was lost during further cooking/reconstitution (BFM, BFF, BFFW, BFFF). About 90% of the anthocyanins were lost during potato processing. Of which about 20% was lost to peel-ing, ~60% to blanching and ~10% was lost during further cooking/reconstitution. While about 70% of the total antioxidant capacity were lost during potato processing. Of which, about ~23% was lost to peeling, ~35% to blanching and ~12% was lost dur-ing further cookdur-ing/reconstitution (Figure 7(a)).
The results showed that there were highly significant (P<0.001) positive correlations between total phenolics and total antioxidant capacity (Figure 7(b)); anothocyanins and total antioxidant capacity (Figure 7(c)); and anthocyanins and total phenolics (Figure 7(d)). However, there were significant (P < 0.05) negative correlation between total ascorbate and total antioxidant capacity (Figure 7(e)).
4. Discussion
Total phenolics, anthocyanins and antioxidant capacity in fresh samples of five col-our/pigmented and two unpigmented potato genotypes/selections were quantified and how commercial processing/reconstitution processes affect them were investigated in this study. Ascorbate profiles of the seven genotypes were also investigated using fresh tuber/tissue only (as available literatures show that there are little or no ascorbates in commercially processed potatoes). The results showed that the ascorbate profiles of the genotypes were not associated with a particular flesh colour/pigment. However, pig-mented potatoes in general (with significant variations between them) contained higher levels of total pehnolics and anthocyanins compared to unpigmented genotypes. The pigmented potatoes also had higher antioxidant capacity in scavenging ORAC (oxygen radical performance capacity) radicals. The commercial processing/reconstitution processes, peeling and blanching in particular, appeared to have significant effects on phenolics, anthocyanins and antioxidant capacity as their levels were largely reduced in commercially processed/reconstituted products in all genotypes.
4.1. Potato Genotype Differences in Bioactive Compounds
(a)
(b) (c)
[image:18.595.199.552.71.499.2](d) (e)
Figure 7. Losses of bioactive compounds from potatoes during possessing/cooking (a); and rela-tionships between total phenolic contents and total antioxidant capacity (b); anthocyanin con-tents and total antioxidant capacity (c); total anthocyanins and phenolic concon-tents (d); total as-corbate content and total antioxidant capacity (e) of the seven potato genotypes. TA capacity = Total antioxidant capacity.
High antioxidant capacity in pigmented potatoes in our study can be explained by the presence of higher amounts of total phenolics and anothocyanins in them com-pared to unpigmented potato genotypes. Figures 6(b)-(d) also justify these even sub-stantial altercations in their contents after cooking. Faller and Fialho [28] also reported positive correlations between polyphenols and antioxidant capacity in raw and cooked potatoes, carrots, onions, broccoli, and white cabbage. Lachman et al. [7] showed that total anthocyanins and individual anthocyanid corresponded to the antioxidant activity of various red and purple fleshed potatoes. Brown et al. [26] reported 330% greater an-tioxidant activity in a red fleshed breeding line of potatoes than the white fleshed potato breeding lines and varieties, as has been seen in this study. Brown et al. [26] also re-ported that vitamin C may also account for up to 13% of the total antioxidant capacity of potato. Mohdaly et al. [29] also reported high antioxidant capacity as strongly related to the presence of numerous phenolic and flavonoid compounds in various vegetables and fruits. Although we did not analyze carotenoids, coloured potatoes are rich in ca-rotenoids and are also correlated with antioxidant activity in potato tubers [26].
Under storage conditions, bioactive components of vegetables and fruits generally reduce over time. However, during the 9 - 10 weeks in storage (at 13˚C - 9˚C and 90% RH), potato tubers seemed did not lose phenolics or antioxidant capacity significantly. The lesser amounts of phenolics in initial fresh (IF) samples (compared to FWS) were due to the combination of “with” and “without skin” samples in IF samples explained in the methodology section.
4.2. Bioactive Compounds in Coloured Potatoes vs Berries
Nevertheless, weighing against other researches those used similar quantification methods as performed in the present study for different kind of berries [30] [31], it was found that coloured potatoes had levels of phenoliocs, anthocyanins and antioxidant capacity that reached levels similar to those observed in strawberries and raspberries; and reached about 25% to those observed in blueberries. Ascorbate levels in coloured potatoes were similar to unpigmented genotypes, also similar to those observed in strawberries and raspberries; and about three times more than blueberries. Unlike ber-ries, potatoes are served as part of a main course meal and, therefore, incorporation of pigmented flesh potatoes in meal can provide additional natural sources of potent an-tioxidants in the diet. Moreover, potatoes cost less to produce and result in higher yields that can also be economical source of raw material for extraction of antho-cyanins. Along with carotenoids, anthocyanins are hydrophilic pigments responsible for the red, purple, and blue hues in most flowers, grasses, fruits, vegetables, and grains [5]. The association of coloring properties and potential health benefits in anthocyanins [32] makes them very attractive molecules for the food industry. Taken together, our results provide further evidence for the enhanced health beneficial components in pig-mented potatoes. Mulinacci et al. [17] suggested that a portion (about 200 g raw) of these coulourful potato genotypes could consistently contribute to the daily intake of these functional compounds.
4.3. Ascorbate Contents in Coloured Potatoes
had the highest amount of ascorbate, while POROIPG22-1 had the lowest and “Russet Burbank” were somewhere in the middle with other coloured potatoes. However, AR2009-10 was recorded with the highest oxidized ascorbate contents and highest oxi-dized/reduced ascorbate ratio, followed by Congo (Figure 1(a) and Figure 1(b)) indi-cating less monodehy droascorbate reductase (MDHAR) and dehydroascorbate reduc-tase (DHAR) activities in these genotypes, because these two enzymes are responsible for reducing the oxidated ascorbate to the reduced stage in order for its antioxidant functions..
Since total ascorbate is the sum of reduced ascorbate and oxidized ascorbate, the ascorbate pool in plants is maintained about 90% in reduced form with the remaining 10% present in the oxidized form [33]. The key aspects governing the ascorbate pool in plants are its biosynthesis, redox turnover, and degradation rates. The turnover occurs through a regenerative process. Reduced ascorbate is oxidized (by ascorbate oxidase, ascorbate peroxidase, etc. enzymes) to monodehydroascorbic acid (MDHA). MDHA is converted to reduced ascorbate through the activities of MDHAR ordispropotionates non-enzymatically to oxidized ascorbate. Oxidized ascorbate can be re-reduced back to reduced ascorbate directly through DHAR or undergoes irreversible hydrolysis to 2,3- diketogulonic acid which are toxic secondary metabolites such as oxalate and tartarate [34] [35]. Therefore, MDHAR and DHAR are important enzymes contributing main-taining an appropriate level of reduced ascorbate concentration in plant cells which seemed low in genotypes AR2009-10 and Congo compared to other genotypes.
However, the overall ascorbate pool in potato tubers in our study was found as 76% in reduced from and 24% in oxidized form (instead of 90:10). This could be due to the reduced MDHAR and DHAR activity in tuber tissues (sink) as compared to the photo-synthetically active shoot/leaf (source) tissues. MDHAR and DHAR enzyme activity has been reported to be associated with light intensity. One of the environmental signals that activate tuberization in potatoes is light. Delivery of light from the light-receiving organ, the leaf, to an underground organ growing in the dark, the stolon, leads to the formation of potato tuber [27] [36]. However, the underground tubers are exposed to darkness while the photosynthetically active leaf tissues are exposed to the light. This reason, in addition to the reduced DHAR activity in the dark, justify for a reduced DHAR activity in tuber tissues than shoot, and thus reduced amounts of reduced ascorbate in tubers compared to the shoot in this study.
4.4. Loses of Bioactive Compounds during Potato Processing
Significant amounts of bioactive compounds in potato peels also have been reported by others. Ji et al. [37] reported purple and red pigmented potato clones contained higher levels of phenolics and anthocyanins, and had higher antioxidant capacity in both peel and tuber than observed in yellow or unpigmented clones. Samarin et al. [38] also reported significant amounts of phenolic compounds in potato peels, adequate for commercial extraction. Lewis et al. [15] found that purple- and red-skinned tubers contained twice the concentration of phenolic acids as white-skinned tubers. Genotype differences in peeling losses of bioactive compounds were prominent in our study with maximum losses from POROIPG22-1 (phenolics 28%, anthocyanins 25% and antioxi-dant capacity 32%; Table 1). This was due to the smaller tuber size (98 g/tuber) of this genotype (Table 1). Though all tubers were peeled with a standard kitchen peeler at a similar depth (1 - 2 mm), as the tubers were of different size, smaller tubers had more tissue removed with the peel compared to the rest of the tuber tissues.
In general, cooking leads to reductions in bioactive compounds and antioxidant ca-pacity for most vegetables (however varies with the methods of cooking) as has been seen in our study. Other studies also have shown that different cooking treatments re-duce various phenolic compounds in potatoes [19] [20]. Lachman et al. [39] reported that cooking treatments (boiling, baking and microwaving) reduced ascorbic and chlo-rogenic acid contents, total glycoalkaloids, a-chaconine and a-solanine with the excep-tion of total anthocyanins.
Significant loss of total phenolics, anthocyanins and antioxidant capacity during blanching of the current study can be attributed to peeling, the browning phenomenon during cut, leaching, levels of temperature and duration and pH during blanching, se-lective decomposition, and/or inter-conversion of the compounds [6] [13]. Peeling and slicing of tuber cause browning and expose greater pulp surface to hot water [17] which may facilitate greater leaching of bioactive compounds in water bath during blanching. Perla et al. [19] reported selective leaching of polyphenols from tubers is one of the factors responsible for the decline of polyphenols, flavonoids and flavonols during boiling. They determined that on average, boiling, microwaving and baking reduced total phenolics to 54%, 46.5% and 46%, respectively. Chlorogenic acid, one of the main polyphenols in potatoes, was completely destroyed during baking at 212˚C in an oven for 45 min, reduced to 35% and 55% respectively after boiling for 30 min in water, or microwaving at 218˚C for 30 min and was not detected in commercially processed po-tato products [20]. Besides altering quantities of polyphenols, food processing that in-volves heating has been shown to alter flavonols and these alterations directly affected the antioxidant status of plant tissues [16]. Stability of anthocyanins and phenolics are strongly dependant on the pH value in water media and also the temperature [17]. This and hydrophyllic property of anthocyanin [5] probably justify the maximum loses of anthocyanins during blanching in our study.
the commercial processing conditions. In some studies, the tubers were not peeled; also either the levels of cooking temperature was low, the cooking duration was less com-pared to commercial processing, or there was a combination of these two. Indeed, physical and/or chemical changes during processing may differ depending upon the methods used to process potatoes.
5. Conclusion
Taken together, these findings suggest that the pigmented potatoes had greater amounts of phenolics, anthocyanins and antioxidant capacity compared to unpig-mented genotypes. Total ascorbate contents were not associated to tuber flesh colour. However, the bioactive compounds and antioxidant capacity were significantly reduced by peeling and significantly more blanching, without prominent differences among genotypes. This study suggests that blanching treatments would be one of the most challenging areas to focus on to minimize the adverse effects of processing and to ob-tain processed/reconstituted products that keep more of their original characteristics including novel bioactive compounds. Peeling process also needs some attention. This work is the first of its kind that focused on the cultivars that the industry recommend-ed, and the processing methods used at the industrial settings. The results are impotent to guide the potato processing industry for their product development and revision of their processing methods.
Acknowledgements
The research was supported by New Brunswick Enabling Agricultural Research and Innovation (EARI) of Growing Forward Program, McCain Foods Ltd., Canada and Agriculture and Agri-Food Canada (AAFC). The authors also would like to thank Mi-chele Elliot for technical assistance.
References
[1] Dehghan, M., Mente, A., Teo, K.K., Gao, P., Sleight, P., Dagenais, G., Avezum, A.,
Probstfield, J.L., Dans, T. and Yusuf, S. (2012) Relationship between Healthy Diet and Risk of Cardiovascular Disease among Patients on Drug Therapies for Secondary Prevention: A
Prospective Cohort Study of 31546 High-Risk Individuals from 40 Countries. Circulation,
126, 2705-2712. https://doi.org/10.1161/CIRCULATIONAHA.112.103234
[2] Sapienza, C. and Issa, J.-P. (2016) Diet Nutrition and Cancer Epigenetics. Annual Review of
Nutrition, 36, 665-681. https://doi.org/10.1146/annurev-nutr-121415-112634
[3] FAOSTAT (2012) FAO Statistics Division. http://faostat.fao.org/beta/en/#home
[4] Helgi Library (2013).
http://www.helgilibrary.com/indicators/potato-consumption-per-capita/world
[5] Andre, C.M., Ghislain, M., Bertin, P., Oufir, M., Herrera, M.D.R., Hoffmann, L., Hausman,
J., Larondelle, Y. and Evers, D. (2007) Andean Potato Cultivars (Solanum tuberosum L.) as
a Source of Antioxidant and Mineral Micronutrients. Journal of Agricultural and Food
Chemistry, 55, 366-378. https://doi.org/10.1021/jf062740i
[6] Tian, J., Chen, J., Ye, X. and Chen, S. (2016) Health Benefits of the Potato Affected by
Do-mestic Cooking: A Review. Food Chemistry, 202, 165-175.
[7] Lachman, J., Hamouz, K., Sulc, M., Orsak, M., Pivec, V., Hejtmankova, A., Dvorak, P. and Jaroslav, C. (2009) Cultivar Differences of Total Anthocyanins and Anthocyanidins in Red
and Purple-Fleshed Potatoes and Their Relation to Antioxidant Activity. Food Chemistry,
114, 836-843. https://doi.org/10.1016/j.foodchem.2008.10.029
[8] Navarre, D.A., Shakya, R., Holden, J. and Kumar, S. (2010) The Effect of Different Cooking
Methods on Phenolics and Vitamin C in Developmentally Young Potato Tubers. American
Journal of Potato Research, 87, 350-359. https://doi.org/10.1007/s12230-010-9141-8
[9] Navarre, D.A., Pillai, S.S., Shakya, R. and Holden, M.J. (2011) HPLC Profiling of Phenolics
in Diverse Potato Genotypes. Food Chemistry, 127, 34-41.
https://doi.org/10.1016/j.foodchem.2010.12.080
[10] Pillai S.S., Navarre, D.A. and Bamberg, J. (2013) Analysis of Phenolics, Anthocyanins and
Carotenoids in Tubers from Solanum tuberosum Group Phureja, Stenotomum and
Andi-gena. American Journal of Potato Research, 90, 440-450.
https://doi.org/10.1007/s12230-013-9318-z
[11] Ducreux, L., Morris, W.L., Hedley, P.E., Shepherd, T., Davies, H.V., Millam, S. and Taylor,
M.A. (2005) Metabolic Engineering of High Carotenoid Potato Tubers Containing
En-hanced Levels of β-Carotene and Lutein. Journal of Experimental Botany, 56, 81-89.
[12] Lukaszewicz, M., Matysiak-Kata, I., Skala, J., Fecka, I., Cisowski, W. and Szopa, J. (2004)
Antioxidant Capacity Manipulation in Transgenic Potato Tuber by Changes in Phenolic
Compounds Content. Journal of Agricultural and Food Chemistry, 52, 1526-1533.
https://doi.org/10.1021/jf034482k
[13] Akyol, H., Riciputi, Y., Capanoglu, E., Caboni, M.F. and Varardo, V. (2016) Phenolic
Compounds in the Potato and Its Byproducts: An Overview. International Journal of
Mo-lecular Sciences, 17, 835. https://doi.org/10.3390/ijms17060835
[14] Brown, C.R., Wrolstad, R., Durst, R., Yang, C.-P. and Clevidence, B. (2003) Breeding
Stu-dies in Potatoes Containing High Concentrations of Anthocyanins. American Journal of
Potato Research, 80, 241-250. https://doi.org/10.1007/BF02855360
[15] Lewis, C.E., Walkel, J.R.L., Lancaster, J.E. and Sutton, K.H. (1998) Determination of
An-thocyanins, Flavonoids and Phenolic Acids in Potatoes. I: Coloured Cultivars of Solanum
tuberosum L. Journal of the Science of Food and Agriculture, 77, 45-57.
https://doi.org/10.1002/(SICI)1097-0010(199805)77:1<45::AID-JSFA1>3.0.CO;2-S
[16] Makris, D.P. and Rossiter, J.T. (2001) Domestic Processing of Onion Bulbs (Allium cepa)
and Asparagus Spears (Asparagus officinalis): Effect on Flavonol Content and Antioxidant
Status. Journal of Agricultural and Food Chemistry, 49, 3216-3222.
https://doi.org/10.1021/jf001497z
[17] Mulinacci, N., Ieri, F., Giaccherini, C., Innocenti, M., Andrenelli, L., Canova, G., Saracchi,
M. and Casiraghi, M.C. (2008) Effect of Cooking on the Anthocyanins, Phenolic Acids,
Glycoalkaloids, and Resistant Starch Content in Two Pigmented Cultivars of Solanum
tu-berosum L. Journal of Agricultural and Food Chemistry, 56, 11830-11837.
https://doi.org/10.1021/jf801521e
[18] Brown, C.R. (2005) Antioxidants in Potato. American Journal of Potato Research, 82, 163-
172. https://doi.org/10.1007/BF02853654
[19] Perla, V., Holm, D.G. and Jayanty, S.S. (2012) Effects of Cooking Methods on Polyphenols,
Pigments and Antioxidant Activity in Potato Tubers. Food Science and Technology, 45,
161-171. https://doi.org/10.1016/j.lwt.2011.08.005
[20] Dao, L. and Friedman, M. (1992) Chlorogenic Acid Content of Fresh and Processed
Pota-toes Determined by Ultraviolet Spectrophotometry. Journal of Agricultural and Food
Che-mistry, 40, 2152-2156. https://doi.org/10.1021/jf00023a022
Relationships between Light and Respiration in the Control of Ascorbic Acid Synthesis and
Accumulation of in Arabidopsis Thaliana Leaves. Journal of Experimental Botany, 57,
1621-1631. https://doi.org/10.1093/jxb/erl005
[22] Singleton, V.L. and Rossi Jr., J.A. (1965) Colorimetry of Total Phenolics with
Phospho-molybdic-Phosphotungstic Acid Reagents. American Journal of Enology and Viticulture,
16, 144-158.
[23] Folin, O. and Coicalteu, V. (1927) On Tyrosine and Trypophane Determinations in
Pro-teins. The Journal of Biological Chemistry, 73, 627-650.
[24] Prior, R.L., Hoang, H., Gu, L., Bacchiocca, M., Howard, L., Hampsch-Woodhill, M., Haung,
D., Ou, B. and Jacob, R. (2003) Assays for Hydrophilic and Lipophilic Antioxidant Capacity (Oxygen Radical Absorbance Capacity (ORACFL) of Plasma and Other Biological and
Food Samples. Journal of Agricultural and Food Chemistry, 51, 3273-3279.
https://doi.org/10.1021/jf0262256
[25] Lee, J., Durst, R.W. and Wrolstad, R.E. (2005) Determination of Total Monomeric
Antho-cyanin Pigment Content of Fruit Juices, Beverages, Natural Colorants, and Wines by the pH
Differential Method: Collaborative Study. Journal of AOAC International, 88, 1269-1278.
[26] Brown, C.R., Culley, D., Yang, C.-P., Durst, R. and Wrolstad, R. (2005) Variation of
An-thocyanin and Carotenoid Contents and Associated Antioxidant Values in Potato Breeding
Lines. Journal of the American Society for Horticultural Science, 130, 174-180.
[27] Chun, J., Lee, W., Han, M., Lee, J., Yi, Y., Goo, Y., Lee, S., Bae, S., Cho, K. and Chung, C.
(2007) Molecular and Biochemical Characterizations of Dehydroascorbate Reductase from
Sesame (Sesamum indicum L.) Hairy Root Cultures. Journal of Agricultural and Food
Chemistry, 55, 6067-6073. https://doi.org/10.1021/jf070946t
[28] Faller, A.L.K. and Fialho, E. (2009) The Antioxidant Capacity and Polyphenol Content of
Organic and Conventional Retail Vegetables after Domestic Cooking. Food Research
In-ternational, 42, 210-215. https://doi.org/10.1016/j.foodres.2008.10.009
[29] Mohdaly, A.A.A., Sarhan, M.A., Smetanska, I. and Mahmoud, A. (2010) Antioxidant
Prop-erties of Various Solvent Extracts of Potato Peel, Sugar Beet Pulp and Sesame Cake. Journal
of the Science of Food and Agriculture, 90, 218-226. https://doi.org/10.1002/jsfa.3796
[30] Howard, L.R., Clark, J.R. and Brownmiller, C. (2003) Antioxidant Capacity and Phenolic
Content in Blueberries as Affected by Genotype and Growing Season. Journal of the Science
of Food and Agriculture, 83, 1238-1247. https://doi.org/10.1002/jsfa.1532
[31] Pantelidis, G.E., Vasilakakis, M., Manganaris, G.A. and Diamantidis, G. (2007) Antioxidant
Capacity, Phenol, Anthocyanin and Ascorbic Acid Contents in Raspberries, Blackberries,
Gooseberries and Cornelian Cherries. Food Chemistry, 102, 777-783.
https://doi.org/10.1016/j.foodchem.2006.06.021
[32] Prior, R. and Wu, X. (2006) Anthocyanins: Structural Characteristics That Result in Unique
Metabolic Patterns and Biological Activities. Free Radical Research, 40, 1014-1028.
https://doi.org/10.1080/10715760600758522
[33] Noctor, G. and Foyer, C.H. (1998) Ascorbate and Glutathione: Keeping Active Oxygen
un-der Control. Annual Review of Plant Physiology and Plant Molecular Biology, 49, 249-279.
https://doi.org/10.1146/annurev.arplant.49.1.249
[34] Chen, Z. and Gallie, D.R. (2006) Dehydroascorbate Reductase Affects Leaf Growth,
Devel-opment and Function. Plant Physiology, 142, 775-787.
https://doi.org/10.1104/pp.106.085506
[35] Jiang, Y., Huang, C., Wen, L. and Lin, C. (2008) Dehydroascorbate Reductasec DNA from
Sweet Potato (Ipomoea batatas (L.) Lam): Expression, Enzyme Properties, and Kinetic
Studies. Journal of Agricultural and Food Chemistry, 56, 3623-3627.
[36] Ali, M.B., Hahn, E.J. and Paek, K.Y. (2005) Effects of Temperature on Oxidative Stress
De-fense Systems, Lipid Peroxidation and Lipoxygenase Activity in Phalaenopsis. Plant
Physi-ology and Biochemistry, 43, 213-223. https://doi.org/10.1016/j.plaphy.2005.01.007
[37] Ji, X., Rivers, L., Zielinski, Z., Xu, M., MacDougall, E., Stephen, J., Zhang, S., Wang, Y.,
Chapman, R.G., Keddy, P., Robertson, G.S., Kirby, C.W., Embleton, J., Worrall, K., Mur-phy, A., Koeyer, D.D., Tai, H., Yu, L., Charter, E. and Zhang, J. (2012) Quantitative
Analy-sis of Phenolic Components and Glycoalkaloids from 20 Potato Clones and in Vitro
Evalu-ation of Antioxidant, Cholesterol Uptake, and Neuroprotective Activities. Food Chemistry,
133, 1177-1187. https://doi.org/10.1016/j.foodchem.2011.08.065
[38] Samarin, A.M., Poorazarang, H., Hematyar, N. and Elhamirad, A. (2012) Phenolics in
Po-tato Peels: Extraction and Utilization as Natural Antioxidants. World Applied Sciences
Journal, 18, 191-195.
[39] Lachman, J., Hamouz, K., Musilova, J., Hejtmankova, K., Kotikova, Z., Pazderu, K.,
Dom-karova, J., Pivec, V. and Cimr, J. (2013) Effect of Peeling and Three Cooking Methods on
the Content of Selected Phytochemicals in Potato Tubers with Various Color of Flesh. Food
Chemistry, 138, 1189-1197. https://doi.org/10.1016/j.foodchem.2012.11.114
Submit or recommend next manuscript to SCIRP and we will provide best service for you:
Accepting pre-submission inquiries through Email, Facebook, LinkedIn, Twitter, etc. A wide selection of journals (inclusive of 9 subjects, more than 200 journals)
Providing 24-hour high-quality service User-friendly online submission system Fair and swift peer-review system
Efficient typesetting and proofreading procedure
Display of the result of downloads and visits, as well as the number of cited articles Maximum dissemination of your research work
Submit your manuscript at: http://papersubmission.scirp.org/