ISSN Online: 2151-4771 ISSN Print: 2151-4755
Measuring Student Knowledge, Ignorance and
Risk Aversion with Objective Examination
Questions
Alan Dugdale
1,21Department of Paediatrics, School of Medicine, University of Queensland, St Lucia, Australia 2Department of Paediatrics, School of Medicine, Griffith University, Gold Coast, Australia
Abstract
This paper applies deductive logic to the structure and outcomes of objective ques-tions. When all terms are clearly defined and deductive logic is correctly used, then the results must be true, even if they are surprising or counter-intuitive. The defined premises are 1) student’s true knowledge, 2) student’s false knowledge, 3) student’s admitted ignorance and 4) student’s level of risk aversion. Definitions for 5) correct answer, 6) wrong answer, and 7) abstain are also needed. Some logical processes are numerical and involve simple equations. The main outcomes include: i) the standard scoring of correct answers, the number of wrong answers and the number of abstain can result from varying levels of true knowledge, false knowledge and admitted ig-norance; ii) the level of risk aversion is measured by the proportion of answers where the student abstains from answering. High risk aversion lowers standard score, but this effect can be easily corrected.
Keywords
Objective Examination Questions, Knowledge, Ignorance, Risk Aversion, Marking Scheme
1. Introduction
Objective questions have been used for more than seventy years, and scores form a large part of student assessment. These scores correlate well with scores from other as-sessments, so presumably give a valid measure of student ability. They have the advan-tage of administrative simplicity, with banks of verified questions for use/re-use, and they can test a wide range of knowledge in a single exam. The marking can be auto-How to cite this paper: Dugdale, A. (2016).
Measuring Student Knowledge, Ignorance and Risk Aversion with Objective Examina-tion QuesExamina-tions. Creative EducaExamina-tion, 7, 2352- 2361.
http://dx.doi.org/10.4236/ce.2016.715227
Received: April 22, 2016 Accepted: September 26, 2016 Published: September 29, 2016
Copyright © 2016 by author and Scientific Research Publishing Inc. This work is licensed under the Creative Commons Attribution International License (CC BY 4.0).
http://creativecommons.org/licenses/by/4.0/
mated. Most pass/fail decisions are based on the number of correct answers, but we usually ignore the wrong answers and the reasons for them. We assume that correct answers arise from student knowledge or through random guessing and there are vari-ous mathematical methods to correct the scores to avoid giving rewards to guessing (Tavakol & Dennick, 2011). Error is seldom penalized. Mathematical analyses based on these principles (Tavakol & Dennick, 2011) help select effective questions and give sta-tistical validity to the scoring. However, most of these analyses have defects.
1) Most analyses implicitly assume that we are testing knowledge, that is, the first cognitive level in taxonomy of both Bloom (Bloom, 1972) and Anderson & Krathwohl (2000). At this level, having no penalty for error is logically correct. Credit should be given for knowledge.
2) However, in assessment for future professional careers, we should be testing the application of that knowledge, which is a higher cognitive taxonomy. This can be done by changing the stem of objective questions from a simple statement to a clinical scena-rio, so the student needs both relevant correct knowledge and the ability to apply it. Under these conditions, admitted ignorance (DK don’t know) is not dangerous, but misinformation (FK false knowledge) or the wrong use of true knowledge (TK) can lead to clinical error and patient harm. It is part of student training, and therefore part of assessment, that error, and the risk of error, should be recognized and minimized. This has been done by penalizing error, but the benefits of this strategy are uncertain (Bur-ton, 2004).
3) Standard objective questions give the student three alternative responses. These are: i) the statement is TRUE, ii) the statement is FALSE, iii) I DO NOT KNOW whether it is true or false. These responses assume the student has complete knowledge or complete ignorance. But this does not explain wrong answers, so we recognize par-tial knowledge, false knowledge and guessing. Most mathematical models used to ana-lyze outputs from objective questions assume that wrong answers come from random guessing. Analysis of published scores based on random guessing alone e.g. (Van der Vleutin et al., 2004) gives very low scores for correct knowledge. There must be other factors.
4) Partial knowledge or uncertainty exists (Ebel, 2003; Burton, 2002). If our certainty of the truth of facts/data/knowledge is near 100%, then we are prepared to use it to make serious decisions. Other items of knowledge are less certain, some are merely hunches with low level of certainty. We might use that knowledge in casual conversa-tion, but not if major issues were at stake. The willingness of individuals to use uncer-tain facts varies and is known as risk aversion. This is well studied, particularly in fi-nancial planning.
with new “facts”, he/she usually retains this as true knowledge (Burton, 2002). Repeated exposure to those facts may alter memories (Loftus & Hoffman, 1989). It needs effort to make a person change his/her belief about a fact from truth to falsity (Roediger III & Marsh, 2005). Functional MRI scanning has shown that different areas in the brain are involved in accepting truth and changing from truth to falsity (Fellows & Farah, 2003). Using objective questions as teaching tools, Roediger (2005) has shown that exposure to material reinforces true knowledge, but with repeated viewing some of the distractors may later be considered to be true.
Current models used to explain the results of objective assessments have produced valuable data, but there remains confusion in dealing with uncertain knowledge and misinformation. I therefore revisit the basic structure of objective questions to show that all formats used are modifications of one basic structure. I shall then show how we can quantify uncertain knowledge and risk taking strategies but not the level of misin-formation or the actual level of true knowledge, false knowledge.
No analysis of the logical framework of objective questions has been found in the li-terature. In this paper I shall define the relevant initial assumptions, and formal deduc-tive logic to reach conclusions. Deducdeduc-tive reasoning links premises with conclusions through logic. If all premises are true, the terms are clear, and the rules of deductive logic are followed, then the conclusions reached are necessarily true.
2. The Basic Structure of Objective Questions
All objective questions have the same basic structure. There is a STATEMENT followed by two or more POSSIBLE RESPONSES. The candidate must choose the most appro-priate response. There is usually a CONDITION which may be implicit. Most condi-tions limit the student’s responses and reduce the information gained (Dugdale, 2013; Dugdale, 2015). The examples below illustrate some alternative formats of the basic ob-jective question.
Examples
*A An apple is a fruit [ ] True
Condition: If no response marked this indicates False or Don’t Know *B An apple is a fruit [ ] True [ ] False [ ] Don’t Know
Condition: One response must be marked
Each of these is a complete and valid objective question. The Condition is usually implied but is stated here for completeness. The student must give one response to each statement. All complex types of objective questions are variations and combinations of basic objective questions.
MTFQ, each line with three options, Correct/Wrong/Abstain (C/W/A) These terms are defined formally below. In a multi-line MTFQ each line is logically and independent question. When a student sits an objective C/W/A examination with 100 expected res-ponses the results will appear (for example) as
Correct 56 Wrong 24 Don’t Know 20
We know that the Correct score contains true knowledge and some results from guessing; the Wrong score may arise from guessing or other causes. However, the aim of the assessment is to find the student’s underlying levels of knowledge and ignorance. To extract the student’s levels of knowledge and ignorance from the C/W/A score we must define the terms used and then employ some simple logic. The definitions below are necessary for understanding.
3. Premises and Definitions
True Knowledge [TK]: facts/opinions/deductions that the student holds to be true and experts (and examiners) also consider true. The statement “most humans have one head is TRUE” is an item of true knowledge. The statement “most humans have three legs is FALSE” is also true knowledge.
False Knowledge (misinformation) [FK]: facts/opinions/deductions that student holds to be true but experts (and examiners) consider false. This is the opposite of true knowledge.
Ignorance [DK]: items that subject admits he/she does not know.
Risk aversion score [RA]: a measure of doubt about the truth or error of less-than- certain knowledge. If the certainty of knowledge is put on a scale from 99% (almost complete certainty) down to 1% (minimal certainty), then a person with a risk aversion of say 40%, will not use those facts which of which he/she is less than 40% certain. This is a subjective assessment, and is very difficult to measure objectively. I have there used a surrogate definition. This is.
Risk aversion score [RA] = the % of items of true knowledge and false knowledge that a person will class as ignorance under prevailing conditions. When he/she uses the item of knowledge he/she will mark the question as true if he/she thinks it is likely to be true, or false if he/she thinks it likely to be false.
A person with a risk aversion [RA] score of 40% will consider 40% of his items of knowledge to be too uncertain to use under examination conditions and will therefore Abstain. A student with a RA of 100% will abstain from all items, with RA of 0% he/she will “have a go” at all items. The formal definition is.
Risk aversion is the proportion of those items which the student considers to be TRUE or FALSE which the student will classify as ABSTAIN under examination condi-tions.
litera-ture; intuitively it is less likely than when the student has uncertain knowledge. I have therefore made the risk aversion for ignorance [DK] the same as the risk aversion for knowledge. This assumption is tested later.
Other practical definitions of items in the score sheet of an objective assessment are. Correct answer [C]: if the student and examiner agree that the statement is true, or if they agree that the statement is false then the answer is correct.
Wrong answer [W]: where the student and examiner disagree on the truth/falsity of the statement.
Abstain [A]: where the student did not give an answer: the student did not know the answer or was too uncertain to risk giving one.
4. Logic
When these definitions are considered logically, several results follow.
1) In an objective question C/W/A test, a student will abstain if his level of uncer-tainty is below his/her critical level. Using the definition above, the student will abstain for RA% of his/her knowledge. He/she will therefore abstain for RA% of true know-ledge items, RA% of false knowknow-ledge items, and RA% of the Don’t Know items. This is shown in Equation (1)
A=TK * RA+FK * RA+DK * RA (1)
2) The correct score C has two components i) the total number of items of true knowledge minus those in the Abstain score. This is TK*(1 − RA) and ii) half the Don’t Know items excluded from the Abstain score (assuming that the student will make random guesses, half correct and half wrong). This is DK*(1 − RA)/2. The total correct score is shown in Equation (2)
(
)
(
)
C=TK∗ −1 RA +DK∗ −1 RA 2 (2)
3) Similarly, the wrong score W will be
(
)
(
)
W=FK∗ −1 RA +DK∗ −1 RA 2 (3)
5. Deductions from Basic Equations
Deductive reasoning links premises with conclusions. The following conclusions follow from the three logical equations
1) Conclusion #1: The level of risk aversion can be calculated from the score of a C/W/A objective test
It follows from Equation (1)
(
)
RA=A C+W+A (4)
In words, the risk aversion is given by the proportion of the total answers where the student abstains. Risk Aversion is therefore independent of levels of true and false knowledge. Under these conditions the level of risk aversion is always.
Risk Aversion [RA] = Number of Abstain responses/Total responses.
will be shown to affect the scores of students who have the same levels of actual knowl-edge.
2) Conclusion #2: For any level of student knowledge (True, False, Don’t Know) and risk aversion there is a unique C/W/A score in an objective test.
This C/W/A score in Table 1 must follow from the figures in Table 2. This calcula-tion uses no negative marking for error.
3) Conclusion #3: For any C/W/A score there is no unique set of levels for student knowledge (True, False, Don’t Know).
However, if we are given the C/W/A score we cannot get back to a unique TK/FK/DK score. We get the correct value of the risk aversion but we get many TK/FK/DK scores which all give the same test score.
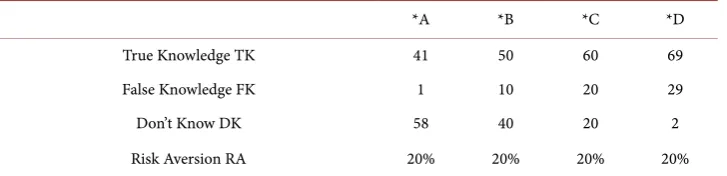
For a C/W/A score of Correct = 56 Wrong = 24 Abstain = 20 (Table 1) all the sets of values below (and other intermediate values) are possible.
[image:6.595.194.551.391.462.2]The results in Table 3 show that a C/W/A score does not give an accurate indication of a student’s knowledge, but can result from many differing levels of true knowledge, false knowledge and ignorance. The students *A to *D all have the same score on a C/W/A objective test, but their patterns of knowledge are very different. Remedial teaching (if indicated by the overall mark) should be different for students with differ-ing levels of true and false knowledge.
Table 1. Using Equations (1)-(3) his/her score on a C/W/A objective assessment would be.
C/W/A score Score %
Correct C 56
Wrong W 24
[image:6.595.192.554.496.584.2]Abstain A 20
Table 2. As an example, take a student whose actual knowledge levels in 100 test items were.
Measure Score %
True knowledge TK 60
False knowledge FK 20
Ignorance (Don’t know) DK 20
Risk aversion RA 20
Table 3. Some possible levels of TK, FK and DK for C/W/A score in Table 1.
*A *B *C *D
True Knowledge TK 41 50 60 69
False Knowledge FK 1 10 20 29
Don’t Know DK 58 40 20 2
[image:6.595.193.557.617.705.2]4) Conclusion #4: Useful derived values to measure practical aspects of a student’s knowledge.
Two other scores that could be useful in assessing student knowledge have been re-ported (Dugdale et al., 1979).
Perceived knowledge = the amount (in %) of the knowledge tested that the student thinks he/she has (both true and false). Accuracy of knowledge = the proportion of perceived knowledge that is true.
Students with the same score in a C/W/A objective test could believe that they have knowledge (true or false) of 42% to 98% of the items tested and the percentage of that “knowledge” that is correct could vary from 98% to 70%. These data are obviously im-portant in assessing the student’s fitness for professional practice and also in designing teaching to remedy deficiencies
5) Conclusion #5 Increasing the level of risk aversion lowers overall scores but may not alter the liability for error.
Faculties may employ negative scoring in objective assessments to reduce guessing and other risk taking behaviors. Increasing risk aversion changes the scores as shown below. From #I we have
Risk Aversion score = (Number of Don’t Know Answers)/(Total number of An-swers).
Risk Aversion (RA) will therefore vary from 0.0 to 1.0. A student who will always “have a go” will answer all questions no matter how uncertain will have a RA score of zero. The various combinations of Correct and Wrong responses do not affect the RA score.
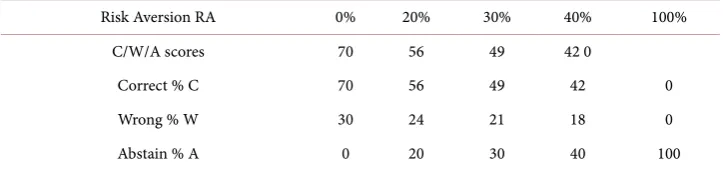
For a student with TK = 60, FK = 20 DK = 20 (see Table 2) and with varying levels of RA the C/W/A scores are.
Table 4 shows that as the level of risk aversion increases, the correct and wrong
scores decrease. If the given mark is the number of correct answers then the score for the examination will decrease with increasing risk aversion. The Correct and Wrong scores maintain the same ratio one to the other. Given the range of possible TK, FK and DK values for each of these C/W/A scores, we cannot make any assumption about the levels or accuracy of the TK, FK and DK.
Other calculations can be done using the basic relationships between TK, FK and DK which indicates the student’s knowledge levels and the resulting C/W/A scores.
[image:7.595.192.554.622.707.2]6) Conclusion #6 A correction factor can be calculated and applied to make the C/W/A score risk aversion neutral.
Table 4. C/W/A scores with varying levels of risk aversion and no negative marking for error.
Risk Aversion RA 0% 20% 30% 40% 100%
C/W/A scores 70 56 49 42 0
Correct % C 70 56 49 42 0
Wrong % W 30 24 21 18 0
We should not encourage professionals to take excessive risks in their day-to-day practice, but present scoring schemes penalize risk aversion even if there is no negative mark for wrong answers and therefore encourage risk taking (see Table 5). A simple correction factor can make the scores in a C/W/A paper risk neutral, by scaling the scores to a risk aversion level of 0%. To each of scores in Table 6 we apply the correc-tion factor (CF)
(
)
CF=1 1 RA−
This should be done on the scores in the Table 6. Any negative marking for error should be done on the revised scores.
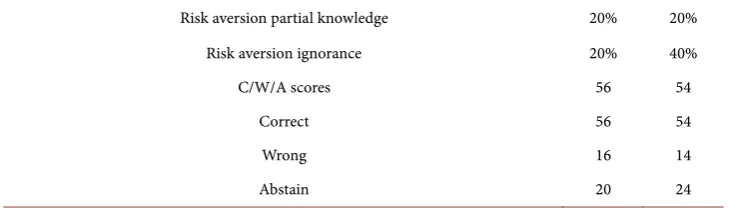
7) Varying risk aversion for ignorance.
It seems likely that students will be more averse to random guessing answers from ignorance than from partial knowledge. In the argument above, the two levels of risk aversion were made equal. If we double the risk aversion for ignorance but leave other factors the same, Table 6 shows that the change in outcomes is small and does not af-fect the underlying arguments.
6. The Logic of Type 1 MCQs
Type 1 MCQs appear to have different properties to the MTFQ format. However, this is in the format rather than in the intrinsic logic of the question. In a Type A MCQ each question demands a single answer. The Type A MCQ
An apple is Fruit [ ] Mineral [ ] Animal [ ]
can be written in the format.
Table 5. In the example above (Table 3) the values of perceived knowledge and accuracy of knowledge are.
*A *B *C *D
Perceived knowledge % 42 60 80 98
[image:8.595.191.555.503.555.2]Accuracy of knowledge % 98 83 75 70
Table 6. Shows an example of change in outcomes with increased risk aversion for ignorance. Using the levels of TK, FK and DK in Table 2.
Risk aversion partial knowledge 20% 20%
Risk aversion ignorance 20% 40%
C/W/A scores 56 54
Correct 56 54
Wrong 16 14
[image:8.595.190.555.601.706.2]An apple is Fruit [ ] Mineral [ ] Animal [ ]
Condition Mark one box or leave blank to abstain.
This demands one answer which may be Correct or Wrong. If no answer is given we assume Don’t Know. A Type A MCQ is therefore equivalent to a single line in an MTFQ and has the same logical properties.
7. Discussion
Objective questions have been a major form of student assessment for many years. Scores from both the standard Type A MCQ and the MTFQ correlate well with other forms of assessment. Both forms give a real and valid measure of the ability of students, but there is no consensus about the best way to recognize and manage uncertain know-ledge and misinformation. If this could be done, it would strengthen the validity of ob-jective questions as tests of student abilities, and also identify sources or error and so improve the process of teaching and learning.
Central to these aims are the definitions of states of knowledge. I have used standard and practical definitions for “true knowledge”, “false knowledge” aka “misinformation” and for “ignorance” aka “don’t know”. My definition of “risk aversion” is designed to meet the needs of the objective question format. I have replaced the largely immeasura-ble concept of “psychological uncertainty” with an action-based measure of the percen-tage of items of “knowledge”, then the student will avoid using under given levels of reward/penalty. The numerical value of this level of “risk aversion” is easily calculated and has a wide application in any assessment of scores. It can also be used to correct C/W/A scores for differing levels of risk aversion. However, it assumes the same wil-lingness of the subject to risk the use positive information as to reject the use of ignor-ance. The mental treatments of truth and falsity are known to differ (Roediger & Marsh, 2005), so this needs clarification and/or confirmation. The principles used here provide a solution which is simple and mathematically elegant. Detailed dissection of individual parts is unlikely to change the overall picture, but will complicate the ma-thematics and the logic. In this paper I have traded numerical accuracy for simplicity so as to provide a framework for the extensive and intensive studies in the literature.
measures of student performance. The student who believes he/she has a large amount of knowledge but much of it is false probably needs different remedial education from a timid student who claims only a small amount of knowledge, but most is correct.
References
Anderson, L., & Krathwohl, A. (2000). Taxonomy of Teaching and Learning: A Revision of Bloom’s Taxonomy of Educational Objectives. Educational Psychology, 479-480.
Bloom, B. S. (1972). Taxonomy of Educational Objectives: Handbook 1, Cognitive Domain. New York: Mackay.
Burton, R. F. (2002). Misinformation, Partial Knowledge and Guessing in True/False Tests. Med-ical Education, 36, 805-811. http://dx.doi.org/10.1046/j.1365-2923.2002.01299.x
Burton, R. F. (2004). Multiple Choice and True/False Tests: Reliability Measures and Some Im-plications of Negative Marking. Assessment & Evaluation in Higher Education, 29, 585-595.
http://dx.doi.org/10.1080/02602930410001689153
Dugdale, A. (2013). Towards More Efficient Assessments: Increasing Information from Objective Examinations. Creative Education, 4, 39-41. http://dx.doi.org/10.4236/ce.2013.46A007
Dugdale, A. (2015). The Forgotten Dimension: The Information Content of Objective Questions. Creative Education, 6, 1760-1767. http://dx.doi.org/10.4236/ce.2015.616178
Dugdale, A. E., Chandler, D., & Baghurst, K. (1979). Knowledge and Belief in Nutrition. The American Journal of Clinical Nutrition, 32, 441-445.
Ebel, J. (1968) Blind Guessing in Objective Achievement Tests. Journal of Educational Measure-ment, 5, 321-325. http://dx.doi.org/10.1111/j.1745-3984.1968.tb00646.x
Fellows, K. K., & Farah, M. J. (2003). Ventromedial Frontal Cortex Mediates Affective Shifting in Humans: Evidence from a Reversal Learning Paradigm. Brain, 126, 1830-1837.
http://dx.doi.org/10.1093/brain/awg180
Kelly, S., & Dennick, R. (2009). Evidence of Gender Bias in True-False-Abstain Medical Exami-nations. BMC Medical Education, 9, 32. http://dx.doi.org/10.1186/1472-6920-9-32
Loftus, E. F., & Hoffman, H. G. (1989). Misinformation and Memory: The Creation of New Memories. Journal of Experimental Psychology, 118, 100-104.
http://dx.doi.org/10.1037/0096-3445.118.1.100
Roediger III, H. L., & Marsh, E. J. (2005). The Positive and Negative Consequences of Multiple Choice Testing. Journal of Experimental Psychology, Learning, Memory and Cognition, 31, 1155-1159. http://dx.doi.org/10.1037/0278-7393.31.5.1155
Tavakol, M., & Dennick, R. (2011). Post-Examination Analysis of Objective Tests. Medical Teacher, 33, 447-458. http://dx.doi.org/10.3109/0142159X.2011.564682
Van der Vleutin, C. P. M., & Schuwirth, I. W. T., Muitjens, A. M. M., Thoben, A. J. N. M., Cohen-Schotanus, J., & van Boven, C. P. A. (2004). Cross Institutional Collaboration in As-sessment: A Case on Progress Testing. Medical Teacher, 26, 719-725.
Submit or recommend next manuscript to SCIRP and we will provide best service for you:
Accepting pre-submission inquiries through Email, Facebook, LinkedIn, Twitter, etc. A wide selection of journals (inclusive of 9 subjects, more than 200 journals)
Providing 24-hour high-quality service User-friendly online submission system Fair and swift peer-review system
Efficient typesetting and proofreading procedure
Display of the result of downloads and visits, as well as the number of cited articles Maximum dissemination of your research work