Munich Personal RePEc Archive
Bridging the gap between migrants and
the banking system.
Albareto, G. and Mistrulli, P.E.
5 October 2010
Br idgin g t h e ga p be t w e e n m igr a n t s a n d t h e
ba n k in g syst e m
Giorgio Albaret o° and Paolo Em ilio Mist rulli*
This draft :
Oct ober 5, 2010
Abst r a ct
I n t his paper , we address t wo relat ed issues. First , we t est whet her m icro firm s run by m igrant s pay m ore for credit t han firm s run by nat ive ent repreneurs. Second, w e verify whet her t he differences in t he cost of credit bet ween t hese t wo gr oups of ent repr eneur s decrease as long as t he inform at ional and cult ural gap narrow. To t his aim we em ploy a large and unique dat a set providing us wit h det ailed inform at ion about each overdraft loan grant ed by banks t o sole propriet orships based in I t aly. We find t hat fir m s run by m igrant s pay , on average, alm ost 70 basis point s m ore for credit t han t hose run by ent repr eneur s born in I t aly. The int er est rat e differ ent ial is lower for ent repreneur s born in I t aly whose parent s were nat ives of ot her count ries ( “ second generat ion” m igr ant s) and, am ong t hose born abroad, for m igrant s whose parent s w ere nat ives of I t aly ( “ I t alian m igrant s” ) . These result s suggest t hat cult ural differences m ay m at t er for t he funct ioning of t he credit m arket . A lengt hening in credit hist or y m ay help m igrant s t o “ bridge t he gap” . We find t hat , on average, int erest rat es lower wit h t he lengt h of t he credit hist ory. Furt herm ore, and m ore im port ant ly from t he paper perspect iv e, firm s run by m igrant s benefit m ore from a repeat ed int eract ion wit h t he banking syst em . Finally, we find t hat t he size of t he m igrant com m unit y and t he im provem ent s in bank abilit y t o deal wit h cult ural diversit y bot h cont ribut e t o narrow t he int er est rat e differ ent ial bet ween m igrant and I t alian ent repreneurs.
1 .
1 .
I n t r odu ct ion
I n t r odu ct ion
11The recent st rong grow t h of m igrant ent repreneurship provides banking syst em s w it h new lending opport unit ies. How ever, lending t o firm s run by m igrant s m ay require specific skills and invest m ent s. Besides t hose relat ed t o sm all firm lending in general, st em m ing fr om inform at ional opaqueness, lending t o foreign firm s m ay require som e furt her effort t o ‘bridge t he gap’ bet w een t he lender and t he borrow er due t o cult ural and inst it ut ional differences bet w een t he hom e and t he host count ry. Everyt hing being equal, m igrant credit w ort hiness m ight be m ore difficult t o assess com pared t o ot her borrow ers. Furt herm ore, apart from inform at ional gaps, cult ural and inst it ut ional differences bet w een count ries m ay also fuel skept icism or m ist rust t owards m igrant s. All t hese fact or s are likely t o adversely affect t he access by m igrant s t o t he credit m arket .
° Bank of I t aly, Econom ic Research Depart m ent . * Bank of I t aly, Econom ic Research Unit , Pot enza Branch.
1 We w ish t o t hank Giorgio Gobbi and Enrico Set t e for helpful com m ent s on a preceding version of
I n t his paper, w e address t w o relat ed issues. First , w e t est w het her m icro firm s run by m igrant s pay m ore for credit t han firm s run by nat ive ent repreneurs. Second, w e verify w het her t he differences in t he cost of credit bet w een t hese t w o gr oups of ent repreneurs low er as long as t he inform at ional and cult ural gap narrow . To t his aim w e em ploy a large and unique dat a set cont aining det ailed infor m at ion on loan cont ract s obt ained fr om t he I t alian Credit Regist er ( CR) and
t he Bank of I t aly Survey on Loan I nt erest Rat es.2 This is t he first paper w hich
addresses t hese issues for I t aly. To our best know ledge, t his paper is also t he first t o invest igat e different channels by w hich t he gap bet w een m igrant s and banks m ay be bridged.
I t aly is a suit able count ry for invest igat ing t hese issues because m igrant ent repreneurship is a grow ing and recent phenom enon. As of Decem ber 2009 t he num ber of sole propriet or ships run by m igrant s were over 250,000, m ore t han t w ice t han in 2003, w hen t hey w ere around 100,000. Migrat ion and foreign ent repreneurship, in part icular, are relat ively new phenom ena for I t aly. This m ay exacerbat e t he difficult ies m igrant s m ay encount er in accessing t he credit m arket in I t aly com pared t o ot her count ries which are m or e accust om ed t o lend t o m inorit ies.
The lit erat ure on t he access t o credit m arket s by m inorit ies focuses m ost ly on t he Unit ed St at es. Cavalluzzo and Cavalluzzo ( 1998) and, m ore recent ly, Cavalluzzo, Cavalluzzo and Wolken ( 2002) , Blanchflow er, Levine and Zim m erm an ( 2003) provide evidence t hat banks discrim inat e against firm s ow ned by African- Am ericans; t he analysis by Fraser ( 2009) concerns t he sm all business credit in t he UK. Ot her papers have invest igat ed t he credit m arket for households ( e.g., Brow ne, McEneane, Munnell and Toot ell, 1996; Toot ell, 1996; Ross and Yinger, 2002; Edelberg, 2007) show ing t hat discrim inat ion in t he m arket for m ort gages is less im port ant t han in business lending. Giannet t i and Yafeh ( 2008) , st udying t he m arket for syndicat ed loans, show t hat t he great er is t he cult ural dist ance bet w een t he lender and t he borrow er t he less favorable are t he credit condit ions charged. Bot t azzi, Da Rin and Hellm ann ( 2007) provide sim ilar evidence concerning vent ure capit al m arket . More in general, Guiso, Sapienza and Zingales ( 2006) and Alesina and La Ferrara ( 2005) suggest t hat cult ural fact or s affect econom ic out com es. Ot her st udies indicat e t hat t he different level of credit or prot ect ion in t he nat ive count ries affect s m igrant access t o financial services in t he host one ( Osili and Paulson, 2005 and 2006) .
According t o t he result s of our em pirical analysis, firm s run by m igrant s pay, on average, alm ost 70 basis point s m ore for credit t han t hose run by ent repreneurs born in I t aly. We t hen invest igat e different channels by w hich t he int erest rat e different ial bet w een m igrant s and I t alians m ay narr ow . Fir st , w e verify w het her t he cost of credit for m igrant s converge t o t he one charged t o nat ives as long as t he relat ionship w it h t he banking syst em goes on. I n part icular, w e find t hat t he int erest r at e spread lowers as t he credit hist ory lengt hens. We int erpr et t he fact t hat firm s run by m igrant s, due t o t heir higher ex- ant e “ opaqueness” , benefit m ore from a repeat ed int eract ion w it h t he banking syst em as a prove t hat it conveys r elat ively m ore inform at ion t o banks about m igrant ent repreneur s com pared t o ot her firm s. Besides t hat , lengt hening of cr edit hist or y helps m igrant s bet t er par t icipat e in t he financial sect or ( ( “ financial int egrat ion” ) . Not w it hst anding t hese effect s, t he int erest rat e different ial does not disappear.
This m ight be due t o a persist ing cult ural gap bet w een banks and m igrant s. This int erpr et at ion is consist ent w it h t he evidence concerning t he cost of cr edit for som e ent repreneurs w hich are presum ably quit e cult ural affine t o nat ives: a) t he int erest rat e different ial is lower for ent repreneurs born in I t aly w hose parent s
are from abroad (second generat ion m igrant s) and b) am ong t hose born abroad,
for m igrant s whose fam ily was originally I t alian (I t alian m igrant s) . Secondly, w e show t hat a w ide m igrant social net w orking also reduces t he int erest rat e gap. This result suggest s t hat banks m ay obt ain relevant inform at ion not only t hrough a repeat ed int eract ion w it h t he sam e borrow er but also by int eract ing w it h different borrow ers of t he sam e t ype. Finally, t he int erest rat e spread bet w een m igrant s and nat ives low er s as long as banks abilit y t o deal w it h cult ural diversit ies im proves.
The rem ainder of t he paper is as follow s. The next sect ion describes t he dat a. The t hird sect ion present s t he result s of our econom et ric analysis concerning t he exist ence of an int erest r at e different ial bet w een m igrant and I t alian ent repreneurs. I n t he fourt h one w e invest igat e t he w ays by w hich t he int erest rat e different ial m ay be narrow ed. The fift h one concludes.
2 .
2 .
D a t a
D a t a
The dat a com e from t w o sources: t he Cr edit Regist er ( CR) run by t he Bank of I t aly, cont aining det ailed inform at ion on all loan cont ract s grant ed t o each borrow er w hose t ot al debt from a bank is above 75,000 euros ( 30,000 euros since January 2009; no t hreshold is required for bad loans) , and t he Bank of I t aly Loan I nt erest Rat e Survey, including inform at ion on int erest rat es charged on each loan grant ed by a sam ple of about 200 I t alian banks. This sam ple is highly represent at ive of t he I t alian m arket for loans t o sm all firm s: t hese banks account for over 80 per cent of t he t ot al loans grant ed t o m icr o fir m s. Furt herm ore, t he sam ple is represent at ive of t he universe of I t alian banks in t erm s of bank size, cat egor y and locat ion.
Dat a refer s t o over draft loans grant ed t o m icro fir m s. We focus on m icro firm s ( sole propr iet or ships) for t wo m ain reasons. First , by looking at t heir fiscal code, obt ained from t he CR, it ’s st raight forw ard t o ident ify m igr ant s’ count ries of origin. Second, sole propriet orships are widely spread in I t aly and t hey also
prevail am ong de- novo firm s.
Aft er a cleaning procedure, w e end up w it h a sam ple of over 2.4 m illion
obser vat ions relat ed t o 18 quart er s fr om March 2004 t o June 2008.3 The
num ber of m igrant firm s is m uch lower ( about 5,000) t han t hat of nat ive fir m s ( alm ost 225,000) . Apart from t hat , our sam ple is highly unbalanced. I n part icular, m igrant s t end t o be concent rat ed in few t owns and sect or s. They show a quit e short er credit hist ory and t hey t end t o bor row from a lower num ber of banks com pared t o nat ives. Non- I t alian ent repreneurs are relat ively younger t han I t alian ones ( t able 1) . Those w it h less t han 40 years account for 50 per cent of m igrant ent repreneurs, com pared t o only 30 per cent for I t alians. They are also relat ively m or e likely t o run firm s in t he const r uct ion sect or. The average size is sim ilar t o t hat of t he I t alian ones, even if art isans ar e m ore w idespread am ong m igrant s. The share of m igrant s’ m icro firm s run by w om en ( 26 per cent ) is higher t han t hat for I t alians ( 19 per cent ) . Credit hist ory of I t alian ent repreneurs is t w ice t he one of m igrant ones. Most of t he m igrant firm s ar e locat ed in Nort hern I t aly ( over 65 per cent ) ; 24 per cent of t hem are locat ed in Cent ral I t aly, w hile only 11 per cent are in Sout hern I t aly.
Due t o t hese st rong dist ribut ional differences, in t he next sect ion w e also show t he result s of t he econom et ric analysis based on a sm aller but highly balanced sam ple.
3 . D o m igr a n t s pa y m or e for cr e dit ?
I n t his sect ion w e t est w het her m icro firm s run by m igrant s pay m ore for credit t han t hose run by nat ives. The basic r egression equat ion is t he follow ing:
(i)
r
i,j,t=
α
+
θ
immi
j+
β
firm
j,t+
γ
credit
i,j,t+
δ
public
aid
j,t+
μ
credit
history
j,t+
ρ
time
t+
ε
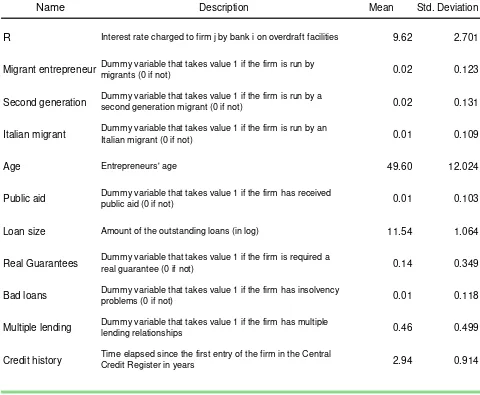
i,j,tw here r is t he int erest rat e charged t o t he overdraft loan grant ed by bank i t o firm j at t he quart er t, im m i is a dum m y w hich equals 1 for m icr o firm s run by m igrant s, 0 ot herw ise ( see t able 2 for a det ailed descript ion of t he variables used in our est im at es) .
Firm repr esent s a set of cont rol variables concerning firm charact erist ics
including econom ic sect or ( ar ound 200 econom ic sect or s) and firm locat ion ( 103 provinces) dum m ies, and age of t he ent repreneur.
Credit is a set of cont rols for bank lending charact er ist ics: loan size, presence of real guarant ees specifically post ed t o overdraft loans, num ber of banks financing
t he firm , and a dum m y t aking t he value of 1 if ot her banks different from bank i
classify som e loan gr ant ed t o firm j as a bad loan.
Public aid is a dum m y variable which is equal t o 1 if t he firm has benefit ed from public subsidies, 0 ot herwise; m igrant firm s m ay be less able t o receive public subsidies, w hich m ay affect credit condit ions.
We cont rol for t he num ber of quart ers elapsed since t he first t im e t he firm has
been recorded in t he CR (cr edit hist or y) t o be sure t hat t he int er est rat e
3 To exclude out liers dat a have been t rim m ed t o t he 1- 99 percent ile of t he int erest rat e
different ial bet w een m igrant firm s and t he ot hers is not due t o a short er lengt h of t heir cr edit hist ory.
Finally, t o cont rol for changes in m acroeconom ic condit ions during t he sam ple period, w e include quart er fixed effect s (t im e) .
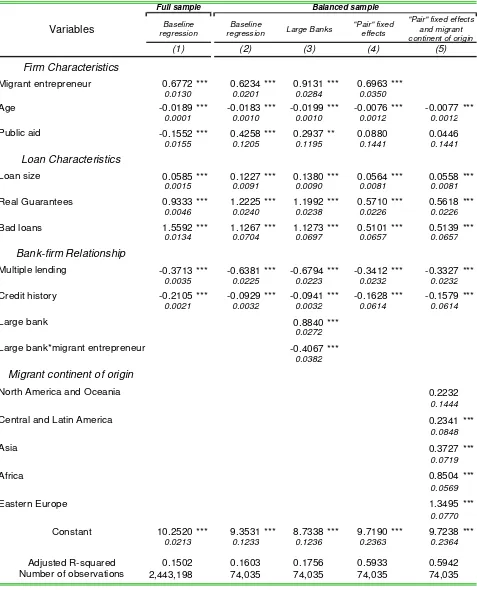
Table 3 report s our est im at ion result s. According t o equat ion in colum n 1,
m igrant s pay 68 basis point s m ore for credit com pared t o ot her firm s. I n t he following equat ions, we rest r ict our sam ple in order t o im prove t he balancing bet w een m igrant and non m igrant firm s. As show n by descript ive st at ist ics, m igrant s t end t o be concent rat ed in specific econom ic sect or s, t owns, fir m size classes and gender. They also borrow from a low er num ber of banks and t hey m ay differ significant ly in t erm s of credit hist ory lengt h. Thus, t o im prove t he accuracy of our est im at es, for each com binat ion of “ lender- fir m sect or - firm size-firm t own- size-firm gender- size-firm fir st year of repor t ing t o t he CR” observed am ong m igrant s ( 7040 different com binat ions) w e look for t he sam e com binat ion am ong nat ives, excluding t he ot her ones left . We end up w it h a highly balanced sam ple of m ore t han 74,000 observat ions, referr ing in 48 per cent of cases t o m igrant firm s.
Regression run on t his sm aller sam ple confirm s t he previous result , indicat ing t hat int erest rat es charged t o m igrant s are higher ( by 62 basis point s) t han
t hose charged t o t he ot her firm s ( colum n 2) . We also check if bank
charact erist ics affect t he cost of credit for m igrant ent repreneurs int roducing t he
dum m y variable largebank and it s int er act ion w it h im m i. The result s of t he
est im at e show t hat large banks charge higher int erest rat es t o all ent repreneurs, and t hat t he int erest rat e different ial bet w een t he t w o t ypes of ent repreneurs is low er w it h respect t o ot her banks ( colum n 3) .
Equat ion in colum n 4 adds “ pair” fixed effect s, i.e. w e add dum m ies for each
observed com binat ion w e used t o balance t he sam ple. I n t his w ay w e j oint ly cont rol for lender, firm sect or, firm size, firm t ow n, ent repreneur gender, firm first year of report ing t o t he CR. Again, w e find t hat m igrant s pay alm ost 70 basis point s m ore for credit t han nat ives.
Finally, result s in colum n 5 suggest t hat m igrant s are not all t he sam e. We
proxy differences am ong foreign ent repreneurs w it h t heir cont inent of origin. The result s indicat e t hat ent repreneur s from East ern Europe pay int erest rat es 1.3 percent age point s higher t han t hose charged t o I t alian ent repreneurs; t hose from Asia and Africa alm ost 40 and 85 basis point s m ore respect ively. Ent repreneurs from Cent ral and Lat in Am erica pay int erest rat es over 20 basis point s higher t han t hose paid by I t alian ones. I nt erest rat es charged on ent repreneurs from Nort h Am erica and Oceania are not st at ist ically different from t hose charged t o I t alian ones.
correlat es w it h risk, t he est im at ed higher cost of credit observed for m igrant s is only due t o such a bias.
To deal w it h t his issue w e exploit a sort of nat ural experim ent . As of January 2009 t he CR census t hreshold was lowered from 75.000 t o 30.000 euro. We exploit t his regulat ory change t o assess w het her m igrant firm s are m ore oft en rat ioned t han nat ive firm s. I n part icular, w e est im at e a probit m odel for t he probabilit y a firm is bet w een t he 75.000 and 30.000 euro t hreshold: t hose firm s w hich present a higher probabilit y w ould suffer m ore from quant it y rat ioning. I n pract ice, w e look for t hose fir m s w hich are report ed t o t he Credit Regist er in January 2009, j ust aft er t he t hreshold has been low ered t o 30.000 euro, and w ould not be report ed in case t he t hreshold w as st ill equal t o 75.000 euro. Then w e check if t his probabilit y is low er for m igrant s, com pared t o obser vat ionally equivalent nat ives, by est im at ing t he follow ing probit equat ion:
(ii)
Prob(“rationing”
j)=
α
+
ξ
immi
j+
β
other
firm
characteristics
j+
ε
jwhere fir m charact erist ics include firm s’ size, econom ic sect or and province of locat ion.
We find t hat for m igrant s, everyt hing being equal, t he probabilit y of being “ rat ioned” is 1.2 per cent higher t han for nat ives. This im plies t hat , if any, our previous r esult s about t he int erest rat e different ial are dow nw ard biased, i.e. t he CR census t hreshold is m ore binding for m igrant s t han for nat ives and, as a consequence, nat ives report ed t o t he CR t end t o be on av erage riskier t han m igrant s.
This r esult is also consist ent w it h t he higher cost for credit paid by m igrant s, support ing t he view t hat m igrant s not only pay m ore for credit but t hey also t end t o obt ain less cr edit t han ot her sim ilar firm s.
4 . Br idgin g t h e ga p be t w e e n m igr a n t s a n d t h e ba n k in g syst e m
I n t he pr evious sect ion w e show ed t hat m igrant s pay m ore for credit t han nat ives. This int erest rat e different ial m ay be at t ribut ed t o different reasons: differences in t he default risk of t he t w o t ypes of ent repreneurs, t he fact t hat banks can associat e t o single m igrant ent repreneurs t he charact erist ics of t heir count r ies of or igin ( “ st at ist ical discrim inat ion” ) , “ t ast e- based discr im inat ion” . We don’t have t he infor m at ion necessar y t o assess t he relat ive im port ance of t hese explanat ions. From now on w e invest igat e t he w ays by w hich int er est rat e different ial m ay be narrow ed.
Sect ion 4.2 shows t hat cult ural int egr at ion also helps m igrant narr ow t he int erest r at e differ ent ial. We t est t his by indent ifying “ second generat ion” m igrant s am ong ent repreneurs born in I t aly whose parent s were fr om abroad and “ I t alian m igrant s” am ong ent repreneurs born abroad w hose parent s wer e originally I t alian. I ndeed, t hese t w o groups of ent repreneurs m ight be m ore cult ural affine t o nat ives com pared t o “ pure” m igrant s ( i.e. m igrant s born abroad w hose parent s w er e also foreign) .
Anot her channel by w hich t he gap m ay be bridged is relat ed t o t he reput at ion of t he com m unit y of m igrant s as a w hole. I n sect ion 4.3 we explore t his possibilit y by t est ing w het her t he size of t he m igrant business net w ork helps foreign firm s access t he credit m ar ket .
Finally, bank im provem ent s in int eract ing w it h m igrant s m ay represent anot her channel t o bridge t he gap bet w een m igrant s and t he banking syst em . I n sect ion 4.4. w e t est if t he recent upgrading in t he supply of financial product s t o m igrant s m ay involve bet t er condit ions in t heir access t o t he banking syst em .
4.1
Credit hist ory
The different ial bet w een int erest rat es on loans t o m igrant and I t alian firm s m ay be due t o a lack of credit hist ory of t he form er, w hich have accessed t he credit m arket m ore recent ly t han t he lat t er. On one hand, a repeat ed int eract ion w it h t he banking syst em m ay help banks bet t er assess firm s’ credit w ort hiness, in part icular for opaque firm s. On t he ot her hand, t he lengt hening of t heir credit hist ory m ay help m igrant s bet t er deal w it h banks. I ndeed, by a repeat ed int eract ion t hey m ay bet t er com prehend t he rules and t he funct ioning of t he host banking syst em and consequent ly obt ain bet t er cr edit condit ions. We t hen expect t hat t he lengt h of t he credit hist ory has a great er im pact on m igrant financing condit ions since, apart from helping bank overcom e asym m et ries of infor m at ion, it helps m igrant s bet t er part icipat e in t he financial sect or ( “ financial int egrat ion” ) .
To t est t his hypot hesis w e est im at e t he follow ing equat ion:
(iii)
r
i,j,t=
α
+
θ
immi
j+
β
firm
j,t+
γ
credit
i,j,t+
δ
public
aid
j,t+
μ
credit
history
j,t*noimmi
j+
ν
credit
history
j,t*immi
j+
ρ
time
t+
ε
i,j,tw hich adds t o econom et r ic m odel ( i) t w o int er act ion t erm s: one is credit
hist ory* im m i and t he ot her is credit hist ory* noim m i, w her e im m i and noim m i
are dum m y variables w hich equal 1 if t he firm is run by a m igrant ( a non m igrant for noim m i) , and 0 ot herw ise. This allow s us t o t est if t he lengt h of t he relat ionship w it h t he banking syst em has a great er im pact on m igrant cost of credit , consist ent ly w it h t he view t hat t he lengt h of credit hist ory is a pr oxy for m igrant financial int egrat ion.
t hat , as long as banks and m igrant s know each ot her bet t er, m ist rust and skept icism t end t o soft en. This fact or is reasonably less im port ant for nat ive firm s which are cult urally sim ilar t o bank officer s. As a consequence, t his fact or m ay also cont r ibut e t o t he narrowing in t he int erest rat e different ial dr iven by credit hist ory lengt hening.
How ever, our result s m ight be also due t o a survival bias affect ing nat ives and m igrant s in a different w ay. I ndeed, t he lengt h of credit hist ory is highly correlat ed wit h t he qualit y of t he firm . I t m ight be t he case t hat , as long as credit hist ory lengt hens, riskier borrow ers default and t hen drop out from t he sam ple. I f t his process is fast er for m igrant s com par ed t o nat ives, t hen at least part of t he reduct ion in t he int erest rat e different ial relat ed t o credit hist ory m ight be due t o an asym m et ric survival bias. Our previous result on t he probabilit y of rat ioning suggest s t hat , if any, an asym m et r ic survival bias exist s but it goes in t he direct ion of w idening t he int erest rat e different ial bet w een m igrant s and nat ives w hen t heir credit hist or y lengt hens. We showed t hat m igrant s t end t o be m ore frequent ly rat ioned by banks, im plying t hat ex- ant e t hey are less risky t han nat ives. This evidence suggest s t hat credit w ort hiness evaluat ion by bank s t ends t o be st rict er w it h respect t o m igrant s.
I f t his hypot hesis is t rue, t he exit from our sam ple should concern m igrant ent repreneurs m ore t han I t alian ones. To check t his hypot hesis w e const ruct a sam ple including only t hose firm s w hich began a relat ionship w it h t he banking syst em during t he first year of our sam ple period ( 2004 cohort ) : t he percent ages of m igrant ent repreneurs on t ot al ent repreneurs at t he beginning and at t he end of t he sam ple period are not st at ist ically differ ent ( 2.24 per cent in 2004 and 2.16 per cent in June 2008) . This evidence indicat es t hat t he survival rat e is sim ilar for t he t w o kinds of ent repreneur s. Besides t hat , we perform t he est im at e of equat ion ( iii) only on firm s belonging t o t he 2004 cohor t . The result s of t he est im at e ( not report ed) are sim ilar t o t he ones concerning t he t ot al sam ple: bot h t he coefficient s of t he int eract ions of credit hist ory w it h t he dum m ies ident ifying t he I t alian and m igrant ent repreneurs are negat ive and t he one associat ed w it h m igrant ent repreneurs is higher in absolut e value. This result confirm s t hat t he int erest rat e different ial is not affect ed by t he exist ence of a different survival bias bet w een t he t w o t ypes of ent repreneur.
4.2
Cult ural proxim it y
The int erest rat e different ial m ay depend also on a cult ural m ism at ch bet w een borrow ers and bank officers. To t est t his hypot hesis w e isolat e t w o part icular groups of ent repreneurs. First , am ong t hose ent repreneurs born in I t aly w e
ident ify t hose w hich have not an I t alian surnam e4 ( e.g. t hey have a Chinese
surnam e but t hey w ere born in I t aly) . We call t hese borrow ers “ second generat ion” m igrant ent repreneurs. The access t o t he credit m arket should be easier for t hem since t hey w ere educat ed in I t aly and know how I t alian banks behave. Second, am ong ent repreneurs born abroad t here m ight be som eone
4 To ident ify non I t alian surnam es w e look at t he occurrences of each surnam e in t he CR ( for bot h
w it h an I t alian surnam e, indicat ing t hat t heir fam ily w as or iginally I t alian. We call t hem “ I t alian m igrant s” .5 I ndeed, t heir I t alian origin m ay help t hem bet t er over com e som e skept icism and m ist rust fr om I t alian banks. These t w o groups of ent repreneurs represent a non negligible share of t he sam ple: “ second generat ion” ent repreneurs represent 8 per cent of t he I t alian ones, t he “ I t alian m igrant s” over 40 per cent of t he m igrant s.
We est im at e t he follow ing equat ion:
(iv)
r
i,j,t=
α
+
θ
immi
j+
φ
sndgen
j+
ξ
Italian
migrants
j+
β
firm
j,t+
γ
credit
i,j,t+
δ
public
aid
j,t+
μ
credit
history
j,t+
ρ
time
t+
ε
i,j,tw here sndgen and I t alian m igrant s are dum m y variables which ident ify,
respect ively, t he “ second generat ion” and “ I t alian m igrant s” ent repreneurs.
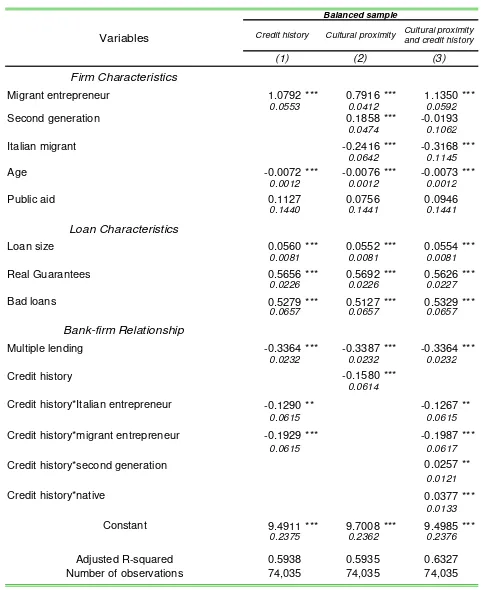
The result s of t he est im at es ( t able 4, colum n 2) indicat e t hat “ pure” m igrant s pay t he highest int erest rat e ( 79 basis point s m ore t han “ pure” I t alian ent repreneurs, i.e. I t alians net of “ second generat ion” ones) ; “ I t alian m igrant s”
pay 55 basis point s6 m ore, w hile “ second generat ion” ent repreneurs pay only 19
basis point s m ore t han “ pure” I t alians. These findings suggest t hat cult ural differences bet w een t he host and t he hom e count ry m ay fuel banks’ skept icism and m ist rust against m igrant s. I ndeed, am ong m igrant s, t hose w ho w ere originally I t alian pay 24 basis point s less for cr edit com pared t o ot her m igrant s. Furt herm ore, am ong I t alians, being born and educat ed in I t aly is such t hat t hose who were originally foreigners pay lit t le m ore for credit t han I t alians.
We t hen t est whet her int erest rat e different ial narrow in a different w ay am ong t hose groups of ent repreneurs w hen t heir credit hist ory lengt hens. To t his aim we est im at e t he following equat ion:
(v)
r
i,j,t=
α
+
θ
immi
j+
σ
noimmi
j+
φ
sndgen
j+
ξ
Italian
migrants
j+
β
firm
j,t+
γ
credit
i,j,t+
δ
public
aid
j,t+
τ
credit
history
i,j,t+
λ
credit
history
i,j,t*noimmi
j+
μ
credit
history
i,j,t*immi
j+
ν
credit
history
i,j,t*sndgen
j,t+
π
credit
history
i,j,t*Italian
migrants
j+
ρ
time
t+
ε
i,j,tw here w e add t he int eract ions bet w een credit hist ory and im m i, noim m i, sndgen
and I t alian m igrant s dum m ies. We find ( t able 4, colum n 3) t hat “ second generat ion” and “ I t alian m igrant s” don’t benefit from t he lengt hening of t heir credit hist ory m ore t han I t alian and m igrant ent repreneurs respect ively ( i.e. t he coefficient s of t he int eract ion bet w een t he variables sndgen and I t alian m igrant s
and t he variable credit hist or y are posit ive and st at ist ically significant , even if t hey are econom ically negligible) . A not able im plicat ion of t hese result s is t hat t he int erest rat e different ial for “ second generat ion” fir m s reduces ver y slowly, indicat ing a persist ent m ist rust of banks against ent repreneurs w it h a foreign fam ily nam e, not w it hst anding t hey w ere born in I t aly.
5 We follow a sim ilar rule t o t hat used for “ second generat ion” m igrant s. See foot not e 4.
6
4.3
Migrant social net w orking
Anecdot al evidence ( Unioncam ere, 2007) suggest s t hat m igr ant s are socially int erconnect ed. This m ay com pensat e for t he lack of individual credit hist ory, helping t hem t o access t he credit m arket in differ ent w ays and t hus lower ing t he cost of credit . First , m igrant s m ay benefit from t he reput at ion gained by ot her people from t he sam e count r y. Banks m ay exploit cross- sect ional dat a t o infer som e m igrant behavioral charact erist ics w hich m ay affect t heir default risk. Second, t he m inorit ies m ay behave as com m unit y. This m ay im ply t hat t he m ost t rust w ort hy m igrant ent repreneurs play as m ent ors, helping firm s w hich lack credit hist ory access t he credit m arket . This m ay also m ean t hat people from t he sam e com m unit y m ay be backed by a sort of inform al m ut ual guarant ee w hich low ers t he loss given default for lenders. I ndeed, m em bers from t he sam e com m unit y, in order t o save t he reput at ion of t heir et hnic group, m ay w ant t o help m em ber firm s in case of financial dist ress, pr event ing t hem fr om default ing. Third, a sort of int ernal credit m arket m ay be w orking w it hin com m unit ies. The m ost t rust w ort hy com m unit y m em ber s m ay borrow m oney from banks t o subsequent ly finance less credit wort hy m em bers. Four t h, being a com m unit y wit h a solid reput at ion m ay creat e st r ong incent ives t o peer m onit oring w it hin t he group m em bers, cont ribut ing t o low er default risk. All t hese channels relat e m ore t o m igrant ent repreneurs t han t o ot her m igrant s because t he fir st ones can build t heir t rust w ort hiness t hrough t heir business perform ance and t heir behavior in t he banking relat ionships.
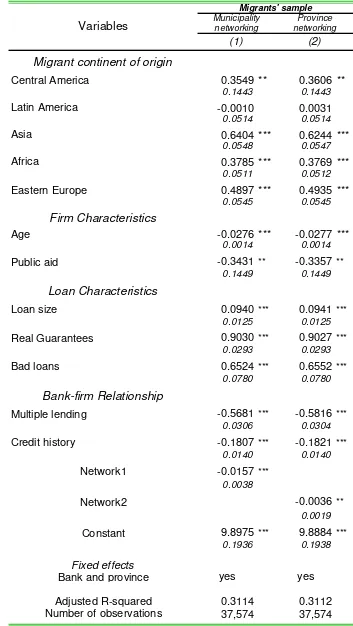
I n order t o m easure w hat w e nam e “ net w ork effect ” w e m ake t w o assum pt ions. First , com m unit ies are m ade of people com ing from t he sam e count ry. Second, physical proxim it y is required t o m ake t he com m unit y w orking. For t hese
reasons, w e define a variable (net w ork1) which is equal t o t he num ber of
m igrant ent repreneurs com ing from t he sam e count ry and headquart ered in t he sam e m unicipalit y.
The result s of t he est im at es ( t able 5, colum n 1) indicat e t he exist ence of a
st rong “ net work effect ” : int erest rat es are 16 basis point s lower when t he num ber of com m unit y m em bers increases by t en unit s. We replicat e our
est im at es by m easuring t he net w ork effect at t he province level (net w ork2) .
Colum n 2 show s t hat t he effect is w eaker w hen t he area w here t he com m unit y is locat ed is ext ended from a m unicipalit y t o t he province, support ing t he view t hat social int eract ion requires physical proxim it y.
4.4
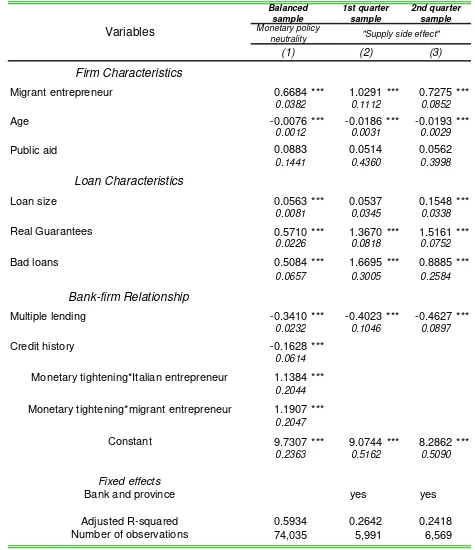
The supply side
As m ent ioned before, t he fourt h channel for “ bridging t he gap” bet w een m igrant s and t he banking syst em m ay be t o im prove t he abilit y of banks t o deal wit h cult ural diversit ies by, for exam ple, offering specific pr oduct s w hich are t ailor ed t o m igrant charact erist ics, by opening m ult iet hnic point s or by t he adopt ion of specific proj ect s support ed by foundat ions and public inst it ut ions.
developing financial product s suit ed for t heir necessit ies. To t est if banks have really upgr aded t heir abilit y t o int eract w it h m igrant s facilit at ing t heir access t o credit and low ering t he m igrant / I t alian int erest rat e different ial, w e est im at e t he benchm ark equat ion on a sam ple of firm s whose relat ionship wit h t he banking syst em is less t han 2- year old in t he fir st and t he last quart er of t he sam ple period. I f our hypot hesis is correct , t he different ial bet w een int erest rat es applied t o m icro firm s run by m igrant s and by I t alians should be low er in t he last quart er of t he sam ple period, aft er cont rolling t hat m onet ar y policy t ight ening has not an asym m et ric effect on int erest rat es charged on m igrant and I t alian ent repreneurs. 7 The result s of t he est im at es confirm our hypot hesis: t he int erest rat e different ial in t he last quart er of our sam ple is 30 basis point s low er t han t he one in t he first quart er ( t able 6, colum ns 2 and 3) . The upgrading of bank supply for m igrant s det erm ines a decrease in int erest rat e different ial bet w een m igrant and I t alian ent repreneurs at t he beginning of t heir relat ionship w it h t he banking syst em .
5
5
.
.
Con clu sion s
During t he last years m igrant ent repreneurship has rapidly spread in I t aly. The financing of m igrant firm s present s som e specificit ies, only part ially invest igat ed by t he econom ic lit erat ure. I n t his paper w e concent rat e on t he cost of bank credit .
According t o t he result s of t he em pirical analysis, m igrant ent repreneurs pay int erest rat es alm ost 70 basis point s higher t han t hose paid by t he I t alian ones. Result s of t he “ nat ural experim ent ” represent ed by t he low ering of t he CR t hreshold suggest t hat , if any, our est im at es t end t o underest im at e t he int erest rat e different ial bet w een m igrant s and nat ives.
The lengt hening in t he credit hist ory of ent repreneurs low ers int erest rat es; t his effect is st ronger for m igrant s, narrow ing t he different ial bet w een t he int erest rat es charged t o t he t wo t ypes of ent repreneur. We int erpret t his st ronger effect as a form of “ financial int egrat ion” , t hrough w hich banks increase t heir know ledge about client s char act erized by higher ex- ant e “ opaqueness” , and m igrant ent repreneurs learn t he funct ioning of t he I t alian banking syst em .
This int erpret at ion is coherent w it h t he em pirical result s concerning t he cost of credit for t w o ot her kinds of ent repreneurs, charact erized by different degrees of cult ural int egrat ion: t he “ second generat ion” ones, born in I t aly but w hose parent s cam e from ot her count ries, and t he “ I t alian m igrant s” , born in ot her count ries but w hose parent s w ere born in I t aly. According t o t he result s of t he est im at es, t he “ second generat ion” ent repreneurs pay int erest rat es slight ly higher t han t he I t alian ones, w hile “ I t alian m igrant s” ent repreneurs pay int erest rat es low er t han t hose paid by “ pure” m igrant s.
7 To t his pur pose w e add t wo int eract ion t erm s bet ween a dum m y variable which ident ifies t he
We also find t hat t he size of t he m igrant com m unit y m ay, at least par t ially, com pensat e for t he lack of an individual credit hist ory. As t he num ber of firm s headquart ered in a given m unicipalit y increases t he int erest rat e declines.
Re fe r e n ce s
[1] A. Alesina and E. La Ferrara ( 2005) , “ Et hnic Diversit y and Econom ic
Perform ance” , Journal of Econom ic Lit erat ure 43, 762- 800.
[2] A. Berger and G. Udell ( 1995) , Relat ionship Lending and Lines of
Credit in Sm all Fir m Finance, Journal of Business, July.
[3] A. Berger and G. Udell ( 2006) , A m ore com plet e concept ual
fram ew ork for SME finance, Journal of Banking and Finance, vol.
30, n. 11.
[4] A. Berger, N. Miller, M. Pet er sen, R. Raj an and J. St ein ( 2005) ,
Does Funct ion Follow Organizat ional Form ? Evidence from t he
Lending Pract ices of Large and Sm all Firm s, Journal of Financial
Econom ics, 76, 237- 270.
[5] D. G. Blanchflow er, P. B. Levine e D. J. Zim m erm an ( 2003) ,
“ Discrim inat ion in t he Sm all- Business Credit Mar ket ” , The Review of Econom ics and St at ist ics, Novem ber 2003, 85 ( 4) , 930- 943.
[6] L. Bot t azzi, M. Da Rin e T. F. Hellm ann ( 2007) , “ The I m por t ance of Trust for I nvest m ent : Evidence from Vent ure Capit al” , m im eo, Univer sit y of Brit ish Colum bia.
[7] L. E. Brow ne, J. McEneaney, A. G. Munnell, and M. B. Toot ell
( 1996) , “ Mort gage Lending in Bost on: I nt erpr et ing HMDA Dat a” ,
Am erican Econom ic Review, 86, 1, 25- 53.
[8] K.S. Cavalluzzo and L. C. Cavalluzzo ( 1999) , “ Mar ket St ruct ure and
Discrim inat ion: The Case of Sm all Business” , Journal of Money,
Credit , and Banking, 30, 4, 771- 792.
[9] K.S. Cavalluzzo, L. C. Cavalluzzo and J. D. Wolken ( 2002) ,
“ Com pet it ion, Sm all Business Financing, and Discrim inat ion:
Evidence from a New Survey” , Journal of Business 75, 641- 679.
[10] W. Eldeberg ( 2007) , “ Racial Dispersion in Consum er Credit I nt erest
Rat es” , Finance and Econom ics discussion series, Federal Reserve
Board, Washingt on, D.C.
[11] Fraser ( 2009) , “ I s t here Et hnic Discr im inat ion in t he UK Market for
Sm all Business Credit ?” I nt ernat ional Sm all Business Journal.
[12] M. Giannet t i and Y. Yafeh ( 2008) , “ Do Cult ural Differences Bet w een
Cont ract ing Par t ies Mat t er? Evidence fr om Syndicat ed Bank Loans” ,
CEPR Discussion Paper n° 7020.
[13] L. Guiso, P. Sapienza and L. Zingales ( 2006) , “ Does Cult ure Affect
Econom ic Out com es?” , Journal of Econom ic Perspect ives.
[14] OECD ( 2010) , “ Ent reprenuership and Migrant s” , Report by t he
OECD Wor king Par t y on SMEs and Ent repr eneurship, OECD.
[15] U. O. Osili and A. Paulson ( 2005) , “ I ndividuals and I nst it ut ions:
Evidence from I nt ernat ional Migrant s in t he US” , Wor king Paper,
[16] U. O. Osili and A. Paulson ( 2008) , “ What Can We Learn about
financial Access from U.S. Migrant s? “ , Wor ld Bank Econom ic
Review.
[17] S. L. Ross and J. Yinger ( 2002) , The Color of Credit : Mort gage
Discrim inat ion, Resear ch Met hodology, and Fair- Lending Enforcem ent, Cam bridge: MI T Press.
[18] J. St ein ( 2002) , “ I nform at ion product ion and capit al allocat ion:
decent ralized versus hierarchical firm s” , Journal of Finance 45, pp.
1891- 1921.
[19] G. M. B. Toot ell ( 1996) , “ Redlining in Bost on: Do Mort gage Lenders
Discrim inat e Against Neighborhood?” , The Quart erly Journal of
Econom ics, vol. 11, n° 4, 1049- 1079.
[20] Unioncam ere ( 2007) , Com port am ent i finanziari e credit izi della
Table 1
Main features of micro firms
(March 2004 - June 2008)
<30 30-39 40-49 50-59 >59 TOTAL
Number of micro firms
owned by migrants (a) 503 1,756 1,557 606 198 4,620
percentage shares 10.9 38.0 33.7 13.1 4.3 100.0
Number of micro firms
owned by Italians (b) 13,772 54,437 68,213 52,772 33,800 222,994
percentage shares 6.2 24.4 30.6 23.7 15.2 100.0
Agricolture Manufacturing Construction Trade
Hotel and restaurant services
Other
services TOTAL
Number of micro firms
owned by migrants (a) 139 966 1,140 1,077 339 959 4,620
percentage shares 3.0 20.9 24.7 23.3 7.3 20.8 100.0
Number of micro firms
owned by Italians (b) 24,897 42,869 34,286 58,176 13,138 49,628 222,994
percentage shares 11.2 19.2 15.4 26.1 5.9 22.3 100.0
More than 20 employees
Beetween 5 and 20 employees
Less than 5 employees
More than 20 employees
Beetween 5 and 20 employees
Less than 5
employees TOTAL
Number of micro firms
owned by migrants (a) 23 101 2,052 34 85 2,325 4,620
percentage shares 0.5 2.2 44.4 0.7 1.8 50.3 100.0
Number of micro firms
owned by Italians (b) 1,481 7,975 77,113 1,439 4,861 130,125 222,994
percentage shares 0.7 3.6 34.6 0.6 2.2 58.4 100.0
Source: Central Credit Register.
(a) Individual firms owned by entrepreneur not born in Norway, Switzerland or in a EU15 country. (b) Individual firms owned by entrepreneur born in Norway, Switzerland or in a EU15 country.
Age of the entrepreneur
Artisans Non artisans
Sector
Table 2
Variable names and definitions
Name Mean Std. Deviation
R 9.62 2.701
Migrant entrepreneur 0.02 0.123
Second generation 0.02 0.131
Italian migrant 0.01 0.109
Age 49.60 12.024
Public aid 0.01 0.103
Loan size 11.54 1.064
Real Guarantees 0.14 0.349
Bad loans 0.01 0.118
Multiple lending 0.46 0.499
Credit history 2.94 0.914
Amount of the outstanding loans (in log)
Dummy variable that takes value 1 if the firm is required a real guarantee (0 if not)
Dummy variable that takes value 1 if the firm has insolvency problems (0 if not)
Dummy variable that takes value 1 if the firm has multiple lending relationships
Dummy variable that takes value 1 if the firm is run by migrants (0 if not)
Time elapsed since the first entry of the firm in the Central Credit Register in years
Description
Interest rate charged to firm j by bank i on overdraft facilities
Dummy variable that takes value 1 if the firm is run by an Italian migrant (0 if not)
Dummy variable that takes value 1 if the firm is run by a second generation migrant (0 if not)
Entrepreneurs' age
Dummy variable that takes value 1 if the firm has received public aid (0 if not)
Table 3
Micro firms and loan interest rates
This table lists the coefficients from a regression with the loan rate charged to sole proprietorships on credit lines (overdraft facilities), in percentage points, as the dependent variable. We employ ordinary least squares estimation. The "balanced" sample is obtained by identifying first the combination of "lender-firm sector-firm size-firm town-firm gender-firm first year of reporting to the CR” among migrants (7040 different combinations). Then we look for the same combination among natives, excluding the other ones left. We end up with a highly balanced sample where observations referred to migrants are 48 per cent of the total. "Pair" fixed effects in columns 4 and 5 allow us to jointly control for "lender-firm sector-firm size-firm town-firm gender-firm first year of reporting to the CR”. *, **, and *** indicate significance at the 10%, 5%, and 1% level, two-tailed.
Firm Characteristics
Migrant entrepreneur 0.6772 *** 0.6234 *** 0.9131 *** 0.6963 ***
0.0130 0.0201 0.0284 0.0350
Age -0.0189 *** -0.0183 *** -0.0199 *** -0.0076 *** -0.0077 ***
0.0001 0.0010 0.0010 0.0012 0.0012
Public aid -0.1552 *** 0.4258 *** 0.2937 ** 0.0880 0.0446
0.0155 0.1205 0.1195 0.1441 0.1441
Loan Characteristics
Loan size 0.0585 *** 0.1227 *** 0.1380 *** 0.0564 *** 0.0558 ***
0.0015 0.0091 0.0090 0.0081 0.0081
Real Guarantees 0.9333 *** 1.2225 *** 1.1992 *** 0.5710 *** 0.5618 ***
0.0046 0.0240 0.0238 0.0226 0.0226
Bad loans 1.5592 *** 1.1267 *** 1.1273 *** 0.5101 *** 0.5139 ***
0.0134 0.0704 0.0697 0.0657 0.0657
Bank-firm Relationship
Multiple lending -0.3713 *** -0.6381 *** -0.6794 *** -0.3412 *** -0.3327 ***
0.0035 0.0225 0.0223 0.0232 0.0232
Credit history -0.2105 *** -0.0929 *** -0.0941 *** -0.1628 *** -0.1579 ***
0.0021 0.0032 0.0032 0.0614 0.0614
Large bank 0.8840 ***
0.0272
Large bank*migrant entrepreneur -0.4067 ***
0.0382
Migrant continent of origin
North America and Oceania 0.2232
0.1444
Central and Latin America 0.2341 ***
0.0848
Asia 0.3727 ***
0.0719
Africa 0.8504 ***
0.0569
Eastern Europe 1.3495 ***
0.0770
Constant 10.2520 *** 9.3531 *** 8.7338 *** 9.7190 *** 9.7238 ***
0.0213 0.1233 0.1236 0.2363 0.2364
Adjusted R-squared 0.1502 0.1603 0.1756 0.5933 0.5942
Number of observations 2,443,198 74,035 74,035 74,035 74,035
(5)
Baseline regression
Baseline
regression Large Banks
"Pair" fixed effects
"Pair" fixed effects and migrant continent of origin
Variables
(1) (2)
Full sample Balanced sample
Table 4
Financial integration, cultural proximity and loan interest rates
This table lists the coefficients from a regression with the loan rate charged to sole proprietorships on credit lines (overdraft facilities), in percentage points, as the dependent variable. We employ ordinary least squares estimation. The "balanced" sample is obtained by identifying first the combination of "lender-firm sector-firm size-firm town-firm gender-firm first year of reporting to the CR” among migrants (7040 different combinations). Then we look for the same combination among natives, excluding the other ones left. We end up with a highly balanced sample where observations referred to migrants are 48 per cent of the total. In all regressions "pair" fixed effects are introduced; they allow us to jointly control for "lender-firm sector-firm size-firm town-size-firm gender-size-firm first year of reporting to the CR”. *, **, and *** indicate significance at the 10%, 5%, and 1% level, two-tailed.
Firm Characteristics
Migrant entrepreneur 1.0792 *** 0.7916 *** 1.1350 ***
0.0553 0.0412 0.0592
Second generation 0.1858 *** -0.0193
0.0474 0.1062
Italian migrant -0.2416 *** -0.3168 ***
0.0642 0.1145
Age -0.0072 *** -0.0076 *** -0.0073 ***
0.0012 0.0012 0.0012
Public aid 0.1127 0.0756 0.0946
0.1440 0.1441 0.1441
Loan Characteristics
Loan size 0.0560 *** 0.0552 *** 0.0554 ***
0.0081 0.0081 0.0081
Real Guarantees 0.5656 *** 0.5692 *** 0.5626 ***
0.0226 0.0226 0.0227
Bad loans 0.5279 *** 0.5127 *** 0.5329 ***
0.0657 0.0657 0.0657
Bank-firm Relationship
Multiple lending -0.3364 *** -0.3387 *** -0.3364 ***
0.0232 0.0232 0.0232
Credit history -0.1580 ***
0.0614
Credit history*Italian entrepreneur -0.1290 ** -0.1267 **
0.0615 0.0615
Credit history*migrant entrepreneur -0.1929 *** -0.1987 ***
0.0615 0.0617
Credit history*second generation 0.0257 **
0.0121
Credit history*native 0.0377 ***
0.0133
Constant 9.4911 *** 9.7008 *** 9.4985 ***
0.2375 0.2362 0.2376
Adjusted R-squared 0.5938 0.5935 0.6327
Number of observations 74,035 74,035 74,035
Cultural proximity Cultural proximity and credit history Variables
Balanced sample
(1) (2) (3)
Table 5
Network effect and loan interest rates
This table lists the coefficients from a regression with the loan rate charged to sole proprietorships on credit lines (overdraft facilities), in percentage points, as the dependent variable. We employ ordinary least squares estimation. The sample is composed of observations only concerning migrant entrepreneurs. *, **, and *** indicate significance at the 10%, 5%, and 1% level, two-tailed.
Migrant continent of origin
Central America 0.3549 ** 0.3606 **
0.1443 0.1443
Latin America -0.0010 0.0031
0.0514 0.0514
Asia 0.6404 *** 0.6244 ***
0.0548 0.0547
Africa 0.3785 *** 0.3769 ***
0.0511 0.0512
Eastern Europe 0.4897 *** 0.4935 ***
0.0545 0.0545
Firm Characteristics
Age -0.0276 *** -0.0277 ***
0.0014 0.0014
Public aid -0.3431 ** -0.3357 **
0.1449 0.1449
Loan Characteristics
Loan size 0.0940*** 0.0941 ***
0.0125 0.0125
Real Guarantees 0.9030*** 0.9027 ***
0.0293 0.0293
Bad loans 0.6524*** 0.6552 ***
0.0780 0.0780
Bank-firm Relationship
Multiple lending -0.5681 *** -0.5816 ***
0.0306 0.0304
Credit history -0.1807 *** -0.1821 ***
0.0140 0.0140
Network1 -0.0157 ***
0.0038
Network2 -0.0036 **
0.0019
Constant 9.8975*** 9.8884 ***
0.1936 0.1938
Fixed effects
Bank and province yes yes
Adjusted R-squared 0.3114 0.3112
Number of observations 37,574 37,574
Variables
(1) (2)
Migrants' sample
Municipality networking
Table 6
Bank supply evolution and loan interest rates
This table lists the coefficients from a regression with the loan rate charged to sole proprietorships on credit lines (overdraft facilities), in percentage points, as the dependent variable. We employ ordinary least squares estimation. The "balanced" sample is obtained by identifying first the combination of "lender-firm sector-firm size-firm town-firm gender-firm first year of reporting to the CR” among migrants (7040 different combinations). Then we look for the same combination among natives, excluding the other ones left. We end up with a highly balanced sample where observations referred to migrants are 48 per cent of the total. "Pair" fixed effects in column 1 allow us to jointly control for "lender-firm sector-firm size-firm town-firm gender-firm first year of reporting to the CR”. *, **, and *** indicate significance at the 10%, 5%, and 1% level, two-tailed.
Firm Characteristics
Migrant entrepreneur 0.6684 *** 1.0291 *** 0.7275 ***
0.0382 0.1112 0.0852
Age -0.0076 *** -0.0186 *** -0.0193 ***
0.0012 0.0031 0.0029
Public aid 0.0883 0.0514 0.0562
0.1441 0.4360 0.3998
Loan Characteristics
Loan size 0.0563 *** 0.0537 0.1548 ***
0.0081 0.0345 0.0338
Real Guarantees 0.5710 *** 1.3670 *** 1.5161 ***
0.0226 0.0818 0.0752
Bad loans 0.5084 *** 1.6695 *** 0.8885 ***
0.0657 0.3005 0.2584
Bank-firm Relationship
Multiple lending -0.3410 *** -0.4023 *** -0.4627 ***
0.0232 0.1046 0.0897
Credit history -0.1628 ***
0.0614
Monetary tightening*Italian entrepreneur 1.1384 ***
0.2044
Monetary tightening*migrant entrepreneur 1.1907 ***
0.2047
Constant 9.7307 *** 9.0744 *** 8.2862 ***
0.2363 0.5162 0.5090
Fixed effects
Bank and province yes yes
Adjusted R-squared 0.5934 0.2642 0.2418
Number of observations 74,035 5,991 6,569
2nd quarter sample "Supply side effect"
(1) (2) (3)
Variables
Monetary policyneutrality Balanced
sample