ISSN Online: 2160-0481 ISSN Print: 2160-0473
Design of an Evacuation Demand Forecasting
Module for Hurricane Planning Applications
Gary P. Moynihan
1, Daniel J. Fonseca
21Department of Civil, Construction, and Environmental Engineering, The University of Alabama, Tuscaloosa, AL, USA 2Department of Mechanical Engineering, The University of Alabama, Tuscaloosa, AL, USA
Abstract
This paper discusses the development and implementation of an evacuation demand forecasting module that was incorporated into a comprehensive decision support system for the planning and management of contraflow operations in the Gulf of Mexico. Contraflow implies the reversing of one direction of a highway in order to permit a substantially increased travel demand exiting away from an area impacted by a natural disaster or any other type of catastrophic event. Correctly estimating the evacuation demand originated from such a catastrophic event is critical to a success-ful contraflow implementation. One problem faced by transportation officials is the arranging of the different stages of this complex traffic procedure. Both the prompt deployment of resources and personnel as well as the duration of the actual contraflow affect the overall effectiveness, safety and cost of the evacuation event. During this project, researchers from the University of Alabama developed an integral decision support system for contraflow evacuation planning to assist the Alabama Depart-ment of Transportation Maintenance Bureau in the evaluation and planning of con-traflow operations oriented to mitigate the evacuation burdens of a hurricane event. This paper focuses on the design of the demand forecasting module of such a deci-sion support system.
Keywords
Hurricane Evacuation, Road Capacity, Demand Forecasting, Decision Support System
1. Introduction
An increasing number of Alabama’s population lives in the eight counties close to the Gulf of Mexico [1], thus making them vulnerable to tropical storms, hurricanes and other extreme weather events. The normal response to these occurrences is to evacuate How to cite this paper: Moynihan, G.P.
and Fonseca, D.J. (2016) Design of an Evacu- ation Demand Forecasting Module for Hurri- cane Planning Applications. Journal of Trans- portation Technologies, 6, 257-276. http://dx.doi.org/10.4236/jtts.2016.65024
Received: July 27, 2016 Accepted: September 24, 2016 Published: September 27, 2016
Copyright © 2016 by authors and Scientific Research Publishing Inc. This work is licensed under the Creative Commons Attribution International License (CC BY 4.0).
inland from the coast. Normal traffic flows turn into congestion, frustration and grid-lock. This reduces the number of vehicles that can leave the Gulf area if an evacuation order is given. The potential risk for catastrophic loss increases if the hurricane strikes stalled traffic, and necessitates further evacuation planning. Such hurricane evacuation planning led to the State of Alabama’s initial plan to “reverse-lane” I-65 to expedite such evacuations from the Gulf Coast. “Reverse-laning”, or “contraflow”, is the process of reversing one direction of traffic on specific routes to facilitate overall evacuation flow. This procedure is generally applicable to Interstates, referred to as “denied access routes”, since traffic control can be applied to interchanges and terminal areas.
1.1. Current System Review
Alabama and several other neighboring states have adopted the concept of contraflow in hurricane evacuation. The idea is to reverse one direction of the roadway in order to accommodate the often substantially increased travel demand moving away from the impact area. The actual contraflow implementation mechanism varies from state to state. One of the more elaborate contraflow procedures is the one that Mississippi and Louisiana share. Mississippi does not utilize contraflow if the only impact area is the coastal area of that state, since the existing roadways can adequately handle evacuation traffic without any modifications. However, an evacuation from New Orleans, Louisi-ana would bring a large amount of additional traffic to Mississippi. Therefore, the two states have established a coordinated hurricane evacuation plan. In this plan, the state of Louisiana will initiate contraflow operation within their borders, and coordinate with Mississippi to extend such operation if needed. The contraflow plan of Louisiana will be implemented 30 hours before the winds from a hurricane of Category 3 and above are anticipated to hit land along the Louisiana coast. Contraflow operations will then be activated when evacuations are initiated in Jefferson and Orleans parishes [2]. If the state of Louisiana decides to implement contraflow within the borders of Louisi-ana only, their Department of Transportation will contact the Mississippi Department of Transportation (MDOT) for their assistance, giving MDOT at least three hours to mobilize the people and equipment necessary to terminate the contraflow operations at the state line. Should it be necessary for the contraflow to extend into Mississippi, the Louisiana governor will contact the Mississippi governor to request initiating contraf-low within Mississippi along I-55 and I-59 at least four hours before the desired activa-tion time [3].
the following roadways: I-75, I-10, I-4, the Florida Turnpike, and SR 528 [6].
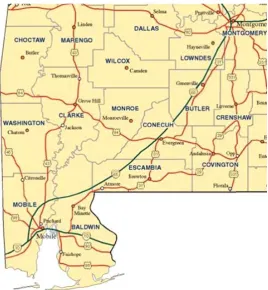
In Alabama, an approximately 140-mile section of I-65 between exit 31 and exit 167 is identified as the contraflow segment. In this case, I-65 would be reverse-laned such that all traffic would flow north, from south of Alabama Route 225, near Mobile, to Exit 167/168, just south of the greater Montgomery metropolitan area [7]. On the ALDOT website, a detailed contraflow (also called reverse-laning) plan is available [8]. The plan specifies four contraflow operating levels. Level 1 begins with the start of hurricane season where necessary assets and personnel assignments are reviewed and equipment and materials are provided to each predetermined staging location. Level 2 begins with the National Weather Service issuing a hurricane watch for the gulf coasts of Alabama and Mississippi or the Florida panhandle. Assigned personnel will be contacted and equipment and materials will be loaded in this stage. Level 3 begins when the watch is upgraded to a warning where personnel and equipment are to be moved into their as-signed locations. Level 4 begins with the Transportation Director for the state of Ala-bama calling the contraflow into effect based on the advice of AlaAla-bama Emergency Management Association (AEMA), and extends to when the Transportation Director issues the order to end contraflow and return to normal traffic operations. Contraflow operations in Alabama involve the cooperation of three Alabama agencies: ALDOT, Alabama Department of Public Safety (ADPS), and AEMA. ALDOT develops the ne-cessary plans and infrastructure to handle contraflow; ADPS enforces contraflow oper-ations for the duration of Level 4; and AEMA counsels the other agencies on emergency management practices. As noted in Figure 1[7], this concept was further refined after Hurricane Katrina, to provide emergency vehicles with an alternate route south via U.S. 31.
Although the contraflow operation increases roadway capacity for evacuation, it is by nature an unusual measure. Practical implementation issues range from traffic control, access management, and use of roadside facilities to safety, labor requirements, and cost [9]. Therefore, care must be taken in the planning and real-time operations of contraf-low evacuation.
1.2. Deficiencies of the Current Approach
Evacuation demand is an important input in determining the onset and duration of contraflow operation. In practice, however, it is difficult to estimate this demand. In addition to the total evacuation demand, the temporal and spatial distributions of such demand are also essential to contraflow planning. Temporal distribution has to do with when people in the impacted areas decide to begin their evacuation. The temporal dis-tribution can be described by a demand profile consisting of estimated evacuation de-mand for each time interval. The spatial distribution is a result of evacuees’ choices of various feeder routes to access the contraflow facility.
Figure 1. Map of contraflow evacuation in Alabama.
Equipment and personnel are deployed first, and the actual call for reversing the south-bound lanes depends on the measured traffic condition and other relevant factors [7].
A final problem faced by Alabama Department of Transportation is the scheduling of different phases in the staged process. The timing for the deployment of equipment and personnel, as well as the initiation and termination of actual contraflow, affects the ef-fectiveness, safety and cost of the operation. The contraflow scheduling problem is characterized by both uncertainties with unknown probability distribution and staged decision process. The three decision stages are timing for equipment and personnel deployment at first, initiation of contraflow, and termination of the operation. At the early stage, information on uncertain traffic and weather conditions is very limited, and all three decisions need to be considered in an integrated manner to assess the overall effect for a particular timing plan for deploying the equipment.
This research investigated various methodologies and developed a design for a com-puter-based tool to help the decision making in contraflow scheduling. The proposed system will have the ability to explicitly optimize the contraflow onset and duration based on the existing and forecasted traffic and weather conditions. Factors such as neighboring states’ evacuation status and mandatory evacuation order will also be con-sidered. Resulting from these efforts is the system design depicted in this paper.
2. Project Objective and Approach
Decision support systems (DSS) are software systems that use advanced algorithmic approaches to solve problems. Within the DSS, the data processor (i.e. the database management system) controls the access and update of data from both internal and ex-ternal files and datasources. The modelbase contains the specific analytical methods used for processing the accessed data. Such methods normally invoke the use of specific algorithms for the particular type of mathematical model under consideration [10].
Accepted DSS development methodology frequently identifies four primary phases: 1) data acquisition, 2) system design, 3) system construction, and 4) verification and validation (e.g. [10]). The first two phases were addressed by this research project. An initial iteration of the third and fourth phases is represented via the development of a spreadsheet prototype, as discussed in this paper. During the data acquisition phase, the key concepts, relationships and sources were identified. ALDOT databases were inves-tigated to obtain relevant data on interstate and state highways in the vicinity of the I-65 contraflow segment. The availability of this relevant data was explored. Traffic data collected included annual average daily traffic, turning movements at exit and entry ramps, percentage of heavy vehicles, average travel speed etc., for both normal traffic conditions and during evacuation conditions from archived historical data. Road geo-metrics data such as number of lanes, location of on and off ramps, interchanges, me-dian crossovers etc., were gathered. Information on the populations of evacuating counties, as well as their corresponding persons-vehicle ratios, was obtained. Finally the data related to incidents during evacuation, including number of occurrences, type of incidents, location, response time, clearance time, queue buildup, etc., were collected from historical databases.
Methods resulting from subsequent project tasks determined the candidate models for incorporation into this systemic framework. Many conventional algorithmic models may not sufficiently apply to specific problem areas, e.g. traffic planning. The utiliza-tion of computer-based simulautiliza-tion, within a DSS, is a long-accepted means of modeling complex systems and their behavior. A simulation model is largely mathematical in nature. Rather than directly describing the overall behavior of the system under inves-tigation, the simulation model attempts to “replicate” this behavior by studying the in-terrelations among its components. The system is decomposed into elements whose behavior can be predicted in terms of probability distributions, for each of the various possible states of the system and its inputs [11]. Model output is normally presented in terms of selected measures that reflect the performance of a system.
Simulation has many advantages. It may provide a complete view of the total opera-tional flow. Perhaps the most important advantage of simulation is that it provides the opportunity for “what-if” analysis. It can project the impact of factors under a variety of conditions. The various decision alternatives then may be evaluated economically, with-out disrupting existing operations, or incurring unnecessary costs.
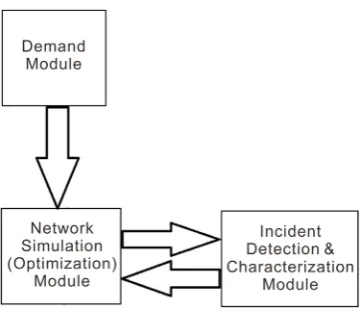
Figure 2. Summary DSS architecture.
focus of this paper addresses the development of the demand forecasting module within this systemic context. Discussion of the functionality and processing of the other mod-ules is provided by Fonseca et al. [12] and Lou et al. [13].
3. Methodology
The study site was examined in detail. The initial crossover from the northbound to the southbound lanes is located at milepost (MP) 30.3. The crossover consists of two lanes, and is 0.03 miles long. The I-65 contraflow section terminates at Exit 167, just south to the greater Montgomery metropolitan area. The final crossover is located at MP (milepost) 167.3. Similarly, the 0.03-mile crossover has two lanes. The immediate down-stream segment of the north terminus is a four-lane freeway, which becomes a three- lane facility at Exit 168. In order to account for the impact of the merging traffic on the entire contraflow operation, the study site was extended to MP 170. It was noted that the merging only occurs on northbound lanes, and the southbound lanes do not carry traffic beyond the north terminus. Therefore, the study site in this project consisted of a 140-mile section of I-65 northbound lanes starting from MP 30 and ending at MP 170, and a 138-mile section of I-65 southbound lanes between MP 30 and MP 168. Relevant geometry and traffic information of the study site was obtained from the ALDOT road-way inventory database, as well as Google Maps. Available variables included number of lanes, lane widths, location of exit ramps, lengths of acceleration and deceleration lanes, and posted speed limits.
extensive literature review (e.g. [14]).
Although the focus was the identification and evaluation of candidate evacuation demand models for incorporation into this research project, investigation identified a large number of literature articles devoted to individual and collected hurricane evacu-ation case studies. These included the Alabama Hurricane Evacuevacu-ation Study [15][16], the Federal Highway Administration’s Best Practices for Road Weather Management [17], the Georgia Department of Transportation Hurricane Preparedness and Response [18], and the National Oceanic and Atmospheric Administration’s Hurricane Planning and Evacuation Assessment Reports [19]. These references emphasize best practices and lessons learned from a number of hurricane evacuations, as opposed to identifying specific algorithmic models to forecast demand. They did prove valuable as sources of data that could support the later selected models. Both the “Alabama Hurricane Evacu-ation Study—Summary Report” [15] and the related “Alabama Hurricane Evacuation Study—Transportation Study” [16] were particularly useful.
A number of algorithmic techniques have been developed to support the evacuation traffic planning and analysis process. These may be broadly categorized as deterministic versus probabilistic in nature. A separate group of references were observed to rely on the use of specific application software to forecast evacuation demand.
As noted by Fonseca et al. [6], “massive terrestrial evacuations can be seen as a net-work optimization problem aiming at selecting optimal routes from a set of candidate roads within an existing evacuation network”. These network representations of evacu-ation problems are extensions of the classical operevacu-ations research assignment problem. For these problems, the basic form of the network is that of the more general minimal cost transshipment (or flow) network. In the network, the arcs represent the flow of people, the source nodes represent initial source inventories (points of entrance into the evacuation network), and the sink nodes represent the final inventories (in this case, destinations). Optimization models (e.g. linear programming, goal programming or dynamic programming) are another category of mathematical models. The model is formulated to either maximize (or minimize) the objective function (depending upon the purpose of the model) within the context of available resources and constraints. A survey of classical examples of transportation network optimization modeling is pro-vided by LeBlanc [20], Magnanti and Wong [21], Yang and Bell [22], and Solanski et al. [23].
then applied to a proposed evacuation situation for the City of Toronto.
Probabilistic models analyze natural conditional variants, as opposed to establishing a single mathematical optimum. For example, Wilmot and Mei [26] applied regression to investigate evacuation demand probabilities and behavior in Southwest Louisiana during Hurricane Andrew. Similarly, Fu and Wilmot [27] incorporated a logit model to estimate the conditional probability of households evacuating during a specific time pe-riod prior to hurricane landfall.
As noted earlier in this paper, computer simulation is a preferred means of modeling such probabilistic representations. Different levels of traffic representations are used by different classes of simulation models. In microscopic simulation models, the intertions of individual vehicles “are captured by using algorithms that represent vehicle ac-celeration and deac-celeration, passing maneuvers, and lane changing behavior” [28]. Ta-naka [29] provides a similar microscopic simulation model of hurricane evacuation on a single lane highway. The amount of detail, that is required at the microscopic level, becomes overwhelming when trying to model a large-scale evacuation over an extensive area. Macroscopic or mesoscopic models are preferred under such circumstances. Ma-croscopic models are used to simulate traffic flow based on speed and traffic density re-lationships, and do not model the detailed interactions between individual vehicles. Mesoscopic simulation models seek a compromise approach. They address individual vehicles in the transportation system, but capture their relationships using aggregate relationships.
A number of articles in the literature describe the application of specific software packages to evacuation modeling, including demand estimation. These software appli-cations may utilize either deterministic or probabilistic approaches. However, the un-derlying mathematical models may not be clearly indicated. For example, Nasser and Birst [28] describe a case study for the modeling the evacuation of a small city using DYNA-SMART software. DYNA-SMART employs mathematical programming with a traffic simulator to produce traffic flow projections.
Two software-specific references were identified that dealt explicitly with the prob-lem of contraflow for evacuation. Chen [30] utilized the Census Transportation Plan-ning Package (CTPP), Version 2000, to estimate the evacuation demand for Washing-ton D.C. Contraflow was applied to some of the routes exiting the city. Pal et al. [31] applied the Oak Ridge Evacuation Modeling System (OREMS), in concert with the ArcView geographical information system (GIS) software package, to evaluate traffic conditions resulting from evacuation from Baldwin and Mobile counties in Alabama. OREMS is a probabilistic traffic simulation tool. It consists of a pre-processor for data input, a simulation model, and a post-processor that is linked to the GIS for the results output and simulation. This approach is further detailed by Pal [32].
twenty entry ramps along I-65. These data were obtained with the help of the Alabama Department of Transportation, and the Alabama Demographics Center. In the primary model, entering vehicles are created through a controlled wait-and-signal mechanism. Attributes such as time of arrival, final destination exit, and accident incident prone-ness are established at this level. These attributes are assigned based on cumulative probability distributions generated by empirical data collected during the data acquisi-tion phase of the project. Addiacquisi-tionally, a maximum batch number of entering vehicles at each entry ramp was set based on the total amount people residing in the communi-ties close to the corresponding ramp, and the pre-established evacuation ratio. This evacuation ratio is an estimate of the fraction of the population exiting from a particu-lar area as determined by ALDOT officials.
4. Design of the Demand Module
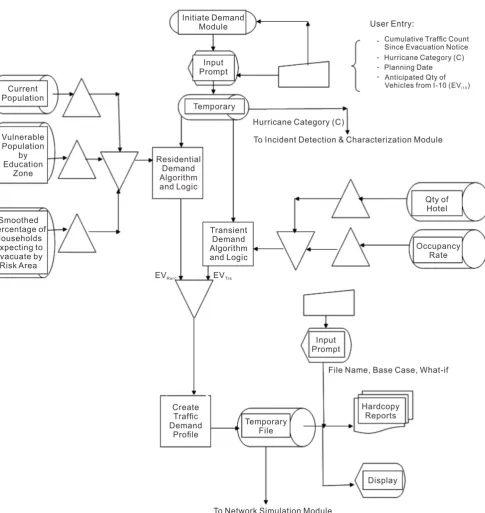
Selection of a suitable evacuation demand model was requisite to support the needs of the Alabama Department of Transportation Maintenance Bureau regarding contraflow pre-planning and evaluating possible responses to a hurricane event. Beyond the ade-quacy of the demand model itself, the necessary supporting data must also be available. As noted by Nasser and Birst [28], “a limitation in evacuation models is that they are focused on developing new traffic flow models while few of them considered the back-ground data and behavior aspects analysis. Ignoring the human behavior aspects when modeling emergency evacuation could lead to underestimating ETEs” (evacuation time estimates).” Distinct advantages of the simple deterministic models portrayed by Lin-dell and Prater [14] are that the authors identify the principal behavioral variables af-fecting hurricane ETEs, and describe the available empirical data relevant to evacuation demand modeling. Further analysis noted that observed data in the Alabama Hurricane Evacuation Study [15] mapped well to the Lindell and Prater approach, and could be used to better finetune it to the needs of the Alabama DOT. A flow diagram of the re-sulting module design is provided in Figure 3.
4.1. Input Specifications
Figure 3. Evacuation demand module flow diagram.
Population data for each of these counties can be accessed from a table [16], which links to individual evacuation risk area. This table was based on Year 2000 population figures. Within the demand module, the number of households must be adjusted for DRrc, the proportion of residential households in Risk Area r deciding to evacuate in Hurricane Category c. This data was obtained from [14].
Tran-sient population (e.g. tourists and “beach-goers”) are also a sizeable consideration for evacuation during hurricane season. There are approximately 10,000 hotel rooms in the Mobile Bay area (i.e. Mobile and Baldwin Counties). Other input data, to support the calculation of transient population impact on the evacuation demand, is provided by monthly occupancy hotel occupancy rates was generated by researchers at the Univer-sity of South Alabama [34], and is the most recent year that this data was compiled. The system will use the 68.43 percent occupancy rate for the peak summer months that correspond with hurricane season.
4.2. Processing Specifications
The processing details of the underlying algorithmic models, with their associated cal-culations, are discussed in this section. Processing with the Evacuation Demand Mod-ule follows the approach discussed in detail by [14].
-Total Demand = EVRsrc +EVTrs +EVI 10 (1)
where:
EVRsrc is the number of residential vehicles evacuating from Sector s of Risk Area r during Hurricane Category c, and EVTrs is the corresponding number of evacuating vehicles for transients. EVI-10 is the anticipated number of vehicles expected to merge onto I-65 from I-10 (I-10 is a major interstate route along the northern Gulf Coast, and could bring significant levels of additional traffic from either New Orleans to the west or the Florida panhandle to the east).
In these variables, subscript R denotes residential vehicles, and subscript T denotes vehicles for transients (e.g. occupants of hotels, condominiums, and rental houses in beach areas). Hurricane Category c is determined from weather reports at the time of analysis, and can be entered via the initial Demand Module Input Screen. Sector s is specific population center within Risk Area r.
As noted by Lindell and Prater [14], EVRrsc then can be estimated by:
(
)
(
-)(
)(
-)
EVRrsc = PopRrsc PHHR DRrc 1 TDR EVHHR +ETHHR 1 Sr URrs (2)
where:
PopRrs = residential population of Sector s in Risk Area r and PHHR = number of persons per residential household, both of which can be estimated from 2010 census data. The household is the critical unit in evacuation, so demand should be based on this unit of analysis (the first term in parentheses). For Mobile County: PopRrs = 412,992 and PHHR = 2.55, and for Baldwin County: PopRrs = 182,265 and PHHR = 2.49. To account for 2010 population figures, for each category of evacuation zone:
(
)
(
)
-Evacuation Factor
2000 Portion of Mobile + Non Mobile Home Population Evacuating
= 2000 Mobile Home + Non Mobile Home Populations (3)
and
-Revised &
County Resid Non Mobile Mobi
ential Popula le Home Pop
tion *Evacua ul
ti ati
on on
The number of households must be adjusted for DRrc, the proportion of residential households in Risk Area r deciding to evacuate in Hurricane Category c (i.e., com-pliance and spontaneous evacuation). EVHHR, the average number of vehicles taken by each household during evacuation, and ETHHR, the number of trailers taken by each residential household, to generate the number of evacuating vehicles from residential households. For EVHHR, use “the number of vehicles per evacuating household ranged from 1.16 to 1.36”, as noted in the Behavioral Studies section in U.S. Army Corp of En-gineers [15]. For ETHHR, the same study noted “few evacuees pulled trailers or took motor homes. In Bay County, 7.5 percent took such vehicles, and in Okaloosa/Walton, only 2.5 percent did so. A five percent rate is the lowest which should be used for plan-ning” [16]. According to Lindell and Prater [18], analysts should also adjust for the number of evacuating households downward for the proportion of transit dependent residential households, TDR, but recognize that census data will overestimate the number who will need to be evacuated by bus. In the Alabama Hurricane Evacuation Study Be-havioral Studies section [15], TDR would translate to 6 percent and was generally pro-vided by relatives and families. Further, this behavioral study indicated, “One other factor is also clear: very few evacuees (less than 20 percent) leave before officials issue an evacuation notice.” It was noted that for Hurricane Opal, this value was found to be 10 percent. This value can be used for Sr in the equation for EVRrsc.
Lindell et al. [35] found that the residents’ expectations of using designated evacua-tion routes ranged from a low of 9 percent to a high of 37 percent. All of these uncer-tainties underscore the need to conduct sensitivity analyses to produce plausible error bounds around point estimates of ETEs. Per subsequent discussion with research team members, the underlying model has been modified to provide the total number of eva-cuating vehicles/day. The original model considered the variable “U” to relate to the use of the designated evacuation route (here I-65). It thus constrains the output number of evacuating vehicles. In order to better coordinate functionality with the downstream network simulation module, U would initially equal 1.0 in the model, thus yielding the total number of evacuating vehicles from the area. This will allow the network simula-tion module to conduct the subsequent routing to I-65.
Again, as noted by Lindell and Prater [14], the corresponding estimate of the number of evacuating vehicles for transients (EVTrs) should be computed by:
(
-)
EVTrs = HRrsOR 1 Sr UT. (5)
propor-tion of early evacuees among the transients, or UT, the proporpropor-tion of transients who use the primary evacuation routes.
However, ST is almost certain to be higher than SR because transients have fewer reasons to remain in the risk area when a storm approaches. UT is likely to be very close to 1.0 because transients are likely to know very little about unofficial evacuation routes. Of course, if ST is high (most transients leave early), the value of UT will make little difference in the ETEs.” EVI-10 would be obtained either as a value in what-if analysis for planning purposes, or as an observed value of traffic on I-10 in the event of an actual hurricane, and entered via the module input screen noted in Figure 3 flow diagram.
4.3. Use of the Model to Create a Traffic Demand Profile
During the period prior to the hurricane’s landfall, ALDOT personnel will need to create a traffic demand profile to assist in their planning responsibilities. The level of demand will change as progressively more people evacuate from their respective zones. The initial concept to address this issue is to modify SR. Prior to the official evacuation notice. SR = 10 percent based on the previously referenced Alabama Hurricane Evacua-tion Study by the Army Corps of Engineers [16]. After the official evacuation notice is issued:
[
]
Revised SR
= .10+ Cumulative Traffic Count Since Evacuation Notice Total Expected (6) where:
.10 = Portion of early evacuees in decimal form and Cumulative Traffic Count since Evacuation Notice is based on ALDOT observation or traffic recorder data.
(
)
(
)
(
)
(
)
-× × ×
Total Expected = 2010 PopRS PHH DRrC 1 TDR
EVHH+ETHH URrs + HRrs OR UT . (7) Total Expected evacuation traffic includes components for both residents and tran-sients. The transient ST factor is conservatively assumed to be equal to SR in this case. The demand model employing the revised SR factor is expected to be updated on a dai-ly basis to create the traffic profile for each day up to hurricane landfall.
4.4. Further Refinements
Subsequent discussion with ALDOT indicated that a hurricane landfall to the east of Alabama would have considerable impact on the evacuation traffic using I-65, while a landfall to the west does not have a significant effect. In view of this, 𝐸𝐸𝑉𝑉𝐼𝐼−10 from the
get onto I-65 through AL-106, rather than going all the way west along I-10 and then travel northeast along I-65. ALDOT experience confirmed that Exit 69 (AL-113) and Exit 114 (AL-106) are two major interchanges to experience high traffic arrival rates during past hurricane evacuation events. Therefore, it was determined that evacuation demand from the Florida panhandle (when hurricane landfall is to the east of Alabama) should be treated in a similar manner as evacuation demand from Alabama.
A demand profile describes the cumulative percentage of departed evacuating popu-lation as a function of time. The initial equations, however, did not adequately describe when the remaining evacuation demand would depart. A range of cumulative departure curves have been proposed in the literature (e.g. [14]) to model evacuation departure time distribution. Upon further analysis, the Rayleigh distribution (Equation (8)) was adopted as the base demand loading profile. This is because the shape of the distribu-tion funcdistribu-tion is a desired sigmoid curve; the funcdistribu-tion is easier to calibrate as it only has one parameter β; and various studies have adopted this distribution and calibrated it against empirical data [14].
( )
2 1 exp 0.5t t
p = − − β (8)
Note that the reference time in this base model is the issue time of an official evacua-tion order [14]. It is also worth noting that the base model does not consider night-time evacuation behavior, and is appropriate only for day-time evacuation. However, it has been observed from historical hurricane events that the evacuation demand during the night is usually low, even in the case of large, intense storms [15]. Based on empirical data of evacuation response rates during Hurricane Opal in 1995 [36], this study as-sumes that the average evacuation rate is 2 percent per hour during nighttime (12AM - 5AM). Based on this assumption, the base evacuation demand profile will be adjusted according to the issue time of the official evacuation order.
5. Development of the Spreadsheet Prototype
5.1. Impact Areas Considered
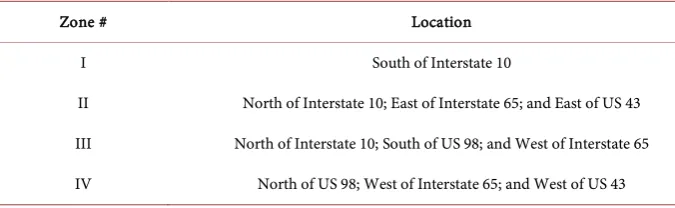
While all of the Alabama counties south of Montgomery have hurricane mitigation plans, this study will only focus on Mobile and Baldwin, the two coastal counties of Al-abama. Four Florida panhandle counties are also considered based on ALDOT’s pre-vious experiences that a hurricane landfall to the east of Alabama will lead to a limited demand increase for I-65. The four Florida counties considered are: Escambia, Santa Rosa, Okaloosa, and Walton. Evacuation zones are established for each of the six coun-ties by the emergency management agency in their respective state. The zones are gen-erally a relatively large area including multiple cities, small towns, and rural districts. The zones for Mobile and Baldwin counties are established by Alabama Emergency Management Agency [37], and indicated in Table 1. Detailed maps of these zones may be viewed at the website provided by the Mobile Emergency Management Agency [38]. The evacuation zones established by the Florida Emergency Management Agency are based on coastal storm surge levels [39].
Before Equation (4) could be utilized to generate a demand profile, the parameter β needed to be calibrated. Historical traffic counts at MP42 on I-65 during past hur-ricanes were available from ALDOT, and used for this calibration. Some of the hurri-canes, represented in the ALDOT database, are of low intensity (e.g. Tropical Storm Arlene, Hurricane Dennis, Hurricane Gustav, and Hurricane Ike), and some have landfall locations far away from Alabama (e.g. Katrina). Due to these reasons, those hurricanes events are not ideal candidates for calibration. Their data were eliminated from the ca-libration test set. Hurricane Ivan landed just west of Gulf Shores, Alabama as Category 3 hurricane, which made it the best candidate for calibration use. The official evacua-tion order was issued at 9:00 am on September 14. The hurricane category and official evacuation time provide inputs to the demand models. A simulation program, devel-oped by this research team, was develdevel-oped to calibrate the parameter of interest. The simulation was able to output hourly traffic counts at any milepost within the study site. The calibration was conducted by comparing the simulation outputs with the real traffic counts at MP42 [40].
[image:15.595.195.533.605.709.2]Since URrs is also unknown, various combinations of URrs and β were tested. Values of other parameters and inputs of the demand models were set as described in the pre-vious subsection. The mean squared error (MSE) was adopted as the performance measure for calibration. In other words, a set of URrs and β with the smallest MSE is
Table 1. Evacuation zone locations.
Zone # Location
I South of Interstate 10
II North of Interstate 10; East of Interstate 65; and East of US 43
III North of Interstate 10; South of US 98; and West of Interstate 65
considered the best calibrated results. After extensive calibration efforts, it was deter-mined that aURrs of 15 percent and a β of 400 are the best calibrated values for Hurri-cane Ivan. This was interpreted as the majority of residents, being familiar with the lo-cal roadways, actually utilized informal routes as opposed to the designated I-65. With this set of values, the simulated traffic condition at MP42 is comparable to real traffic data. It also validates that the recommended demand loading profile is suitable for a real hurricane evacuation event. Since parameter β governs the shape of the demand loading curve and is independent from the total demand (controlled by hurricane cat-egory and URrs), the value of 400 will be used for β in the formal development of the Network Simulation Module.
It is assumed that all evacuees from the same Census tract (the traffic analysis unit in this study) will use the same route to access I-65. The travel time from a tract to a par-ticular exit of I-65 is calculated using the distance from the center of the tract to the exit and the free flow speed on the major feeder routes. Most major feeder routes only lead to one I-65 exit. Approaching evacuation traffic was be assigned to the route with the shortest instantaneous travel time.
5.2. Demand Scenarios
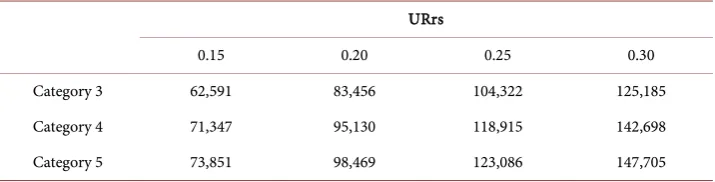
Total evacuation demand for I-65 is adjusted by varying hurricane category, percentage of the total evacuation demand using I-65 (URrs in Equation (2)), and location of land-fall (whether I-65 will receive evacuation demand from Florida or not). During model calibration against real traffic data from Hurricane Ivan, a hurricane of Category 3 with a landfall in Alabama, it was determined URrs of 15 percent leads to the best calibration result. The simulation results indicate that the traffic is not particularly heavy under this scenario, and contraflow operation is not necessary as the study site is not very congested. Therefore, all the testing scenarios generated are of Category 3 and above. Similarly, 15 percent was chosen as the starting value of URrs for each hurricane cat-egory. Four values of URrs (15, 20, 25, and 30 percent) were used to generate demand scenarios. This was based on observation during pre-testing that a 5 percent increment leads to a desirable demand increase. In addition, pre-testing also revealed that aURrs of more than 30 percent will result in severe network-wide congestion that lasts for more than two days even with contraflow operating at all times. With three hurricane categories (Category 3 - Category 5), four values of URrs, and two possible landfall lo-cations (in AL or in FL), twenty-four demand scenarios were generated. Table 2 pro-vides sample output with consideration of Florida demand.
Table 2. Sample demand levels generated.
URrs
0.15 0.20 0.25 0.30
Category 3 62,591 83,456 104,322 125,185
Category 4 71,347 95,130 118,915 142,698
Category 5 73,851 98,469 123,086 147,705
and Mobile counties only. The suffix of FL indicates the demand from Florida is in-cluded. Take C3M9U015FL for instance, demand from Escambia, Okaloosa, Santa Ro-sa, and Walton counties is loaded in addition to demand from the two Alabama coun-ties.
6. Conclusions
For this research project, the University of Alabama (UA) researchers developed an al-gorithmic methodology to be utilized for hurricane evacuation demand forecasting by the Alabama Department of Transportation during contraflow planning. Analysis of available data helped determine the specific model needed. The algorithmic methodol-ogy, initially developed by Lindell and Prater [14] was modified and adapted to the available data obtained from the U.S. Army Corps of Engineers studies [15][16][36].
The resulting Demand Module consists of three sets of models for estimating the to-tal evacuation demand, the demand profile (temporal distribution of the demand), and the traffic distribution among multiple feeder routes to the I-65 contraflow section (spatial distribution of the demand), respectively. Relevant data were collected from the Census database and reasonable assumptions were made. The models were calibrated against traffic data collected during Hurricane Ivan in 2004. The Demand Module is able to generate various demand scenarios, to account for low departure rate during night, and to incorporate considerations of feeder route choices [13].
Extensive analysis was then performed to determine conditions that warrant a con-traflow operation, and the best onset and duration of such operation when it is neces-sary. The analysis was performed using a prototype spreadsheet tool that implements the modeling framework developed in this project. With each setting, two baseline contraflow schedules (i.e. no contraflow and full-time contraflow) were simulated in-itially. If the difference between the two schedules is higher than a pre-specified thre-shold (15 percent in this study), multiple contraflow scheduling solutions will further analyzed according to an evaluation logic and a near-optimal scheduling solution will be identified. Otherwise, contraflow is deemed not necessary. Alternative contraflow strategies and the impact of incidents are further investigated through paired compari-son.
paper), an Incident Generation and Characterization Module, and a Network Simula-tion Module. The design of the other modules is currently underway. Their subsequent programming, integration and test will be conducted during a planned follow-on project. This initiative will provide ALDOT traffic officials with relevant insights and expertise to forecast, detect and characterize traffic situations that may drastically impair evacua-tion responses during a potential natural disaster.
References
[1] Gerdes, B. (2007) 16 Percent of Alabamians Live in Hurricane Counties, According to UA’s State Data Center, NOAA. The University of Alabama News.
http://uanews.ua.edu/anews2007/jun07/counties061307.htm
[2] Louisiana Governor’s Office of Homeland Security & Emergency Preparedness (2011) Offi-cial Louisiana Hurricane Survival Guide.
[3] Mississippi Department of Transportation (2012) Contraflow Plan for Interstate Hurricane Evacuation Traffic Control.
http://sp.mdot.ms.gov/Enforcement/Emergency%20Services/Emergency%20Preparedness/ Contraflow/Contraflow%20Plan.pdf
[4] Government of the State of Texas (2012) Evacuating to Safety.
http://emergency.portal.texas.gov/en/Pages/Evacuating-to-Safety.aspx
[5] Texas Department of Transportation (2012) Hurricane Evacuation Contraflow Publica-tions. http://www.dot.state.tx.us/travel/contraflow_publications.htm
[6] Fonseca, D.J., Moynihan, G.P., Johnston, J. and Jennings, J. (2010) A Simulation Tool for Hurricane Evacuation Planning. Modelling and Simulation in Engineering, 2009, Article ID: 729570.
[7] Alabama Department of Transportation (2010) I-65 Contra-Flow Plan: 2010 Hurricane Season. http://ema.alabama.gov/GSHC%20-ALDOT%20Contraflow%20201
[8] Alabama Department of Transportation (2008) Plan for Reverse-Laning Interstate I-65 in Alabama for Hurrican Evacuation. http://www.dot.state.al.us/maweb/reverse_laning [9] Wolshon, B. (2001) “One-Way-Out”: Contraflow Freeway Operation for Hurricane
Evacu-ation. Natural Hazards Review, 2, 105-112.
http://dx.doi.org/10.1061/(ASCE)1527-6988(2001)2:3(105)
[10] Turban, E. and Aronson, J. (2001) Decision Support Systems and Intelligent Systems. Pren-tice Hall, Upper Saddle River.
[11] Hillier, F. and Lieberman, G. (2004) Introduction to Operations Research. 8th Edition, McGraw-Hill, New York.
[12] Fonseca, D.J., Lou, Y., Moynihan, G.P. and Gurupackiam, S. (2013) Incident Occurrence Modeling during Hurricane Evacuation Events: The Case of Alabama’s I-65 Corridor.
Modelling and Simulation in Engineering, 2013, Article ID: 168126.
http://dx.doi.org/10.1155/2013/168126
[13] Lou, Y., Li, P., Fonseca, D.J., Moynihan, G.P. and Gurupackiam, S. (2014) Scheduling of Contraflow Evacuation: A Case Study of I-65 in Alabama. Journal of Transportation Engi-neering, Manuscript Currently under Review.
[14] Lindell, M.K. and Prater, C.S. (2007) Critical Behavioral Assumptions in Evacuation Time Estimate Analyses for Private Vehicles: Examples from Hurricane Research and Planning.
http://dx.doi.org/10.1061/(ASCE)0733-9488(2007)133:1(18)
[15] US Army Corps of Engineers (2001) Alabama Hurricane Evacuation Study—Summary Re-port. http://chps.sam.usace.army.mil/USHESdata/Alabama/ALmainreport.htm
[16] US Army Corps of Engineers (2001) Alabama Hurricane Evacuation Study—Transporta- tion Study. http://chps.sam.usace.army.mil/USHESDATA/Alabama/altranspage.htm [17] Federal Highway Administration (2003) Best Practices for Road Weather Management.
http://ops.fhwa.dot.gov/weather/best_practices/CaseStudiesFINALv2-RPT.pdf
[18] Georgia Department of Transportation (2005) Georgia DOT Hurricane Preparedness and Response 2005. http://www.itsga.org/Knowledgebase/GA%20hurrevac%2007282005.pdf [19] National Oceanic and Atmospheric Administration (2011) Hurricane Planning and
Evacu-ation Assessment Reports. http://www.csc.noaa.gov/hes/hes.html
[20] LeBlanc, I.J. (1975) An Algorithm for the Discrete Network Design Problem. Transporta-tion Science, 9, 183-199. http://dx.doi.org/10.1287/trsc.9.3.183
[21] Magnanti, T.L. and Wong, R.T. (1984) Network Designs and Transportation Planning: Models and Algorithms. Transportation Science, 18, 1-55.
http://dx.doi.org/10.1287/trsc.18.1.1
[22] Yang, H. and Bell, M.G.H. (1998) Models and Algorithms for Road Network Design: A Re-view and Some New Developments. Transportation Reviews, 18, 257-278.
http://dx.doi.org/10.1080/01441649808717016
[23] Solanski, R.S., Gorti, J.K. and Southworth, F. (1998) Using Decomposition in Large-Scale Highway Network Design with a Quasi-Optimization Heuristic. Transportation Research Part B, 33, 127-140. http://dx.doi.org/10.1016/S0191-2615(97)00020-9
[24] Tanaka, K. (2007) Traffic Mixing in Deterministic Two-Lane Model of Hurricane Evacua-tion. Physica A: Statistical Mechanics and Its Applications, 380, 490-502.
http://dx.doi.org/10.1016/j.physa.2007.02.068
[25] Abdelgawad, H. and Abdulhai, B. (2010) Managing Large-Scale Multimodal Emergency Evacuations. Journal of Transportation Safety & Security, 2, 122-151.
http://dx.doi.org/10.1080/19439962.2010.487636
[26] Wilmot, C. and Mei, B. (2004) Comparison of Alternative Trip Generation Models for Hurricane Evacuation. Natural Hazards Review, 5, 170-178.
http://dx.doi.org/10.1061/(ASCE)1527-6988(2004)5:4(170)
[27] Fu, H. and Wilmot, C. (2004) A Sequential Logit Dynamic Travel Demand Model. Pro-ceedings of the TRB Annual Meeting, Washington, DC, January 2004.
http://www.ltrc.lsu.edu/pdf/TRB2004-000960.pdf
[28] Nasser, M. and Birst, S. (2010) Mesoscopic Evacuation Modeling for Small- to Medium- Sized Metropolitan Areas. Report to the Advanced Traffic Analysis Center, Upper Great Plains Transportation Institute, North Datoka State University, Fargo.
http://www.mountain-plains.org/pubs/pdf/MPC10-222.pdf
[29] Tanaka, K. (2007) Traffic Congestions and Dispersion in Hurricane Evacuation. Physica A:
Statistical Mechanics and Its Applications, 376, 617-627.
http://dx.doi.org/10.1016/j.physa.2006.10.023
[30] Chen, M. (2005) Traffic Signal Timing for Urban Evacuation. Master’s Thesis, Department of Civil Engineering, the University of Maryland, College Park.
http://drum.lib.umd.edu/bitstream/1903/2951/1/umi-umd-2744.pdf
Alabama Transportation Center.
[32] Pal, A. (2008) Emergency Evacuation Modeling Based on Geographical Information Sys-tem. Thesis Manuscript, Department of Civil Engineering, University of Alabama, Tusca-loosa.
[33] Sisiopiku, V. (2007) Development of Dynamic Traffic Assignment Model to Evaluate Lane Reversal Plans for I-65. UAB School of Engineering.
http://main.uab.edu/soeng/Templates/Inner.aspx?pid=98705,2007 [34] University of South Alabama (2003) Mobile Metro Database.
www.southalabama.edu/mcob/cber/DB-home.htm
[35] Lindell, M.K., Lu, J.C. and Prater, C.S. (2005) Household Decision Making and Evacuation in Response to Hurricane Lili. Natural Hazards Review, 6, 171-179.
http://dx.doi.org/10.1061/(ASCE)1527-6988(2005)6:4(171)
[36] US Army Corps of Engineering (1996) Alabama Hurricane Evacuation Study Technical Data Report: Behavioral Analysis.
[37] Alabama Emergency Management Agency (2011) Hurricane Categories and Hurricane Evacuation Zones. Mobile County Emergency Management Agency.
[38] Mobile County Emergency Management Agency (2014) Hurricane Evacuation Zones.
http://www.mcema.net/EvacuationProcedures/HurricaneEvacuationZones.aspx
[39] Florida Department of Transportation (2005) Contraflow Plan for the Florida Intrastate Highway System.
http://www.dot.state.fl.us/trafficoperations/Traf_Incident/pdf/050808_FIHS-Contraflow-M ASTER.pdf
[40] Alabama Department of Transportation (2011) Contraflow Event Log 2004-2010.
Submit or recommend next manuscript to SCIRP and we will provide best service for you:
Accepting pre-submission inquiries through Email, Facebook, LinkedIn, Twitter, etc. A wide selection of journals (inclusive of 9 subjects, more than 200 journals)
Providing 24-hour high-quality service User-friendly online submission system Fair and swift peer-review system
Efficient typesetting and proofreading procedure
Display of the result of downloads and visits, as well as the number of cited articles Maximum dissemination of your research work