comment
reviews
reports
deposited research
interactions
information
refereed research
Minireview
Mining mouse microarray data
Dennis A Wigle*
§
, Janet Rossant*
§
and Igor Jurisica
¶
Addresses: Departments of *Medical Genetics and Microbiology, Surgery, and Computer Science, University of Toronto, Toronto, Ontario,
M5S 1A8, Canada. §Samuel Lunenfeld Research Institute, Mount Sinai Hospital, 600 University Avenue, Toronto, Ontario, M5G 2X2,
Canada. ¶Division of Cancer Informatics, Princess Margaret Hospital, 610 University Avenue, Toronto, Ontario, M5G 2M9, Canada.
Correspondence: Dennis A Wigle. E-mail: [email protected]
Abstract
Microarrays of mouse genes are now available from several sources, and they have so far given new insights into gene expression in embryonic development, regions of the brain and during apoptosis. Microarray data posted on the internet can be reanalyzed to study a range of questions.
Published: 3 July 2001
GenomeBiology2001, 2(7):reviews1019.1–1019.4
The electronic version of this article is the complete one and can be found online at http://genomebiology.com/2001/2/7/reviews/1019 © BioMed Central Ltd (Print ISSN 1465-6906; Online ISSN 1465-6914)
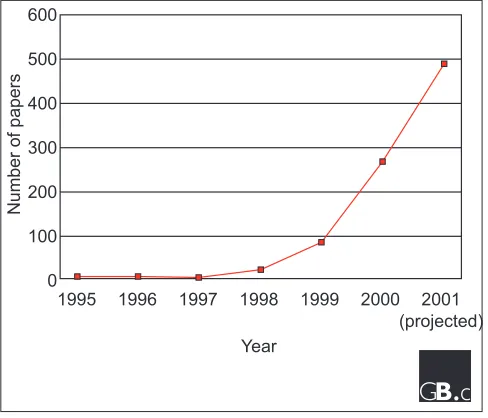
Most articles on microarray technology, particularly reviews, begin with some over-reaching statement on their potential to illuminate the biological world. While resisting this temp-tation, we must acknowledge the increasing power of high-throughput expression profiling using high-density arrays. A quick Medline search of all papers referenced with the term microarray shows an exponential increase since the first paper describing the approach by Pat Browns group six years ago [1] (Figure 1). A calculated projection based on the number of papers this year to date predicts a total of around 500 microarray publications for 2001. The technology is quickly becoming a mainstay in the array of tools available to the molecular biologist, and we expect it to be broadly applicable to our favorite genetically tractable organism, the laboratory mouse.
Available arrays and clone sets
The production of mouse microarrays has lagged somewhat behind the production of arrays from humans and from those model organisms for which full genome sequence is available, such as yeast or Caenorhabditis elegans. Oligonucleotide-based arrays from sources such as Affymetrix (Santa Clara, CA, USA) have been in production for a number of years, but their high cost has been a barrier to widespread general use in academia. The cDNA array effort has been hampered largely by the scarcity of large, well-annotated cDNA clone sets from mouse tissues. Fortunately, a number of recent publications have addressed this issue. Minoru Ko at the
[image:1.609.312.556.481.690.2]National Institute on Aging (NIA; National Institutes of Health, Bethesda, MD, USA) has developed a 15,247 clone set derived from mice largely at early developmental time points, with libraries covering stages from the early blasto-cyst to embryonic day (E) 7.5 (for which there are embryo
Figure 1
Plot of total microarray articles indexed in Medline. The total for 2001 is projected from the total number of publications to date this year.
600
1995 1996
Number
of
papers
1997 1998
Year
1999 2000 2001 (projected) 500
400
300
200
100
and ectoplacental cone samples) [2]. This set will have added to it later this year a further 11,000 clones derived from sequencing of similar libraries, and libraries from tro-phoblast stem cells, hematopoietic stem cells, embryonic stem cell line R1, newborn heart, brain, and kidney, and mesenchymal stem cells (M.S. Ko, personal communica-tion). The set has been sequence-verified [3] and is cloned into a vector system with binding sites for both SP6 and T7 polymerases flanking the insert, so that riboprobes for in situ hybridization studies can be generated directly. The average insert size is estimated to be roughly 1.5 kilobases (and we have found this generally to be the case). The clone set has been widely distributed to a number of centers for microarray printing, including our own local facility at the Ontario Cancer Institute [4]; these centers are currently in various stages of production [5].
The RIKEN Institute in Japan has also recently described a 21,076 cDNA clone set thought to represent at least 12,890 unique genes, which was generated from sequencing just under one million total expressed sequence tags (ESTs) [6,7]. This group of clones has the major advantage that more than 60% are full-length cDNAs, because of the methods used in library construction. Also, these clones are derived from a broad spectrum of adult and developmental stages of various tissues, which provides a nice complement to the much earlier stages used to derive cDNA libraries for the NIA 15,247 clone set. A quick analysis indicates that there are at least 26,700 non-redundant clones between the two sets. Although arrays have been generated from these clones by RIKEN (see below), they have not yet been made widely available to the scientific community. As a result, we will probably see more work initially in the literature that uses microarrays printed from the NIA set in combination with custom-derived clones.
Arguably the most comprehensive mouse arrays available are the Murine Genome U74 Set from Affymetrix. This group of three arrays provides coverage of roughly 36,000 mouse genes, of which about 30,000 are known only as ESTs. As mentioned previously, however, there has not been wide-spread use of these arrays because of the prohibitively high cost of the arrays and the associated scanning hardware. But given the advantages of oligonucleotide-based arrays for interrogating multiple regions of a transcript or alternatively spliced forms, in addition to their flexibility for array design, we expect the adoption of this platform for array technology to increase in the future. Operon Technologies (Alameda, CA, USA) has recently introduced a mouse 7,000 oligonu-cleotide set that is available for purchase for array printing; the size of this and similar sets is likely to increase substan-tially in the near future.
In general, given the advances in size and availability of sets of mouse cDNA clones and oligonucleotides, we foresee an increase in the number of centers making the initial
investment to start microarray facilities and capitalize on this technology. Printing cDNAs has the advantage of repli-cating directly the microarrays printed elsewhere, although it does have the disadvantage of laborious amplification of cDNA inserts for printing and difficulties in managing a large number of clones. Oligonucleotide arrays eliminate some of these problems and offer a number of flexibility advantages in array printing, but they come with higher initial start-up costs. Although we are moving in the direc-tion of a whole-genome microarray as we approach the completion of the mouse genome-sequencing project, it is likely that many groups will focus on smaller, custom, gene groupings to reduce both costs and the engineering difficul-ties associated with printing arrays of higher density.
Coping with data deluge
Although to date only a small number of mouse microarray studies have been published in the literature, we expect a tidal wave of papers over the next two to three years as this technology becomes widely available. Minoru Kos group has described experiments using nylon arrays printed from their NIA 15,247 clone set. In profiling comparisons of E12.5 pla-centa and whole embryos, they identified 720 genes that appeared (statistically, from triplicate measurements) to be upregulated in the placenta [8]. Of these, 181 were repre-sented by novel ESTs not previously known to be placentally enriched, increasing the total number of genes known to be highly expressed in the placenta by about five-fold. The pla-centa-specific expression pattern was confirmed for one of these novel genes (H3018B06) by in situ hybridization; homology searches suggest that it could be a novel member of the placental growth-related hormone family.
comment reviews reports deposited research interactions information
refereed research
pathway, tissue-specific differences were identified in gene products for glycolytic enzymes derived from muscle versus those present in liver and kidney [9].
Using the Affymetrix system, Zirlinger et al. [11] have recently analyzed differential gene expression in selected regions of the brain using arrays containing approximately 34,000 genes. They screened by in situhybridization a series of 33 genes identified to be amygdala-enriched from array experiments and found that a number of them had expres-sion patterns restricted to the subnuclei of the amygdala. Using the earlier Mu11K array, containing 11,000 gene ele-ments, Voehringer et al.[12] demonstrated a series of alter-ations in gene expression in apoptosis-sensitive compared with apoptosis-resistant B-cell lymphoma cell lines before and after irradiation. From these observations, they sug-gested a model for sensitivity to apoptosis involving induc-tion of transcripts for genes participating in mitochondrial uncoupling and loss of membrane potential.
One of the major stumbling blocks for new users is the pro-cessing and management of data once microarray hybridiza-tion has been done. The number of both freely available and commercial packages that are user-friendly for performing these functions is rapidly increasing. At our institute, we use a combination of the commercial Quantarray (Packard BioChip Technologies, Billerica, MA, USA) and GenePix (Axon Instruments, Union City, CA, USA) packages to find spots and assign grayscale hybridization intensities. We then use a package developed locally [13] to handle background subtractions and normalizations and to create databases of cumulative experiments for clustering. These are certainly not the only tools available, nor are they necessarily the best, and we anticipate more user-friendly packages for these func-tions to arrive shortly, given the flurry of activity in the area. What is not yet clear is how best to sort through the data from
15 10 5 0 −5 10 5
Neonatal day 0 lung Adult lung
E16 lung 0 −5 10
Neonatal day 0 lung Adult lung E16 lung Adult liver Adult small intestine Adult colon Adult cecum Adult pancreas Adult stomach Intestine neonatal day 10 E13 liver E13 E10 E11 E14 liver 120 100
0 200 400 600 800 1,000 1,200
1,400 80 60 40 Genes Clones Expression level Expression 20 0 5 12 10 8 6 4 2 0 −2 −4 −6 0 −5 −10
1200016O23 Myosin 1b
1200013H10 Surfactant-associated protein A 2310050I12 EST
1200020O07 EST 1200020H04 EST 1200016D23 EST
2610002F13 EST
2310074I04 Sortilin-related receptor
2310081O03 EST 2310005K04 EST 2310045F01 EST 2210403I19 EST 2310065A22 EST
−10 fold +10 fold
Expression vs. reference RNA
(i)
(ii)
E10 E11 E13 E18
[image:3.609.56.296.78.741.2]lung Neonatal day 0 lung Adult lung
(a)
(b)
(c)
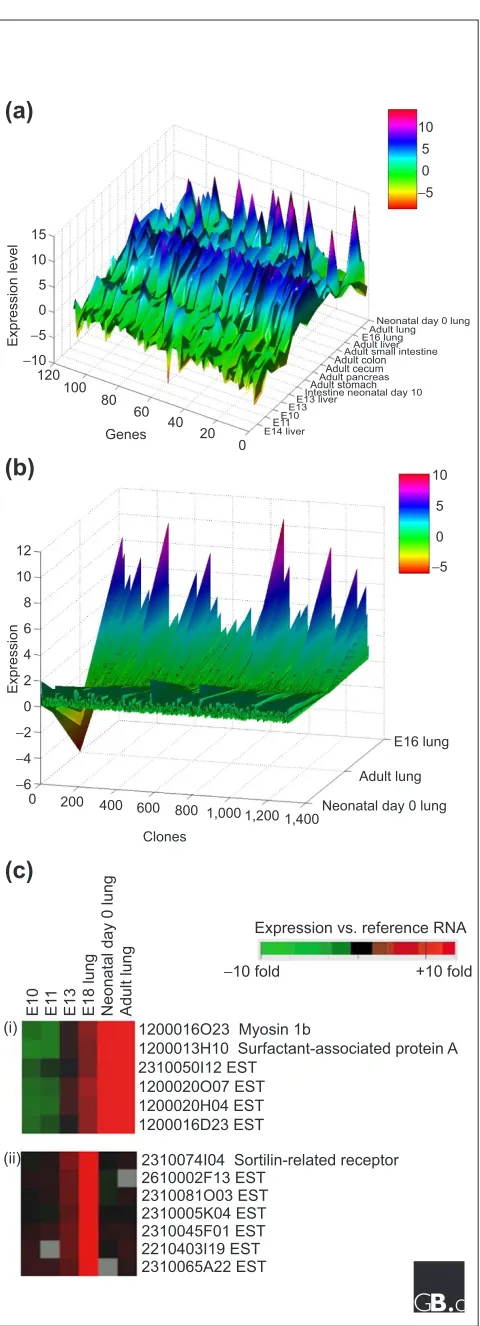
Figure 2validated experiments once one has identified groups of genes that are of interest to the individual investigator.
The power of freely distributed raw data
One of the big benefits of the freely distributed array data accumulating on the web is the ability to do a greater amount of complex experimental work at the computer, as opposed to the wet-lab bench. There are far too many obser-vations in any large-scale microarray study to comment on all of them in the text of a journal article, and the emerging practice of requiring authors to post data on a website allows other investigators to examine portions of the data relevant to their individual interests. For example, as part of an ongoing project examining lung organogenesis, we have downloaded the RIKEN gene expression database [7] and performed some further analysis on the gut-endoderm-derived tissues in the dataset. This was done over a period of days using both commercial and freely available software on a standard desktop computer. As shown in Figure 2a, a topography plot of a statistically selected subset of 113 genes in these tissues reveals a number of unique expression pat-terns. We identified peaks in the plot from embryonic lung stages corresponding to a number of ESTs, including one with homology to the Ras-related protein Rab2. Further analysis of the lung developmental time points demon-strated a number of unique findings. The blade diagram in Figure 2b shows the enhanced expression in the embryonic lung of a series of genes compared with adult lung tissue. This group includes a total of 782 ESTs of unknown func-tion. Using conventional Eisen clustering [10] (Figure 2c), we found groupings associated with known lung-enriched proteins such as surfactant protein A, in addition to a number of genes that appeared to be enriched at the E16 time point compared with the other lung time points and with whole embryos.
We expect the volume of microarray work performed in the mouse to quickly outweigh that of other model organisms for a number of reasons. From a developmental perspective, the mouse is the only genetically tractable model organism that closely resembles humans in the formation of organ systems with similar structure and function to ours. Collecting fresh tissue for RNA analysis at all developmental and adult stages is a relatively simple task. Also, the number of genetic mutants closely resembling human disease processes is dra-matically increasing with the expansion of forward-genetic (mutagenesis) screens in the mouse, providing many oppor-tunities to perform genome-wide scans of transcripts varying in a particular model of interest. Wide application of microarray techniques to embryos, tissues, or cells harbor-ing engineered mutations will create an exponential number of permutations and combinations ripe for investigation.
Although the future is bright, there is room for improvement in a number of areas. A working draft copy of the mouse
genome sequence will certainly aid in making sense of expression data from novel ESTs. This could potentially narrow down genes of interest to those that have a putative motif or predicted function of interest. As judged by discus-sion at a recent symposium on statistical aspects of microar-ray data analysis [14], there is not yet anything resembling consensus amongst statisticians as to the most appropriate methods to deal with array data. One of the overall chal-lenges to statisticians and computer scientists in general will be the development of analysis software that is readily usable by the uninitiated biologist with data from their first experiment in hand. Although many companies currently claim that their products do this and everything else, this has not been the case in our experience. This will no doubt change in the near future, however, given the rapid advance-ments from academic and commercial activity in the area.
Acknowledgements
The authors thank Hidemasa Bono and the RIKEN Hayashizaki mouse genomics group for sharing data from their microarray database. We also thank Chi-Yip Ho and Tilo Kunath for many helpful discussions.
References
1. Schena M, Shalon D, Davis RW, Brown PO: Quantitative moni-toring of gene expression patterns with a complementary DNA microarray.Science1995, 270:467-470.
2. Ko MS, Kitchen JR, Wang X, Threat TA, Wang X, Hasegawa A, Sun T, Grahovac MJ, Kargul GJ, Lim MK, et al.: Large-scale cDNA analysis reveals phased gene expression patterns during preimplanta-tion mouse development. Development2000, 127:1737-1749. 3. Kargul GJ, Dudekula DB, Qian Y, Lim MK, Jaradat SA, Tanaka TS,
Carter MG, Ko MS: Verification and initial annotation of the NIA mouse 15K cDNA clone set.Nat Genet2001, 28:17-18. 4. Microarray Center at University Health Network, Ontario
Cancer Institute[http://www.oci.utoronto.ca/services/microarray] 5. NIA/NIH Mouse Genomics Home Page
[http://lgsun.grc.nia.nih.gov]
6. The RIKEN Genome Exploration Research Group Phase II Team and the FANTOM Consortium: Functional annotation of a full-length mouse cDNA collection. Nature 2001, 409:685-690. 7. RIKEN Genomic Sciences Center, Genome Exploration
Research Group[http://genome.gsc.riken.go.jp/index.html] 8. Tanaka TS, Jaradat SA, Lim MK, Kargul GJ, Wang X, Grahovac MJ,
Pantano S, Sano Y, Piao Y, Nagaraja R, et al.: Genome-wide expression profiling of mid-gestation placenta and embryo using a 15,000 mouse developmental cDNA microarray. Proc Nat Acad Sci USA2000, 97:9127-9132.
9. Miki R, Kadota K, Bono H, Mizuno Y, Tomaru Y, Carninci P, Itoh M, Shibata K, Kawai J, Konno H, et al.: Delineating developmental and metabolic pathways in vivoby expression profiling using the RIKEN set of 18,816 full-length enriched mouse cDNA arrays.Proc Natl Acad Sci USA2001, 98:2199-2204.
10. Eisen MB, Spellman PT, Brown PO, Botstein D: Cluster analysis and display of genome-wide expression patterns. Proc Natl Acad Sci USA 1998, 95:14863-14868.
11. Zirlinger M, Kreiman G, Anderson DJ: Amygdala-enriched genes identified by microarray technology are restricted to specific amygdaloid subnuclei.Proc Natl Acad Sci USA 2001, 98:5270-5275. 12. Voehringer DW, Hirschberg DL, Xiao J, Lu Q, Roederer M, Lock
CB, Herzenberg LA, Steinman L, Herzenberg LA: Gene microar-ray identification of redox and mitochondrial elements that control resistance or sensitivity to apoptosis.Proc Natl Acad Sci USA2000, 97:2680-2685.
13. Tyers M, Jorgenson P: AFM 4.0: A toolbox for DNA microarray analysisGenome Biology 2001, in press.
14. Biodiscovery Symposium: Experimental Design and statisti-cal Analysis in Array Technology
comment
reviews
reports
deposited research
interactions
information