Performance indicators of Equity linked saving
schemes in India:An empirical Analysis
Dr. Namita Srivastava
*Associate professor, Institute of Cooperative and Corporate Management Research Training, Indira Nagar, Lucknow
Abstract : An investment is the sacrifice of today’sconsumption to gain profitable returns in the future. Therefore the Investors
are very cautious while making investment decision expects higher return at lower risk. The tax paying investors Prefers to invest
their money which provide them an opportunity to avail some tax exemption apart from other objectives of investment like better
return, safety on their investment, liquidity etc.
There are various avenues are available in the financial market such as Fixed Deposit, Public Provident Fund (PPF), National
Savings Certificate (NSC), Insurance, tax saving mutual funds etc which provides Tax relaxation. These tax saving mutual
funds are known as Equity linked saving schemes (ELSS). These ELSS funds provides tax exemption of the income invested in
them u/s 80(c) of Income Tax Act 1961 other than the attractive benefits of mutual fund investment higher returns at low risk,
safety, minimum investment , professional management and Transparency etc.
The present study is an attempt to evaluate the performance of ELSS funds and also factors affecting their performance.
INTRODUCTION
An investment is the sacrifice of today’s consumption to gain
profitable returns in the future. Therefore the Investors are very
cautious while making investment decision expects higher return
at lower risk. The tax paying investors Prefers to invest their
money which provide them an opportunity to avail some tax
exemption apart from other objectives of investment like better
return, safety on their investment, liquidity etc. The government
of India has rendered a large number of tax incentives to induce
the people for significant saving. The investment in tax saving
securities provide dual benefit of providing reasonable return as
well as tax saving.
There are various avenues are available in the financial market
such as Fixed Deposit, Public Provident Fund (PPF), National
Savings Certificate (NSC), Insurance, tax saving mutual funds
etc which provides Tax relaxation. These tax saving mutual
funds are known as Equity linked saving schemes (ELSS).
These ELSS funds provides tax exemption of the income
invested in them u/s 80(c) of Income Tax Act 1961 other than
the attractive benefits of mutual fund investment higher returns
at low risk, safety, minimum investment , professional
management and Transparency etc. It also provides these small
investors a mean of participation in the stock market that has
understand direct investment in equity successfully. Investments
in ELSS qualify for tax deductions under sec 80C of the income
tax act subject to a maximum of Rs 100000 in a financial year.
PPF and NSC are popular tax savings instruments issued by the
Government of India. Public provident fund (PPF) has a lock in
period of 15 years; National savings certificate has a lock in
period of 6 years in comparison to ELSS which has a lock in
period of 3 years only. The present study is an attempt to
evaluate the performance of ELSS funds and also factors
effecting their performance.
RESEARCH OBJECTIVES
The following research objectives are
examined-1. To examine the nature of relationship of fund return
with fund risk and market risk.
2. To determine the determinants of ELSS funds
performance.
RESEARCH
METHODOLOGY-In the study, five variables selected on the basis of previous
studies and literature available to study their impact on fund
return. These variables are Risk free rate of return, total risk
inherent to individual funds, beta of funds, market return and
market risk.
A sample of 9 ELSS funds is taken for the study. The study is
conducted for period beginning from post liberation i.e. 1993 to
2012. The various schemes taken under have operated for
minimum period of eight years since their inception & it is
assumed that this period is enough to drive any inference from
the analysis.
The necessary data and NAV have been collected from the
website of mutualfundsindia.com, AMFI and websites of
various mutual fund companies.
The following methodology is used for the
study-Fund
return-The annual return for the sample schemes are calculated by
using the following equation--.
Rpt = Log (NAVt/NAVt-1)
Where Rpt= is the annual return on mutual fund portfolio for the
period t
NAVt= net asset value for the (t) Period., NAVt-1= net
asset value for the (t-1) Period
The average return on the mutual fund portfolio
-Rp= n∑t-1 Rpt/n
Fund Risk–
Standard deviation is a measurement of total risk of a fund. It
measures the volatility of returns of the fund. It indicates the
tendency of the fund’s NAV to rise & fall in a short period.
Standard deviation of sample equity fund and benchmark
portfolio is calculated through spss.
Market risk–
Market risk is measured by Beta. Beta relates the return of a
stock or mutual fund to a market index. It reflects the sensitivity
of the fund’s return of fluctuations in the market index.
Formula for calculating Beta (βf)
βf = Cov(Rm,,Rp)/Var(Rm)
Where, Cov(Rm,,Rp) = Covariance between the index’s
return(benchmark portfolio return) & the mutual fund scheme’s
RiskFree return
-A return on risk free asset is known as risk free rate of return.
Government sequirities and nationalized bank deposits fall
under this category. As the Government sequirities are not easily
avilable to the common man. Nationalized bank deposits are
considered as risk free asset and interest rate on such deposit
are considerd as risk free return in most of the studies( Gupta
,1991).
The return on risk free asset is computed as follows:
Rft= Log (It/It-1)
Where, Rftis the return on the risk free asset for the period t & I
is the Interest rate on nationalized bank deposits.
It= interest rate at (t-1) Period., It-1 = interest rate at
(t-1) Period.
The average return on the risk free asset ---Rf= n∑
t-1 Rft/n
Market portfolio
-BSE-100 index is used as a benchmark in the present, study is
considered as market portfolio or benchmark portfolio. The
return on market portfolio computed as follows:
Rmt= Log (It/It-1)
Where Rmt= is the return on the market index for the period t &
I is the Index Value
It = BSE-100 National Index at (t-1) Period., It-1 =
BSE-100 National Index at (t-1) Period.
The average return on the market portfolio --Rm=
n∑
t-1 Rmt/n
Research model-- The following multiple regression model is
used to study the impact of study variables on fund performance
Fund return (Rp)= a + b1 Rf+ b2 σp+ b3 βf+ b4
R + b5 σm
Following Hypothesis are formed to achieve the research objectives:
Hypothesis 1
Ho: There is no significant relationship between funds returns and fund risk.
Hypothesis 2
Ho: There is no significant relationship between fund return and market return.
Hypothesis 3
Ho: There is no significant relationship between fund return and performance indicators.
Data analysis and
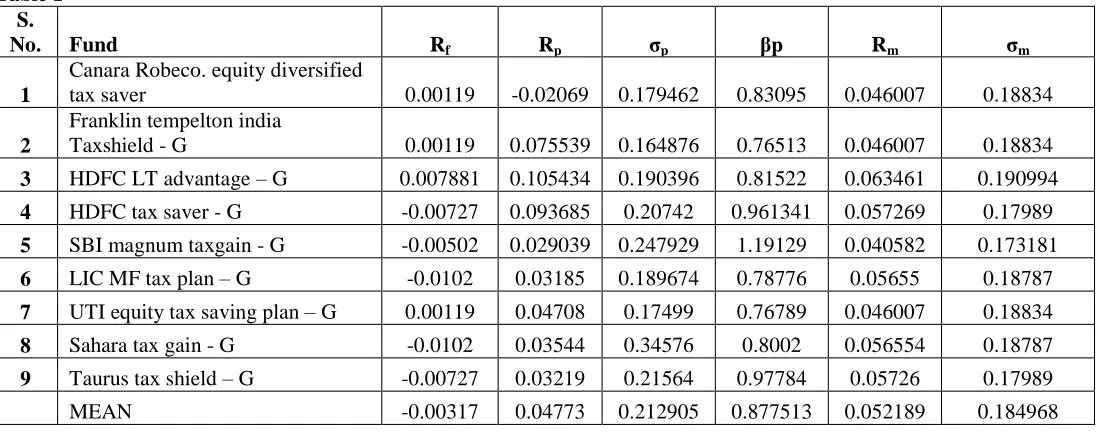
Interpretation-It is observed form the table 1 that average return (Rp) of
sample ELSS funds is lower as compare to risk of bench mark
port folio whereas, average total risk (σp) and market risk (βp)
of sample ELSS funds is higher than the risk of bench mark
port folio, This concluded that investment in ELSS funds are
subject to higher risk as compare to investment in stock
market through equity shares. This shows that portfolio
managers are not able to diversify their port folio efficiently
which helps in reducing the risk of the portfolio to provide
better return than shares at the same level of risk.
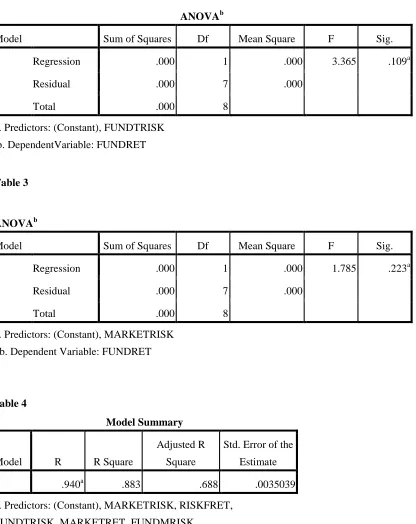
The table 4 (annexure) shows that there is strong positive
correlation between the fund return and performance indicators.
Multiple R2 is 0.883. This shows that about 88.3 % of variance
of fund return is affected by the performance determinants taken
in the study and only 11.7 % of variance of fund return is
attributed to other factors.
value)-An examination with ANOVA (F–value) indicates that explains
the most possible combination of predictor variables that could
contribute to the relationship with the dependent variables.
Table 2(annexure) depicts the results of Anova test performed
the to test the first hypothesis and results shows that
corresponding F value is grater than the tabled value rejected the
null hypothesis, thus there is significant the relationship between
funds returns and fund risk.
Table 3(annexure) depicts the results of Anova test performed
the to test the second hypothesis and results shows that
corresponding F value is grater than the tabled value rejected the
null hypothesis i.e. a significant part of funds returns is also
defined by market risk.
As per table 4 (annexure) the calculated F value is 4.532. It
seems that all of the corresponding F Value is greater in respect
to their consequent values shows that null hypothesis 3 is also
rejected Thus the results of the test imply that there is significant
relationship between fund return and performance indicators.
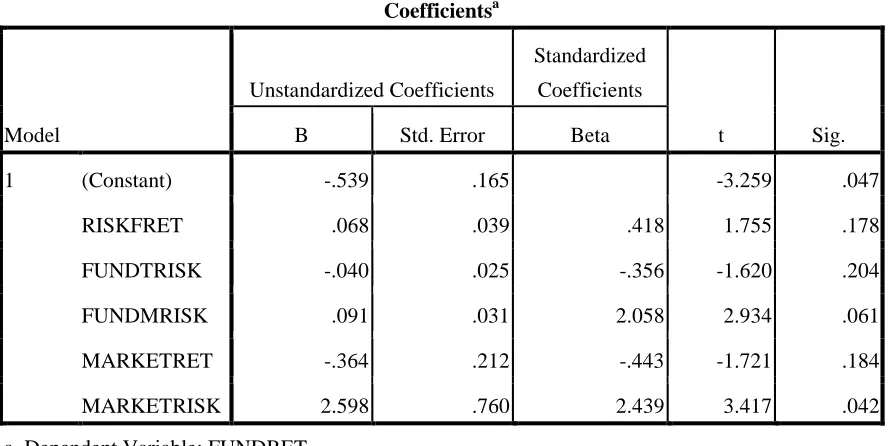
Regression model
The following multiple regression model is developed through
the regression test (annexure table-6) which shows the relation
between study variables on fund
performance-Fund return (Rp)= -0.539 + 0.068 Rf +(-0.040) σp +
0.091βf+ (-0.364) Rm+ 0.2.59 σm
The regression equation exhibits that the
-If risk free return increases by 1%, the fund return will increases
by 6.8%, If fund total risk increases by 1%, the fund return will
decrease by 4%, If fund market risk increases by 1%, the fund
return will increases by only 9.1% and Fund return will increase
by 25.9% if risk on benchmark portfolio is increase by 1%.
CONCLUSION
The study concluded that Sample ELSS Fund’s are able to
provide better return than any return on risk free securities but
unable to outperform the benchmark portfolio in terms of
average return. There is significant relationship between fund
return and fund risk and market return proved through Anova
test justify the fact that returns and risk are co-related with each
other.
The study was set out to explain the impact of the explanatory
variable used in the study (Risk free rate of return, total risk
inherent to individual funds, beta of funds, market return and
market risk) on the ELSS funds operating in India. The results
suggest that all the explanatory variables have their impact on
the fund return and fund performance is affected by changes in
these variables. The results confirm that efficient management
and diversification of fund investment as well as stock market
trends and movement plays an important role in defining ELSS
fund performance. The results of the study will be useful to the
fund managers and investors while managing the funds portfolio
and outperforming the market.
BIBLIOGRAPHY
Agarwal G.D. Mutual Funds and Investors Interest, Chartered Secretary, 1992 Vol.22, No.1,23-24
Anjan Chakrabarti and Harch Rungta, "Mutual Funds Industry in India : an in depth look into the Problem of credibility, Risk and Brand" The ICFAI Journal of Applied Finance, 2000, Vol.6 No.2 April, 27-45
Gupta , Amitabh, “ Market Timing Abilities of Indian Mutual Fund Managers An Empirical Study,” The ICFAI
Journal of Applied Finance, April 2000,Vol. 6, No.2 , pp.1234-50.
Gupta Amitabh, Investment Performance of Indian Mutual
Funds: An Empirical Study” Finance India, Vol. XIV
No.3, Sept. 2002 ,pp.833-866
Gupta O.P. and Sehgal S “ Investment Performance of Mutual funds: The Indian Experience,” a Paper presented
at UTI-ICM Second Capital market Conference, Dec , 1998.
Ippolito, Richard A., “On Studies of Mutual Funds
Performance, 1962-1991, “Financial Analysts Journal,
January / February 1993, pp. 42-50
Jayadev., "Performance Evolution of Portfolio Managers: An Empirical Evidence on Indian Mutual Funds", The ICFAI Journal of Applied Finance, 5(2), 1998, 41-67
Shanmugham R., " Factors Influencing Investment
Decisions", Indian Capital Markets – Trends and
Dimensions (ed.) Tata McGraw-Hill Publishing Company Limited, New Delhi, 2000.
Sharpe, W.F. “Mutual Fund Performance, “Journal of
Business 39, 1, January, 1966 Supplement , pp. 119-138.
Syama Sundar P.V. " Growth Prospects of Mutual Funds and Investor perception with special reference to Kothari Pioneer Mutual Fund" Project Report, Sri Srinivas Vidya Parishad, Andhara University , 1998, Visakhapatnam.
Tripathy, Nalini Prava, "An Empirical Analysis of Performance Evaluation of Mutual Funds in India-A Study on Equity Linked schemes" The ICFAI Journal of Applied Finance, July 2004
Volkman, David and Mark E. Wohar “Determinants of Persistence in the Relative Performance of Mutual Funds,
“Journal of financial Research, Vol. 18, No. 4, Winter
1995, pp. 415-430
William F. Sharpe, "Mutual Fund Performance "Journal of Business, 39, No.1 Jan 1966, pp. 119-138
[image:6.612.21.570.464.680.2]Annexure
Table 1 S.
No. Fund Rf Rp σp βp Rm σm
1
Canara Robeco. equity diversified
tax saver 0.00119 -0.02069 0.179462 0.83095 0.046007 0.18834
2
Franklin tempelton india
Taxshield - G 0.00119 0.075539 0.164876 0.76513 0.046007 0.18834
3 HDFC LT advantage –G 0.007881 0.105434 0.190396 0.81522 0.063461 0.190994
4 HDFC tax saver - G -0.00727 0.093685 0.20742 0.961341 0.057269 0.17989
5 SBI magnum taxgain - G -0.00502 0.029039 0.247929 1.19129 0.040582 0.173181
6 LIC MF tax plan –G -0.0102 0.03185 0.189674 0.78776 0.05655 0.18787
7 UTI equity tax saving plan –G 0.00119 0.04708 0.17499 0.76789 0.046007 0.18834
8 Sahara tax gain - G -0.0102 0.03544 0.34576 0.8002 0.056554 0.18787
Table 2
ANOVAb
Model Sum of Squares Df Mean Square F Sig.
1 Regression .000 1 .000 3.365 .109a
Residual .000 7 .000
Total .000 8
a. Predictors: (Constant), FUNDTRISK
b. DependentVariable: FUNDRET
Table 3
ANOVAb
Model Sum of Squares Df Mean Square F Sig.
1 Regression .000 1 .000 1.785 .223a
Residual .000 7 .000
Total .000 8
a. Predictors: (Constant), MARKETRISK
b. Dependent Variable: FUNDRET
Table 4
Model Summary
Model R R Square
Adjusted R
Square
Std. Error of the
Estimate
1 .940a .883 .688 .0035039
a. Predictors: (Constant), MARKETRISK, RISKFRET,
Table 5
ANOVAb
Model Sum of Squares Df Mean Square F Sig.
1 Regression .000 5 .000 4.532 .122a
Residual .000 3 .000
Total .000 8
a. Predictors: (Constant), MARKETRISK, RISKFRET, FUNDTRISK, MARKETRET,
FUNDMRISK
b. Dependent Variable: FUNDRET
Table 6
Coefficientsa
Model
Unstandardized Coefficients
Standardized
Coefficients
t Sig.
B Std. Error Beta
1 (Constant) -.539 .165 -3.259 .047
RISKFRET .068 .039 .418 1.755 .178
FUNDTRISK -.040 .025 -.356 -1.620 .204
FUNDMRISK .091 .031 2.058 2.934 .061
MARKETRET -.364 .212 -.443 -1.721 .184
MARKETRISK 2.598 .760 2.439 3.417 .042
[image:8.612.18.463.338.561.2]