R E S E A R C H
Open Access
mRNA structural elements immediately
upstream of the start codon dictate
dependence upon eIF4A helicase activity
Joseph A. Waldron
1*, David C. Tack
2,3,4, Laura E. Ritchey
3,5,6, Sarah L. Gillen
1, Ania Wilczynska
1, Ernest Turro
7,8,9,10,
Philip C. Bevilacqua
3,5,11, Sarah M. Assmann
2,5, Martin Bushell
1,12*and John Le Quesne
13,14*Abstract
Background:The RNA helicase eIF4A1 is a key component of the translation initiation machinery and is required for the translation of many pro-oncogenic mRNAs. There is increasing interest in targeting eIF4A1 therapeutically in cancer, thus understanding how this protein leads to the selective re-programming of the translational landscape is critical. While it is known that eIF4A1-dependent mRNAs frequently have long GC-rich 5′UTRs, the details of how 5′ UTR structure is resculptured by eIF4A1 to enhance the translation of specific mRNAs are unknown.
Results:Using Structure-seq2 and polysome profiling, we assess global mRNA structure and translational efficiency in MCF7 cells, with and without eIF4A inhibition with hippuristanol. We find that eIF4A inhibition does not lead to global increases in 5′UTR structure, but rather it leads to 5′UTR remodeling, with localized gains and losses of structure. The degree of these localized structural changes is associated with 5′UTR length, meaning that eIF4A-dependent mRNAs have greater localized gains of structure due to their increased 5′UTR length. However, it is not solely increased localized structure that causes eIF4A-dependency but the position of the structured regions, as these structured elements are located predominantly at the 3′end of the 5′UTR.
Conclusions:By measuring changes in RNA structure following eIF4A inhibition, we show that eIF4A remodels local 5′UTR structures. The location of these structural elements ultimately determines the dependency on eIF4A, with increased structure just upstream of the CDS being the major limiting factor in translation, which is overcome by eIF4A activity.
Keywords:eIF4A, RNA structure, Hippuristanol, Translation, Translation initiation, Cancer, Structure-seq, DMS, Polysome profiling, G-quadruplexes
Background
Translational dysregulation is a hallmark of cancer [1–3], and increased activity of the DEAD box RNA helicase, eukaryotic initiation factor 4A1 (eIF4A1), is associated with poor survival in human malignancy [4]. As such, eIF4A1 is an attractive candidate for cancer therapeutics [5–7], with eIF4A specific inhibitors showing promising results in can-cer cell lines [8,9] and mouse models [10–12]. Despite this,
it remains unclear how increased eIF4A1 activity can drive the malignant phenotype.
eIF4A1 is thought to function primarily as part of the eIF4F complex, along with the scaffold protein eIF4G and the cap binding protein eIF4E, where it unwinds second-ary structure in the 5′UTR of mRNAs [13,14]. However, the helicase activity of eIF4A is relatively weak compared with other RNA helicases [15], and it may have additional ATPase-dependent but helicase-independent roles, such as remodeling of protein/RNA complexes. Indeed, both human eIF4A1 and yeast eIF4A have been shown to en-hance ribosome recruitment onto RNAs lacking second-ary structure, implicating a helicase-independent role for eIF4A during translation initiation [16,17]. Furthermore,
© The Author(s). 2019Open AccessThis article is distributed under the terms of the Creative Commons Attribution 4.0 International License (http://creativecommons.org/licenses/by/4.0/), which permits unrestricted use, distribution, and reproduction in any medium, provided you give appropriate credit to the original author(s) and the source, provide a link to the Creative Commons license, and indicate if changes were made. The Creative Commons Public Domain Dedication waiver (http://creativecommons.org/publicdomain/zero/1.0/) applies to the data made available in this article, unless otherwise stated. * Correspondence:[email protected];[email protected];
1
Cancer Research UK Beatson Institute, Garscube Estate, Switchback Road, Glasgow G61 1BD, UK
13Medical Research Council Toxicology Unit, University of Cambridge,
while it is clear that eIF4A acts as part of the eIF4F com-plex, where its helicase activity is dramatically stimulated through its interaction with eIF4B or eIF4H [15], in HeLa cells, levels of eIF4A1 are more than tenfold higher than those of the other core components of the eIF4F complex [18]. Whether excess eIF4A acts as part of the transla-tional machinery or as“free”eIF4A1 is not known, and as such, the consequence of increased levels of eIF4A1 pro-tein, as seen in tumor cells [4], is not clear.
Recent studies have demonstrated that the requirement for eIF4A1 activity is not equal among cellular mRNAs and that those mRNAs that are most translationally re-pressed following eIF4A inhibition are enriched in tran-scripts that encode proteins with oncogenic function [4, 11,19]. As these mRNAs generally possess longer 5′UTRs with increased GC content, it has been presumed that the increased propensity for 5′UTR secondary structures is driving the dependence on eIF4A1. However, predicting secondary structures of mRNAs from sequence alone is highly unreliable, particularly in living cells, as recent studies have shown that in vivo structures can greatly dif-fer from those determined in vitro [20]. For example, the
enrichment of a (GGC)4motif in the 5′UTRs of
eIF4A1-dependent mRNAs was interpreted as evidence that
mRNAs that possess potential 5′UTR G-quadruplex
se-quences require increased levels of eIF4A1 activity for their translation [11]. However, the prevalence of folded
G-quadruplexes within cells remains controversial [21–
25]; therefore, the structural determinants of eIF4A de-pendency remain unclear.
To test the hypothesis that eIF4A-dependent mRNAs have 5′UTR structural features which require increased eIF4A activity for their unwinding, and determine how these mRNAs differ from less sensitive mRNAs, we measured structural changes in RNA in vivo and transcriptome-wide, following eIF4A inhibition with hip-puristanol, in a similar approach to that used to study other DEAD-box helicases [26–28]. We used Structure-seq2 [29] to measure the single-strandedness of RNA by specific and rapid methylation of single-stranded adenosines and cyto-sines with dimethyl sulphate (DMS). Essentially, the more reactive each nucleotide is to DMS, the more confident we can be that it is single-stranded. It should be noted that al-though single-strandedness can be confidently inferred by DMS reactivity, it is not currently possible to rule out that highly protected regions at least in part arise from protein protection, although protection from eIF4A should be min-imal as eIF4A binds the RNA backbone [30], and DMS methylates the Watson-Crick face of adenines and cyto-sines [31]. We coupled our Structure-seq2 data with poly-some profiling so that we could correlate changes in RNA structure with translation. Hippuristanol was used to in-hibit eIF4A, as this causes a loss of both its RNA binding and its ATPase activity, by locking the protein in its closed
confirmation [32], thereby achieving a loss of function. This is preferable to alternative eIF4A inhibitors, which act in a gain of function manner on a subset of mRNAs, by stimulating the RNA binding and ATPase activity of eIF4A at polypurine rich sequences [33].
Our data show that upon eIF4A inhibition, 5′UTRs
are remodeled, with certain regions becoming more structured, while adjacent segments lose structure. eIF4A-dependent mRNAs have greater localized gains of structure, and crucially, these highly structured elements are located predominantly at the 3′end of 5′UTRs. We propose a model in which increased structure potential just upstream of the coding sequence is the key deter-minant of preferential expression upon the translational reprogramming which occurs following increased eIF4A levels in malignancy.
Results
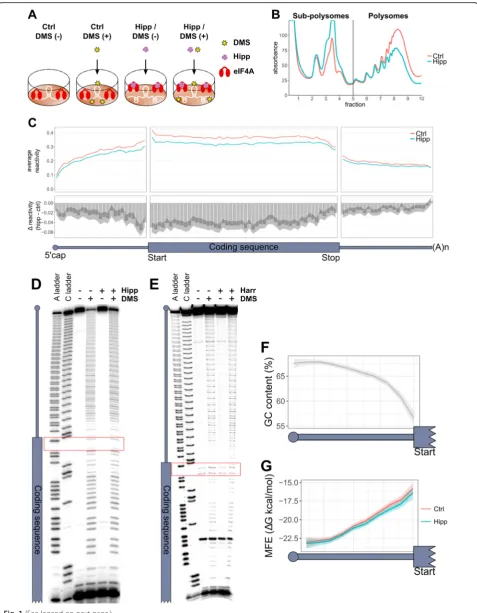
Measuring eIF4A mediated changes in RNA structure To determine the effect of eIF4A activity on RNA second-ary structure in vivo, we measured the reactivity of cellular RNA to dimethyl sulphate (DMS) following eIF4A inhib-ition with hippuristanol (hipp) in MCF7 cells (Fig.1a). In order to primarily inhibit the translation of eIF4A-dependent mRNAs, rather than to completely ablate glo-bal translation, MCF7 cells were treated with hipp for 1 h at the IC50, as determined by35S protein labeling (Add-itional file 1: Figure S1A). This causes a large increase in sub-polysomal RNA and a marked reduction in polysomal RNA (Fig.1b and Additional file1: Figure S1B-C), consist-ent with an inhibition of translation initiation.
was divided much more evenly across the four
nucleo-bases in the DMS (−) samples (Additional file 1: Figure
S1F), with no evidence for any ligation bias (Additional file 1: Figure S1G). Replicate correlation was determined between the three biological repeats for each sample. This ranged from 0.71 to 0.84 for the DMS (−) samples and 0.85 to 0.88 for the DMS (+) samples, across the whole transcriptome (Additional file1: Figure S2A). To determine a suitable coverage threshold, we plotted the correlation co-efficients between replicates for all transcripts after filtering with different coverage thresholds within each replicate (Additional file1: Figure S2B). We decided that a threshold of one was most suitable, and the correlation matrix table in Additional file1: Figure S2C shows that transcriptome-wide correlation within each replicate to be above 0.91 for all samples at this coverage threshold. Importantly, control and hipp DMS (−) samples but not the DMS (+) samples were also highly correlated (Additional file1: Figure S2C), consistent with hipp treatment not leading to any changes in natural reverse transcriptase stops.
Changes in RNA structure following eIF4A inhibition can be inferred by reactivity changes between control and hipp conditions, where decreased reactivity can be inter-preted as increased structure and vice versa. In order to confidently measure changes in DMS reactivity, it is es-sential that the transcriptome used for the bioinformatic pipeline is a true representation of the transcriptome within the cell. This is particularly important given our interest in 5′UTRs and recent findings that true 5′ends often differ from even manually curated transcripts [35]. We therefore used our sequencing reads to assess the
ac-curacy of 5′ end annotation between manually curated
RefSeq transcripts, a transcriptome based on nanoCAGE data from MCF7 cells [35], and a MCF7-specific transcrip-tome based on long-range sequencing reads from Pacific Biosciences (see the“Methods”section) (Additional file1:
Figure S3A-B). Our analysis showed that the two tran-scriptomes which were based on sequencing data from MCF7 cells far better reflected the true 5′ends of our se-quencing data, compared to the RefSeq transcriptome.
Unsurprisingly, the nanoCAGE data are superior in 5′
end annotation, but as the MCF7-specific transcriptome has sequence information for the whole transcript, we decided to use this transcriptome for our analyses. In
addition, we created a 5′ end coverage score to remove
transcripts from further analysis if their true 5′end likely differed from the MCF7-specific transcriptome annotation (Additional file1: Figure S3B and see the“Methods” sec-tion). It should be noted that the 3′most 125 nt of the 3′ UTRs are removed prior to any analysis, due to lack of
Structure-seq2 coverage of the 3′ ends of transcripts
(Additional file 1: Figure S3C); the remaining region is subsequently referred to as the 3′region.
Coding sequences gain in structure more than UTRs following eIF4A inhibition
To assess the changes in RNA structure within the UTRs and CDSs following eIF4A inhibition, we plotted the aver-age reactivity within each region for all transcripts in con-trol and hipp-treated samples (Additional file 1: Figure S4A-C). Interestingly, the biggest difference was seen in the CDS, with the majority of CDSs becoming less reactive to DMS following hipp treatment (Additional file1: Figure S4B), indicating increased average structure overall. This could implicate a role for eIF4A in unwinding structure within the CDS, but is most likely caused by translational repression leading to reduced ribosome occupancy. Elong-ating ribosomes are known to unwind RNA secondary structures, and indeed, two recent studies identified a positive correlation between ribosome occupancy and DMS reactivity [36,37].
(See figure on previous page.)
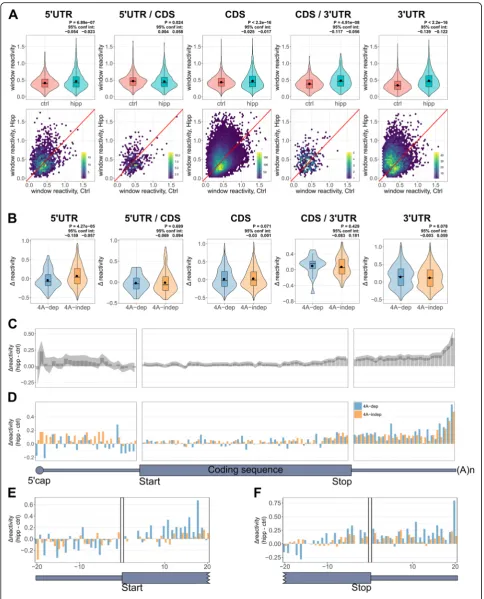
Fig. 15′UTRs are innately more structured at their 5′ends.aA diagrammatic representation of the experimental design. MCF7 cells were treated for 1 h with or without 150 nM hippuristanol (Hipp), followed by 10-min treatment with or without 50 mM DMS.bA representative polysome trace from three biological replicates for control (Ctrl) and hippuristanol (Hipp)-treated cells. See Additional file1: Figure S1B-C for additional two replicates.cThe top panel plots the binned average reactivity for control (Ctrl) and hippuristanol (Hipp) samples across the length of the UTRs (25 bins) and coding sequence (50 bins). The bottom panel plots theΔreactivity, which is calculated by subtracting control from hippuristanol. Therefore, a negative value indicates decreased reactivity and therefore increased structure following hippuristanol treatment, whereas a positive value indicates less structure following hippuristanol treatment. Shaded area represents 95% confidence limits for the difference in means between control and hippuristanol mRNAs within each bin, calculated by a paired two-sidedttest. All 1266 mRNAs included in the analysis have a 5′UTR, CDS, and 3′UTR at least 100 nt in length; have sufficient coverage and 5′end coverage; and are the most abundant transcript per gene.
d,eSequencing gels showing the DMS reactivity of a reporter with an unstructured (CAA)245′UTR (see the“Methods”section) with and without
There is a statistically significant decrease in the mean average reactivity across all 5′UTRs following hipp treat-ment, indicating an overall trend to becoming more structured following eIF4A inhibition (Additional file 1: Figure S4A, top panel). However, plotting the change in reactivity of every individual 5′UTR (Additional file 1: Figure S4A, bottom panel) shows that similar numbers
of 5′UTRs become more and less structured overall.
This is therefore consistent with eIF4A inhibition
lead-ing to remodellead-ing of 5′UTR structure rather than
in-creased structure throughout. The dein-creased reactivity we observe in the 5′UTR is unlikely to be due to 43S ac-cumulation within 5′UTRs, as this would be expected to do the reverse; however, increased reactivity within this region could be explained by paused scanning 43S ribo-somal subunits. To further evaluate, we folded 100-nt 5′ UTR windows, using the DMS reactivities as structural restraints, and plotted both the minimum and average minimum free energy (MFE), and the maximum and average percentage of base-paired nucleotides (stranded-ness) for each transcript, from the predicted folds (Additional file 1: Figure S4D-G). Although statistically significant, the differences are very small. This could in-dicate either very little change in RNA structure follow-ing eIF4A inhibition, or refoldfollow-ing of the RNA, so that certain regions become more structured, with adjacent regions becoming less structured, which would not lead to large changes in the MFE.
The mean change in average reactivity was smallest in the 3′UTRs (Additional file1: Figure S4C top panel), with fewer individual 3′UTRs changing in reactivity following
hipp treatment (Additional file 1: Figure S4C bottom
panel). As eIF4A is not thought to act within the 3′UTR, it is likely any changes are indirect consequences of general rearrangements in mRNA structure following translational inhibition. We have therefore decided not to focus on these.
To assess localized changes in structure, we calculated
the Gini coefficient [20, 38] which is a commonly used
measurement of inequality within a set of numbers. A Gini coefficient of one indicates an unequal distribution whereas zero indicates perfect evenness. For example, if a transcript/region had a high Gini coefficient, all the re-activity would be restricted to a small percentage of nu-cleotides, whereas a low Gini coefficient would indicate evenly shared reactivity among all nucleotides. Overall Gini coefficients increased for the majority of transcripts in both UTRs and the CDS following hipp treatment (Additional file 1: Figure S4H-J). This is consistent with an increase in the stability of localized secondary struc-tures following eIF4A inhibition, which would cause base-paired regions to become less accessible and in-ternal bulges and loops more accessible, resulting in re-activities further towards the extremes of their range.
5′UTRs are most structured away from the coding sequence
To visualize reactivity within the transcripts, we plotted the binned reactivity across the length of each UTR and CDS (Fig.1c) and the reactivity of the first and last 60 nt
of each region (Additional file 1: Figure S5A). This
showed that 5′UTRs have greater DMS reactivity
to-wards the CDS, i.e., are most structured at their extreme
5′ ends, in both control and hipp conditions. As
DMS-sequencing data contains more stops at adenines than
cytosines (Additional file 1: Figure S1F) [39, 40], we
tested whether this pattern in reactivity was due to dif-fering ratios of adenines to cytosines by plotting the binned reactivity pattern for adenines and cytosines sep-arately (Additional file1: Figure S5B-C). As the reactivity pattern was present for both nucleotides, this suggests
that 5′UTRs become increasingly more accessible to
DMS towards the CDS. To test if 5′ end protection is
due to structure or to protection by cap-binding cellular machinery, we designed an experiment to measure DMS reactivity within a structure-less 5′UTR (Additional file1: Figure S5D) in nuclease untreated rabbit reticulocyte lysate, which recapitulates cap-dependent translation [41].
The pattern of reactivity within the 5′UTR was even
throughout (Fig.1d), unlike the reactivity in 5′UTRs glo-bally (Fig.1c). Furthermore, when we inhibited translation of our reporter mRNA with hipp (Additional file1: Figure S5E), which would reduce binding of eIF4A and the ribo-somal machinery to the reporter mRNA, we saw no change in the reactivity pattern within its 5′UTR (Fig.1d). We also ruled out the possibility that the ribosome could be protecting from DMS reactivity, by adding harringto-nine to this assay. Harringtoharringto-nine traps the 80S ribosome on the start codon [42]; therefore, if the ribosome could protect from DMS reactivity, we would expect to see in-creased protection over the start codon following transla-tional repression with harringtonine (Additransla-tional file 1: Figure S5F), which we do not observe (Fig.1e). This sup-ports the interpretation that 5′UTRs are less accessible to DMS at their 5′ends due to increased structure.
To see if greater structure towards the 5′end was an
innate sequence-driven feature of 5′UTRs, we
deter-mined the GC content and MFE of predicted folds for all 50-nt windows, across the length of the 5′UTRs, fol-lowing a sliding window approach with steps of 10 nt (Fig.1f, g). This clearly mirrors the pattern we see in re-activity (Fig. 1c), in that 5′UTRs are more GC-rich and structured towards the 5′end. It therefore seems to be
an intrinsic property of 5′UTR sequences to have less
structure formation nearer to the CDS, and that this is driven at least in part by GC content.
(Fig. 1c and Additional file 1: Figure S5A), indicating
that the 5′ ends generally remain structured following
eIF4A inhibition while the regions close to the CDS gain in structure the most. This is consistent with a specific inhibition of scanning. An alternative explanation is that increased structure in this region could be due to re-duced ribosome occupancy in upstream open reading frames (uORFs). To test this, we made use of global translation initiation sequencing (GTI-seq) data, taken from Lee et al. [43], which maps translation start sites in HEK293 cells. Although these data are from an alterna-tive cell line, no data are currently available for MCF7 cells. Based on these data, we restricted the analysis to only those genes which we can be most confident have no potential for upstream translation initiation, by selecting genes that initiated translation solely from the annotated translation initiation start site (aTIS). If the decreased reactivity at the 3′end of the 5′UTR follow-ing hipp treatment was caused by reduced ribosome oc-cupancy in uORFs, then we would not expect to see this in the aTIS transcripts. As this reduction in reactivity is still observed in these transcripts (Additional file 1: Fig-ure S5G-H), this argues against the increased structFig-ure
at the 3′ end of the 5′UTRs being caused by reduced
ribosome occupancy within uORFs.
The CDS is more reactive across its entire length than both the UTRs (Fig. 1c). This is in agreement with Beau-doin et al. [36] and Mizrahi et al. [37] who claim this is a consequence of ribosome occupancy, leading to the un-winding of CDS secondary structure. Decreased reactivity following hipp treatment is observed across the length of the CDS, but the Δ reactivity diminishes towards the 3′ end (Fig.1c). If the changes in reactivity in the CDS are be-ing mediated by the elongatbe-ing ribosome, then this might indicate generally reduced ribosome density towards the 3′ end of CDSs.
Ribosome occupancy is correlated with DMS reactivity To investigate the correlation between RNA secondary structure and translation, polysome profiling was carried out in parallel, which quantifies translational efficiency based on the enrichment of mRNA in the polysomal over the sub-polysomal fractions, following separation on a su-crose density gradient (see the “Methods” section). Poly-some profiling was chosen over riboPoly-some footprinting as we did not require single-nucleotide resolution of ribosome positioning in the coding sequences of the mRNA, and polysome profiling is a simpler technique that is thought to be more sensitive at identifying less abundant mRNAs with smaller shifts in translation efficiency [44]. The traces ac-quired during the fractionation for each biological repeat are shown in Fig. 1b and Additional file1: Figure S1B-C. Fractions 1–5 and 6–11 were each pooled to comprise the sub-polysomal and polysomal RNA respectively, and along
with total RNA samples, were analyzed by RNA-Seq (see the“Methods”section).
To test for a correlation between ribosome occu-pancy and DMS reactivity in the CDS, we selected the top and bottom third of mRNAs, ranked by their
trans-lational efficiency (TE) under control conditions
(Fig.2a), and plotted the average reactivity for each
re-gion (Fig. 2b–d) and the binned reactivity across the
transcript (Fig. 2e). This clearly shows that highly
translated mRNAs (high TE group) are significantly more reactive in the CDS compared with translationally
repressed mRNAs (low TE group) (Fig. 2c, e), and this
is most pronounced towards the 3' end of the CDS. This further supports the findings from Beaudoin et al. [36] and Mizrahi et al. [37], suggesting that the elongat-ing ribosome is responsible for unfoldelongat-ing the mRNA within the CDS.
The average 5′UTR reactivity was also significantly
higher in the high TE group compared to the low TE mRNAs (Fig. 2b). Interestingly, it is only within the 3′ half of the 5′UTRs (Fig.2e), particularly within the last
20 nt (Additional file 1: Figure S6A), that the high TE
mRNAs are more reactive, and surprisingly, these mRNAs are less reactive at the extreme 5′ends of their 5′UTRs (Fig.2e). To test whether the high TE group is enriched in mRNAs that are initiating translation up-stream, we again turned to the GTI-seq data [43] to calculate an upstream translation initiation site (uTIS) score for each gene. This is calculated by dividing the number of reads mapped to upstream start sites by the number of reads mapped to both upstream and the an-notated start sites. A score of zero would indicate no upstream initiation, whereas a score of one would indi-cate initiation only at upstream sites. This analysis showed no significant difference in uTIS scores
be-tween the two groups of mRNAs (Additional file 1:
Figure S6B), suggesting that reduced structure just up-stream of CDSs in highly translated mRNAs is not due to upstream translation initiation.
Interestingly, there is increased reactivity throughout
the length of the 3′UTR in the low TE mRNAs,
com-pared to the high TE group, which could reflect altered protein binding based on the translational status of the mRNAs.
eIF4A-dependent 5′UTRs are not enriched in potential G-quadruplex sequences
Fig. 2Highly translated mRNAs are more reactive to DMS in the coding region and 3′end of the 5′UTR.aA scatter plot of the log(e) fragments per kilobase million (FPKM) in the sub-polysomal and polysomal fractions, color coded by the top (high TE) and bottom (low TE) third of genes ranked by the translational efficiency (TE), which is calculated as a ratio of polysomal to sub-polysomal RNA.b–dViolin plots depicting the average reactivity under control conditions in the 5′UTRs, CDSs, and 3′UTRs, for the top and bottom third of mRNAs ranked by TE after filtering by coverage and 5′end coverage and selecting the most abundant transcript per gene. Violin plots include boxplots, with the mean denoted by a dot.Pvalues and 95% confidence intervals were calculated using an un-paired, two-sided Wilcoxon test. Each group contains 627 mRNAs.e
[image:7.595.60.538.86.605.2]were termed dependent (4A-dep) and
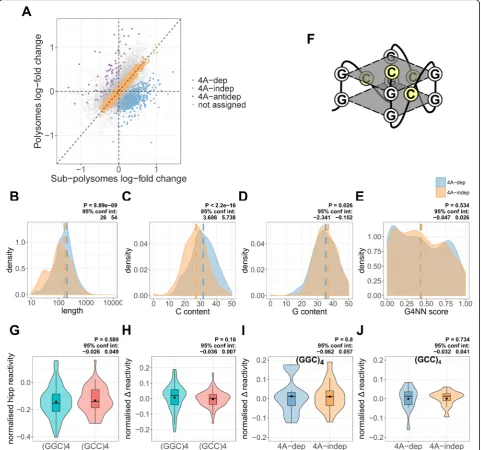
eIF4A-independent (4A-indep) mRNAs respectively (Fig. 3a)
(see the “Methods” section). The model also identified those mRNAs that had shifted from the sub-polysomal to polysomal fractions, which were termed
eIF4A-antidependent mRNAs (Fig. 3a). However,
unsurpris-ingly, given that very few mRNAs are expected to increase their rate of translation following eIF4A inhib-ition, this group of mRNAs was too small to use for any downstream analysis. To test for overlap between previously published eIF4A-dependent mRNAs, we plotted a Venn diagram containing the hipp-sensitive mRNAs from Iwasaki et al. [33], using ribosome
foot-printing following 1μM hipp treatment in HEK293
cells and the eIF4A1-dependent mRNAs identified by Modelska et al. [4], using polysome profiling following
knock-down of eIF4A1 with siRNA (Additional file 1:
Figure S7A). We found a better overlap with the eIF4A1-dependent mRNAs identified by Modelska et al. (we identified 33.7% of the eIF4A1-dependent mRNAs from this study), than with the hipp-sensitive mRNAs identified by Iwasaki et al. (we identified 17.3% of the hipp-sensitive mRNAs from this study), suggest-ing that the use of the same cell line and technique leads to a higher overlap than a similar approach to eIF4A inhibition.
As previous studies have shown that 4A-dep mRNAs
have longer more GC rich 5′UTRs than 4A-indep
mRNAs [4, 11, 19], we again looked at these properties
in our groups of transcripts. Indeed, both 5′UTR length
(Fig. 3b) and C content (Fig. 3c), but not G content
(Fig. 3d) are increased in 4A-dep mRNAs. It is interest-ing that G content is not increased, given that the
en-richment of a (GGC)4 motif in the 5′UTRs of 4A-dep
mRNAs had previously been interpreted as implicating eIF4A activity in unwinding G-quadruplexes [11]. To test specifically for an enrichment of G-quadruplex se-quences, we used G4RNA screener [45] to predict the likelihood of G-quadruplex folding within the 5′UTRs of these groups of mRNAs. This showed no significant en-richment of potential G-quadruplex sequences in
4A-dep mRNAs compared to 4A-in4A-dep mRNAs (Fig.3e).
The cytosines within a (GGC)4 motif that has folded
into a G-quadruplex would be within the loop position of the quadruplex (Fig.3f). We therefore reasoned that the reactivity of these cytosines to DMS should be higher when these sequences are folded into a G-quadruplex than when folded into canonical Watson-Crick based structures, due to increased accessibility, as is seen with
the SHAPE reagent NAI [23, 46]. To further evaluate
whether 5′UTR (GGC)4sequences were likely folded into G-quadruplexes following eIF4A inhibition in cells, we plotted the normalized reactivity of (GGC)4motifs under hipp conditions. We compared this normalized reactivity
to the reverse complement (GCC)4 sequence, which has
no G-quadruplex folding potential. To normalize the re-activity of each motif, we subtracted the average rere-activity
of the whole 5′UTR from the average reactivity of the
motif. There was no significant difference in normalized
reactivity between (GGC)4 and (GCC)4 motifs (Fig. 3g),
further supporting that these (GGC)4motifs fold into ca-nonical Watson-Crick based structures rather than G-quadruplexes [24]. To assess for changes in reactivity
fol-lowing eIF4A inhibition, we compared the Δ reactivity,
again normalized to the averageΔreactivity of the whole 5′UTR, which was also not significantly different between the (GGC)4and (GCC)4motifs (Fig.3h). Finally, as it may be possible that the (GGC)4sequences are folded into G-quadruplexes only in 4A-dep mRNAs, we compared the
normalized Δ reactivity between 4A-dep and 4A-indep
mRNAs for the (GGC)4 (Fig. 3i) and (GCC)4 (Fig. 3j)
motifs and there was no significant difference between the two groups of mRNAs for either motif. Taken together, these data suggest that enrichment of (GGC)4 motifs in 4A-dep mRNAs is not due to their potential to fold into G-quadruplexes.
Increased structure just upstream of the coding sequences following hippuristanol treatment is most pronounced in eIF4A-dependent mRNAs
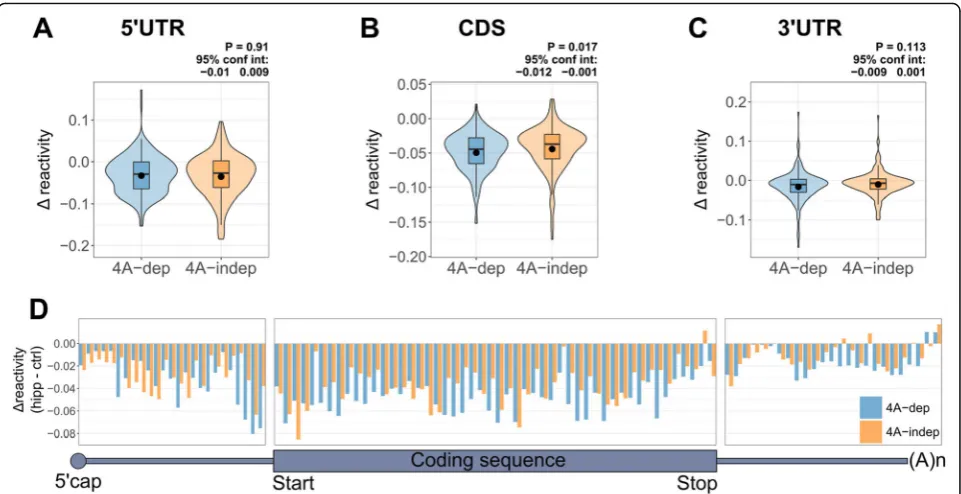
To compare RNA structural changes in dep and 4A-indep mRNAs following eIF4A inhibition, we plotted the
average Δ reactivities of these groups of transcripts
(Fig.4a–c). To our surprise, there was no significant
dif-ference in the Δ reactivity between dep and
4A-indep 5′UTRs (Fig. 4a). There was also no significant
difference in the change in MFE and strandedness of
folded 5′UTRs following hipp treatment, between
4A-dep and 4A-in4A-dep mRNAs (Additional file 1: Figure
S7B-C). There is a small, yet statistically significant
dif-ference in the average Δ reactivity between 4A-dep and
4A-indep CDSs (Fig.4b) but not 3′UTRs (Fig.4c). As the largest structural changes in the 5′UTR are
oc-curring close to the CDS, we next plotted the binned Δ
reactivity across the transcript for our dep and
4A-indep mRNAs (Fig. 4d). This clearly shows that
follow-ing hipp treatment, 4A-dep mRNAs gain in structure the most just upstream of the CDS and that this is the
region in which we see the biggest difference in Δ
re-activity between 4A-dep and 4A-indep mRNAs. Upon
examination of the final 60 nt of the 5′UTR, it seems
Fig. 3eIF4A-dependent mRNAs are not enriched in G-quadruplexes.aA scatter plot depicting the log-fold change in expression between hippuristanol and control, in the polysomal and sub-polysomal fractions, for all 16,868 genes in the MCF7-specific transcriptome. A negative log-fold change indicates reduced expression following hippuristanol treatment and vice versa. The plot is color coded by those mRNAs identified as either eIF4A-dependent (4A-dep) (728), eIF4A-independent (4A-indep) (4587), or eIF4A-antidependent (4A-antidep) (78) or those that were not assigned to each category (see the“Methods”section).b–eDensity plots, showing 5′UTR length, C content, G content, and G4NN scores (see the
“Methods”section) for 4A-dep and 4A-indep mRNAs. For those mRNAs which we were able to determine the UTR boundaries (see the“Methods”
section), the most abundant transcript per gene was selected. An equal group size of 4A-indep mRNAs was created by selecting the mRNAs with the lowest posterior probability, i.e., those which with most confidence are 4A-indep. This resulted in 441 mRNAs per group.Pvalues and 95% confidence intervals were calculated using an un-paired, two-sided Wilcoxon test.fA diagrammatic representation of a (GGC)4sequence folded
into a G-quadruplex, with the cytosine residues highlighted in yellow, indicating their accessibility to DMS.gNormalized average reactivity of all (GGC)4and (GCC)4motifs within 5′UTRs. One motif per 5′UTR was randomly selected, which resulted in 91 (GGC)4and 54 (GCC)4motifs. The
reactivity of the motif was normalized by subtracting the average reactivity for the corresponding 5′UTR.Pvalues and 95% confidence intervals were calculated using an un-paired, two-sided Wilcoxon test.hNormalized averageΔreactivity of the (GGC)4and (GCC)4motifs from panel G.
TheΔreactivity of the motif was normalized by subtracting the averageΔreactivity for the corresponding 5′UTR.Pvalues and 95% confidence intervals were calculated using an un-paired, two-sided Wilcoxon test.i,jNormalizedΔreactivity of (GGC)4and (GCC)4motifs, compared
between 4A-dep and an equal-sized group of 4A-indep mRNAs. There are 16 (GGC)4and 15 (GCC)4motifs in each group.Pvalues and 95%
[image:9.595.58.540.89.539.2]structure within this region following eIF4A inhibition is most inhibitory to translation. There was no significant difference in uTIS scores between 4A-dep and 4A-indep
mRNAs (Additional file 1: Figure S7E), or between the
high-sensitivity (4A-dep) and low-sensitivity (4A-indep) mRNAs from Iwasaki et al. [33], following hipp
treat-ment in HEK293 cells (Additional file 1: Figure S7F).
These results indicate no enrichment of upstream translation in 4A-dep mRNAs, eliminating the possi-bility that the increased structure just upstream of the CDS in 4A-dep mRNAs is due to reduced ribosome occupancy in uORFs.
On balance, we interpret these findings as evidence that the region immediately upstream of the start codon confers eIF4A dependence upon mRNAs for their efficient translation. If these mRNAs were refold-ing due to translational inactivity when eIF4A is inhib-ited, resulting in reduced binding of the 48S initiation complex at the start codon, then we would also expect 4A-dep mRNAs to gain more structure than 4A-indep mRNAs immediately downstream of the start codon within the CDS, which is not observed (Additional file1: Figure S7D).
eIF4A-dependent 5′UTRs gain in localized structure more than eIF4A-independent 5′UTRs upon hippuristanol treatment
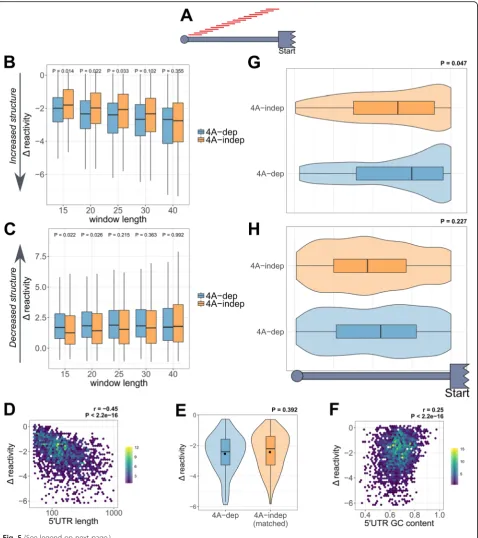
To identify the regions that changed in DMS reactivity the most within each 5′UTR, we carried out a sliding window analysis. This approach measures theΔreactivity of every possible sequence of a given length (Fig.5a) and identifies the window with the biggest decrease or increase in re-activity per transcript. Figure5b and c show theΔ
reactiv-ities of these windows within 4A-dep and 4A-indep 5′
UTRs, with varying window sizes. Interestingly, theΔ re-activity of the windows that decrease in rere-activity the most in the presence of hipp is more negative for 4A-dep mRNAs, suggesting that these 5′UTRs gain more in local-ized structure following eIF4A inhibition. Furthermore, this difference is most statistically significant with
win-dows of 15 nt (Fig. 5b), indicating perhaps the optimal
length of secondary structure which eIF4A can efficiently
unwind within the 5′UTRs of cellular mRNAs.
Interest-ingly, this is in rough agreement with the hairpin size with which eIF4A has been shown to efficiently unwind in vitro [47], and also the translocation step size of eIF4A in single
molecule experiments [48]. The Δ reactivity of the
[image:10.595.58.539.87.334.2]windows that are increasing in reactivity the most, i.e., los-ing structure with eIF4A inhibition, mirrors the pattern we see for the windows that decrease in reactivity, in that they are increasing in reactivity more for 4A-dep 5′UTRs (Fig. 5c). This explains why there is no difference in the averageΔreactivity across the whole 5′UTR between
4A-dep and 4A-in4A-dep 5′UTRs, as certain regions gain in
structure, but adjacent regions lose structure. This sug-gests that following eIF4A inhibition, 5′UTRs are remod-eled, undergoing local gains and losses in structure that tend to balance out, rather than gaining in structure throughout. 4A-dep mRNAs are seen to contain more stable localized secondary structures than 4A-indep mRNAs, and we propose that it is these small localized el-ements that are inhibitory to scanning.
Increased length of eIF4A-dependent 5′UTRs drives increased localized structure potential
One possible explanation for eIF4A-dependent 5′UTRs
gaining more in localized structure could be that 4A-dep
5′UTRs are longer (Fig. 3b), therefore increasing the
number of potential intra-molecular RNA interactions and as a result the likelihood of stable local secondary structures forming. We therefore tested for a correlation between the extent of localized gains in structure and 5′
UTR length by plotting the most negative Δ reactivity
per transcript against its 5′UTR length. Figure5d shows that there is indeed a strong negative correlation, indi-cating that the longer the 5′UTR, the more likely it is to have a region that gains in stable secondary structure. To evaluate whether the increased localized structure in
4A-dep 5′UTRs is caused by their increased length, we
created a 4A-indep group that was matched by 5′UTR
length. Interestingly, there was no significant difference
in Δ reactivity between this matched 4A-indep group
and 4A-dep mRNAs (Fig. 5e), suggesting that 4A-dep
mRNAs gain in localized secondary more than 4A-indep
mRNAs because of increased 5′UTR length, which likely
explains why 4A-dep mRNAs possess longer 5′UTRs.
There was not a strong correlation between 5′UTR GC
content and increased localized structure (Fig.5f). To assess for any sequence specificity within the re-gions that are gaining the most in structure following hipp treatment, we carried out motif discovery using MEME [49] on the 20-nt windows that decrease in re-activity the most. However, this did not generate any sig-nificantly enriched motifs.
Localized structures confer increased eIF4A dependence only when positioned at the 3′end of the 5′UTR
The sliding window analysis suggests that 4A-dep mRNAs have increased localized secondary structure compared to 4A-indep RNAs, and that this is at least partially explained
by their having longer 5′UTRs. However, there remain
many 4A-indep mRNAs with long 5′UTRs, which also
in-crease in localized secondary structure to a similar extent following eIF4A inhibition (Fig.5e). We therefore sought to address why these mRNAs remain insensitive to eIF4A inhibition. We hypothesized that, based on the pattern of reactivity changes shown in Fig.4d, the position of these localized gains in 5′UTR structure is important in deter-mining sensitivity to eIF4A inhibition. We therefore plot-ted the relative positions of these windows within the 5′ UTRs of 4A-dep mRNAs and the 4A-indep group which
has been matched by 5′UTR length, which we know have
similar average Δ reactivities (Fig. 5e). For 4A-dep
mRNAs, we see a much stronger bias in the position of these windows towards the 3′end of the 5′UTR than in
4A-indep mRNAs (Fig. 5g), whereas importantly for the
windows that lose structure, there is no positional bias for
either the 4A-dep or 4A-indep mRNAs (Fig. 5h). This
therefore suggests that increased structure just upstream of the CDS is most inhibitory to translation following eIF4A inhibition.
As our findings till now have relied on averaged reactivities between the three replicates, the informa-tion within the biological variainforma-tion is lost. We therefore sought to validate our findings using the dStruct
(See figure on previous page.)
package [50], which identifies differentially reactive re-gions that differ more in their pattern of reactivity be-tween control and treated samples, than bebe-tween replicates. As dStruct takes variability between repli-cates into account, we reduced the coverage threshold to include all transcripts with a combined coverage more than one for all replicates in each condition, thereby including less abundant transcripts into the analysis. We used whole transcripts, rather than spliced regions, so that dStruct could also identify windows that overlap UTR/CDS boundaries. dStruct first identi-fies windows that appear more similar within replicates than conditions, before applying the Wilcoxon signed-rank test, controlling for false discovery rates (FDRs) using the Benjamini-Hochberg procedure [50]. The
FDRs are shown in Additional file 1: Figure S8A, and
we used a cutoff of 0.25, which identified 27,396 differ-entially reactive windows within 4087 transcripts. We then assigned each window into one of five groups,
de-pending on whether they were in the 5′UTR, CDS, or
3′UTR or whether they overlapped either UTR/CDS
junction. The lengths of the windows from each group
are shown in Additional file 1: Figure S8B. This is in
agreement with the optimal length of the windows with the biggest decrease in reactivity from the sliding
win-dow analysis in Fig. 5b, in that the most common
win-dow length is 15 nt and the median is 21 nt in the 5′
UTR. The reactivities under control and hipp
condi-tions for all windows are shown in Fig. 6a, and the Δ
reactivities of those windows in 4A-dep and 4A-indep
mRNAs are shown in Fig.6b. The reactivity of the
win-dows in the 3′UTRs and the 3′UTR/CDS junction are
changing the most, with a relatively large increase in re-activity following eIF4A inhibition (Fig.6a). This could indicate reduced protein binding following translational repression with hipp. We also see a slight, yet statisti-cally significant increase in the reactivity of the
differ-entially reactive windows in the 5′UTR and CDS
(Fig. 6a). This is slightly surprising given that the aver-age reactivity across the entire lengths of these regions is decreasing following hipp treatment (Additional file1: Figure S4A-C). This therefore suggests that while over-all, reactivity is decreasing in these regions, the average reactivity in the differentially reactive windows is actu-ally increasing. Cruciactu-ally however, when we compare theΔ reactivity between the differentially reactive
win-dows within the 5′UTRs of 4A-dep and 4A-indep
mRNAs, the majority of the windows from 4A-dep 5′
UTRs are decreasing in reactivity following hipp treat-ment and these are significantly more negative than
those windows from 4A-indep 5′UTRs, which is not
seen in any of the other regions (Fig.6b). The larger de-crease in reactivity observed in 4A-dep 5′UTRs follow-ing eIF4A inhibition suggests that these differentially
reactive windows are gaining in structure more in the
5′UTRs of 4A-dep mRNAs compared to 4A-indep
mRNAs.
To determine whether this analysis also indicated
in-creased structure following eIF4A inhibition at the 3′
end of 5′UTRs, we binned all the windows across the
length of the transcript (Fig.6c) and also just those
win-dows from 4A-dep and 4A-indep mRNAs (Fig.6d).
Cru-cially, we again see that the biggest difference between 4A-dep and 4A-indep mRNAs to be just upstream of the coding region, with 4A-dep mRNAs gaining more in
structure in this region (Fig. 6d). We should note
how-ever that we now also see a difference between these
mRNAs at the very 5′of the 5′UTR, which we did not
see in our prior analysis (Fig.4d), which could also indi-cate increased unwinding of secondary structure by eIF4A in cap proximal regions.
One alternative explanation for our data is that we see increased structure following hippuristanol treatment just upstream of the coding region more in 4A-dep mRNAs, due to reduced ribosome occupancy over the translation start site, during the transition of the 48S initiation com-plex into the elongation competent 80S comcom-plex. However, if this was true, we would also expect there to be increased structure immediately downstream of the start site, which we do not see (Additional file1: Figure S7D). To confirm this finding, we plotted theΔreactivity of all dStruct win-dows that overlap the 5′UTR/CDS junction (Fig.6e). Again we observe decreased reactivity in 4A-dep transcripts com-pared to 4A-indep just prior to the start site, but actually increased reactivity just downstream of the start site, sup-porting our previous conclusions. There was no obvious difference in reactivity patterns between dep and 4A-indep mRNAs at the CDS/3′UTR junction (Fig.6f).
We again used MEME [49] to search for any enriched sequences in the windows identified by dStruct in the 5′ UTRs of 4A-dep mRNAs, but this did not return any enriched motifs.
The above findings therefore support the following conclusions. Firstly, following eIF4A inhibition, 5′UTRs are remodeled, gaining structure in certain regions and losing it elsewhere. The extent to which 5′UTRs are re-modeled is strongly affected by 5′UTR length, with lon-ger 5′UTRs gaining more in localized structure (Fig.5d). This likely explains why 4A-dep 5′UTRs tend to be lon-ger (Fig.3b), as this will increase the likelihood of stable
localized structure formation. However, increased
localized structure alone does not seem to accurately
predict eIF4A-dependency as a 5′UTR length-matched
4A-indep group of mRNAs gained in local structure to a similar extent as 4A-dep messages (Fig.5e). Crucially, in 4A-dep mRNAs, these influential highly structured elements are located predominantly at the 3′end of the
Figure S7D). Fitting with our findings that translationally repressed mRNAs are more structured in this region under control conditions (Fig. 2e) and that 5′UTRs are generally more structured at their 5′ends (Fig. 1c), i.e., away from the CDS, it is therefore those mRNAs that gain the most structure just upstream of the coding re-gion following eIF4A inhibition that are the most trans-lationally repressed.
Discussion
It is widely accepted that eIF4A is required for both ribosome recruitment and scanning, and it has been as-sumed that this requirement is due to the helicase
activ-ity of eIF4A [13,14]. Attempts to understand how eIF4A
and secondary structure dictate translation efficiency
have been limited to single 5′UTR examples [51–54],
and these investigations have focused on cap-proximal structures, due in part to eIF4A being a component of the cap binding complex eIF4F. Recent studies in both yeast and mammalian systems have shown that eIF4A enhances ribosome recruitment regardless of RNA
struc-tural complexity [16, 17]. This could explain why in
yeast, eIF4A is thought to be required globally for the translation of all cellular mRNAs, with Ded1p acting as the main helicase involved in unwinding secondary
structures distal from the 5′ cap [55]. However, given
that the mRNAs most sensitive to eIF4A inhibition in
human cells have longer, more GC-rich 5′UTRs [4, 11,
19], it would be surprising if eIF4A activity was re-stricted to the cap proximal region. Here we take a glo-bal and unbiased approach to probe the roles of eIF4A in translation initiation, with the use of mRNA structure profiling in a human cell line, through the modification of single-stranded adenines and cytosines by DMS.
Our data suggest that elevated eIF4A in human cells is required to unwind secondary structures to aid scanning of the small ribosomal subunit on mRNAs with particu-larly long and structured 5′UTRs. This could therefore explain why certain mRNAs are more dependent on eIF4A activity than others. It is clear that eIF4A is also required for ribosome recruitment, with recent evidence
suggesting a helicase independent role of eIF4A during this step, possibly by remodeling the conformation of the
40S subunit [16,17]. The absence of major cap proximal
structural changes in 4A-dep mRNAs (Fig.4d) is consist-ent with a model in which the requiremconsist-ent of mRNAs for eIF4A during ribosome recruitment is equal, as has been suggested previously [16, 17]. It appears that the role of the helicase activity of eIF4A in human cells is more simi-lar to that of Ded1p in yeast, in that mRNAs most dependent on Ded1p, and its paralogue Dbp1, contain
longer 5′UTRs with increased propensity for secondary
structures [55,56]. While Ded1p appears to act in a co-operative manner with the eIF4F complex to promote 48S initiation complex assembly in yeast [57, 58], the exact role of the human orthologue of Ded1p, named DDX3, is less clear. DDX3 has been implicated in many aspects of RNA metabolism, including translation [59], where it is thought to unwind cap proximal structures to allow ribo-some recruitment in a mRNA-specific manner [60]. Both
the sliding window (Fig. 5b) and dStruct analysis
(Add-itional file 1: Figure S8B) support the in vitro data that eIF4A can only efficiently unwind hairpins up to roughly 15–20 nt [47,48]. DHX29 has been implicated in unwind-ing more stable hairpin structures [61, 62], which would therefore be consistent with our data.
To confidently measure DMS reactivity, it is essential that the reference transcriptome used for the bioinfor-matic analysis is a true representation of the cellular tran-scriptome. For example, within MCF7 cells, roughly 30%
of expressed mRNAs possess a 5′UTR less than half the
length of that annotated in the RefSeq database [35]. Our data support this finding (Additional file 1: Figure S3), highlighting an important and underappreciated potential problem for transcriptome-wide structure-probing studies. Mapping our data to the RefSeq transcriptome would have resulted in an absence of reads, and therefore an ab-sence of reverse transcriptase stops, in the 5′UTR regions included in the RefSeq database, but not actually present in MCF7 cells. These regions would therefore appear as highly protected and thus highly structured had the RefSeq database been utilized. Furthermore, they would
(See figure on previous page.)
appear equally protected in both control and hipp-treated samples, which would therefore be wrongly interpreted as being equally structured under both conditions.
Currently, it is unclear whether hipp acts equally to re-press eIF4A within the eIF4F complex or free eIF4A.
Given that we chose the IC50concentration of hipp, and
that cellular levels of eIF4A are roughly ten times higher than the eIF4F complex [18], it is possible that we are predominantly targeting one of these populations of eIF4A, which could have important implications for the interpretations of this data.
One explanation for the positional bias of increased
lo-calized structures in the 5′UTRs of eIF4A-dependent
mRNAs is that structures involving sequence elements
on both sides of the 5′UTR and CDS junction could be
the most highly repressive to translation. Indeed, a re-cent study using a reconstituted system purified from yeast found that structures on both sides of the start codon were synergistically repressive to ribosome re-cruitment [17]. However, the lack of increased structure in 4A-dep mRNAs following eIF4A inhibition immedi-ately 3′of the start codon (Fig.6e and Additional file1: Figure S7D) would not be consistent with this.
Conclusions
Our structural data support a model in which the helicase activity of eIF4A is required throughout the 5′UTR during scanning. The lack of structural changes at the extreme 5′ end of the 5′UTR is consistent with a global helicase-independent role of eIF4A in ribosome recruitment. We
find that localized eIF4A-mediated unwinding of 5′UTR
structure is accompanied by the compensatory folding of alternative structures elsewhere in the region. Crucially, however, following eIF4A inhibition the greatest increases in structure occur just upstream of the CDS (Fig.1c). We show that the increased length of 5′UTRs seen in eIF4A-dependent mRNAs is associated with larger localized gains in structure following eIF4A inhibition, but it is only when these structural elements are located adjacent to the CDS that they confer greater dependence on eIF4A activity (Figs.4d and5g). This is further supported by the observa-tion that highly translated mRNAs are less structured than translationally repressed mRNAs in this same region (Fig.2e), and we eliminate the possibility that these ob-servations are due to translation elongation through
uORFs (Additional file 1: Figure S5G-H, S6B and
S7E-F). We also demonstrate that the pattern of reactivity changes we observe following hipp treatment are not
caused by reduced eIF4A binding (Fig. 1d), and we
eliminate the possibility that the ribosome could pro-tect from DMS reactivity (Fig.1e).
In summary, upon globally mapping changes in RNA structure following eIF4A inhibition, we find that 5′UTRs are generally remodeled, with eIF4A-dependent mRNAs
gaining most in localized structure just upstream of the CDS. We propose that increased structure potential at the 3′end of the 5′UTR is a key determinant of preferential gene expression in conditions of elevated eIF4A activity as seen in cancer cells [4].
Methods Cell culture
MCF7 cells were grown in DMEM, high glucose, Gluta-MAX Supplement, pyruvate (ThermoFisher 31966-021), supplemented with 10% FCS. Cells were tested regularly for mycoplasma and were authenticated by Eurofins using PCR-single-locus-technology.
35S Protein labeling
2.25 × 10⁵ MCF7 cells were seeded in 12-well plates
overnight. Medium was replaced with DMEM lacking methionine and cysteine (ThermoFisher 21013024), sup-plemented with 1% glutamine and 10% FCS with the relevant concentration of hippuristanol. After 30 min,
4.5μl EasyTag Express 35S Protein Labeling Mix (11
mCi/ml) (PerkinElmer NEG772002MC) was added to each well and incubated for a further 30 min at 37 °C. Cells were washed twice with ice-cold PBS and lysed in the wells with 200μl passive lysis buffer for 5 min on ice. Cells were scraped and pipetted into 1.5-ml centrifuge
tubes. Lysate was centrifuged at 12,000g for 5 min and
160μl supernatant pipetted into new tube. Ten microli-ters was used in Bradford assay to determine protein concentration, and the remaining 150μl was precipitated with 150μl 25% TCA on ice for 30 min. The precipitated lysate was loaded onto glass fiber Whatmann filters,
pre-wetted with 500μl 25% TCA, in a vacuum manifold, and
dried by vacuum. Filters were washed twice with ice-cold 70% IMS and twice with ice-ice-cold acetone, before thoroughly drying. Filters were placed into scintillation vials with the addition of 10 ml scintillation cocktail and counts per minute (cpm) measured using a scintillation counter. cpm were normalized by protein concentration.
DMS treatment
To ensure dimethyl sulphate (DMS) treatment was car-ried out under single hit kinetics, a range of concentra-tions of DMS was tested as in [63] (data not shown). Note that DMS is extremely toxic and all work should be carried out under appropriate safety measures [63].
and isopropanol precipitation. As poly(A) selection of RNA is sensitive to salt, RNA was then ethanol precipi-tated with 500 mM ammonium acetate. Integrity of RNA was checked on an Agilent 2100 Bioanalyzer with the Eukaryote Total RNA Nano assay, and RIN scores of 10 were obtained for every sample. To ensure single hit kin-etics, 2μg total RNA was used in a reverse transcription reaction using a 5′Cy5 labeled primer, specific for the
hu-man 18S rRNA: 5′CCAAAGGAACCATAACTGATT3′
and the resulting cDNA run on a sequencing gel (Add-itional file1: Figure S1D). Three biological replicates were obtained for each sample.
Structure-seq2 library preparation
Library preparation was essentially carried out as in [29] (Additional file1: Figure S1E) with details below.
Poly(A) selection
One hundred twenty-microgram total RNA per sample was subjected to two rounds of poly(A) selection with the Poly(A) Purist MAG Kit (AM1922), as per the manufac-turer’s instructions. Poly(A) RNA was dissolved in 17μl TE (10 mM Tris-HCl pH 7.5, 1 mM EDTA). One microliter was used to run on an Agilent 2100 Bioanalyzer with the
mRNA Nano assay to confirm removal of rRNA, and 1μl
was used to determine RNA concentration with a nano-drop. The remaining 15μl (typically slightly more than 1μg) was used in the following reverse transcription step.
Reverse transcription
For each sample, 1μg of poly(A) RNA was diluted to 15μl
and mixed with 2μl of the N6 linker oligo: 5′
CAGACGTGTGCTCTTCCGATCNNNNNN3′(100μM)
and 3μl KCl (1 M) and split between 2 × 10μl. RNA was denatured in a thermal cycler at 90 °C for 1 min before rapidly cooling to 4 °C and held for 1 min. Temperature was increased to 25 °C, and 4μl 5X buffer (100 mM Tris-HCl pH 8.4, 25 mM MgCl2, 25 mM DTT, 2.5 mM dNTPs), 5μl nuclease free water, and 1μl SuperScript III (200 U/μl) (Thermo Fisher 18080085) were added to each 10-μl sample. Samples were incubated for 5 min at 25 °C to promote annealing and to allow slight extension of RT primers, followed by 5 min at 42 °C for further extension and finally 55 °C for 50 min for full extension. Samples were then heated at 85 °C for 5 min to denature the en-zyme, followed by addition of 2μl NaOH (1 M) and incu-bation at 95 °C for 10 min to hydrolyze the RNA. Samples were purified by gel extraction with an 8% polyacrylamide, 1-mm-thick denaturing gel (see Gel Extraction). To en-sure maximal removal of the N6 linker, which can form an unwanted byproduct if not removed, cDNA running above an N78 ssDNA oligo was purified, which should run 50 nt higher than the N6 linker. cDNA was dissolved in 5.5μl Tris-HCl (pH 8.0).
Ligation
To the 5.5μl cDNA was added 0.5μl hairpin donor oligo /5Phos/TGAAGAGCCTAGTCGCTGTTCANNNNNN
CTGCCCATAGAG/3SpC3/ (400μM), 2μl betaine (5
M), and 8μl 50% PEG 8000 (added last and at room
temperature to avoid precipitating DNA). Samples were heated at 95 °C for 90 s and allowed to cool slowly to room temperature. Two microliter 10X T4 DNA ligase buffer and 2μl T4 DNA ligase (400 U/μl) (NEB M0202S) were added, and the samples were incubated at 16 °C for 6 h followed by 30 °C for 6 h and then 65 °C for 10 min to denature the enzyme. Samples were purified by gel extraction with a 6% polyacrylamide, 1-mm-thick de-naturing gel (see Gel Extraction) and cDNA running above an N118 ssDNA oligo was purified; this oligo should run 50 nt above any ligated N6 linker. Ligated cDNA was dissolved in 18μl Tris-HCl (pH 8.0).
PCR
To determine the number of PCR cycles required, 25μl
reactions were set up with 5μl taken from the samples at cycles 11, 14, 17, 20, and 23 and the amplified DNA was run on a 5% polyacrylamide denaturing gel. Reactions were set up with 5μl 5X Q5 buffer, 5μl GC rich enhancer buffer,
0.5μl dNTPs (10 mM each), 0.25μl Q5 Hot Start
High-Fidelity DNA Polymerase (2000 U/ml) (NEB M0493 L), 1μl
Truseq forward primer: 5′
AATGATACGGCGACCACC-
GAGATCTACACTCTTTCCCTACACGACGCTCTTCC-GATCTTGAACAGCGACTAGGCTCTTCA3′ (10μM),
1μl relevant Truseq reverse primer: 5′CAAGCAGAAGAC
GGCATACGAGATBARCODEGTGACTGGAGTTCAGA
CGTGTGCTCTTCCGATC3′ (10μM), 4.5μl ligated cD
NA, and 7.75 water.
Sample Repeat BARCODE
Control/DMS(−) A 5′CGTGAT3′
Control/DMS(+) A 5′ACATCG3′
Hippuristanol/DMS(−) A 5′GCCTAA3′ Hippuristanol/DMS(+) A 5′TGGTCA3′
Control/DMS(−) B 5′CACTGT3′
Control/DMS(+) B 5′ATTGGC3′
Hippuristanol/DMS(−) B 5′GATCTG3′ Hippuristanol/DMS(+) B 5′TCAAGT3′
Control/DMS(−) C 5′CTGATC3′
Control/DMS(+) C 5′AAGCTA3′
Hippuristanol/DMS(−) C 5′GTAGCC3′ Hippuristanol/DMS(+) C 5′TACAAG3′
cycle where the product was visible on the gel. The remaining samples were amplified in 3 × 25μl reactions as above, for 17 cycles plus a final extension time of 5 min at 72 °C, and then combined and gel purified on a 5% polyacrylamide, 1.5-mm-thick denaturing gel. Resultant PCR products running between ~ 200 and 600 nt, as determined with ss50 ladder (Simplex Sciences), were purified and dissolved in 20μl Tris-HCl (pH 8.0). Samples were run on an Agilent 2100 Bioanalyzer with the high sensitivity DNA assay to ensure the size of the libraries was as expected with minimal by-product contamination.
Gel extraction
An equal volume of 2X loading buffer (95% formamide, 20 mM Tris HCl (pH 7.5), 20 mM EDTA, 0.025% bromophenol blue and xylene cyanol) was added, and DNA was denatured at 98 °C for 5 min prior to loading onto a 8.3 M urea polyacrylamide gel (22 cm long, pre-run for 2 h at 18 W so that the temperature of gel was between 50 and 60 °C). The gel was run at 18 W for 2 h for the post-RT and post-ligation gels and until the xylene cyanol was close to the bottom for the post-PCR gel. Following the run, the gel was carefully placed onto a piece of Saran wrap and stained with 50 ml 1X TE, 1X SybrGold (S11494) for 10 min in a plastic tray, wrapped in alumin-ium foil. The staining solution was removed, and another layer of Saran wrap was placed on top of the gel, and the DNA was visualized on a Safe Imager 2.0 Blue Light Transilluminator. The region to cut was drawn on the Sa-ran wrap with a marker pen. The gel was then cut with a clean razor blade and placed in a 5-ml DNA LoBind Eppendorf tube. To break the gel into tiny pieces, a needle was used to make a hole in the bottom of the tube and the gel was forced through the hole into another 5-ml tube by centrifugation at 6000gfor 5 min. Three milliliter TEN250 (1X TE, 250 mM NaCl) was then added and pipetted into a 50-ml DNA LoBind Eppendorf tube. Another 3 ml
TEN250 was added, and the slurry was incubated in a
shaking incubator at 220 rpm at 37 °C for at least 24 h. This crush and soak method was found to be essential for sufficient extraction of the DNA from the gel.
Following incubation, the slurry was briefly spun down and as much of the liquid was pipetted off and filtered
through Spin-X Centrifuge Tube Filters (0.22μm Pore
CA Membrane). Samples were then precipitated with
the addition of 1μl GlycoBlue and an equal volume of
isopropanol overnight at room temperature in 5 ml DNA LoBind tubes. The DNA was pelleted by
centrifu-gation at 12,000g and washed twice with 70% ethanol
and dissolved in Tris-HCl pH 8.0.
Sequencing and bioinformatic pipeline
Libraries were sequenced by the DNA Sequencing Facility at the Dept of Biochemistry, University of
Cambridge, on a NextSeq 500. Concentrations of final libraries were determined by the facility using qPCR, and equal concentrations of each sample were pooled together and sequenced on three high output runs of 150 cycles, single-ended. A custom sequencing primer
was used: 5′
TCTTCCGATCTTGAACAGCGACTAG-GCTCTTCA3′to avoid low diversity at the start of the
sequencing run, resulting in the nucleotide directly adja-cent to the DMS-modified nucleotide being the first nucleotide sequenced. 1,268,740,434 reads were obtained in total. The raw sequencing reads are available at the Gene Expression Omnibus (GEO) database accession GSE134865 in fastq format.
Sequencing reads were processed and analyzed using the StructureFold2 bioinformatic pipeline [34].
The fastq_trimmer.py script was used to remove 5′
and 3′ adapters, to trim bases from the 3′ end with a
NextSeq quality score below 30 and to remove any reads that were less than 20 nt after trimming. This script uses cutadapt (version 1.14) [64]. Ninety-nine percent of reads passed the filtering following trimming.
The fastq_mapper.py script was used to map all trimmed reads to the MCF7-specific transcriptome (see below) using bowtie2 (version 2.3.2) [65]. A summary of mapped reads is
in Additional file 1: Table S1. Overall, 89.1% of reads
mapped to the transcriptome, of which 86.1% mapped to more than one location and 13.9% mapped uniquely. The high percentage of multi-mapped reads is primarily due to transcript variants, as mapping to a transcriptome created by selecting the longest transcript per gene resulted in 75.4% reads mapping, of which only 20.8% were multi-maps. We therefore allowed multi-mapped reads and all downstream analysis was carried out at the gene level by selecting the most abundant transcript per gene, based on our RNA-Seq data. Although we cannot rule out that some genes with several abundant isoforms may have different folds, this is unlikely to affect the results, especially when looking at reactivity in the 5′UTRs, as the sequence of these regions is less often altered between splice variants,
com-pared to CDSs and 3′UTRs. To test how many genes had
more than one relatively abundant transcript, we assessed the percentage of reads predicted to map to the most abun-dant transcript per gene, based on our total RNA-Seq data. Of the 1266 genes analyzed in Fig.1c, 391 genes have more than one splice variant. For 75% of these 391 genes, 67.8% of the reads that map to that gene are predicted to arise from the most abundant transcript, and for 25% of these genes, 98.2% of the reads are predicted to arise from the most abundant transcript.
The sam_filter.py script was used to filter any mapped reads that contain more than 4 mismatches or that have a mismatch at position 1, which could have resulted from
the addition of a random nt to the 3′end of the cDNA
reads were retained after filtering for Control/DMS (−), Control/DMS (+), Hippuristanol/DMS (−), and Hippur-istanol/DMS (+) samples, respectively. The script also uses Samtools (version 0.1.19) [66] to remove any un-mapped reads or reads that have un-mapped in the reverse orientation.
The sam_to_rtsc.py script was used to generate <.rtsc> files from each filtered <.sam> file generated in the previous step. Each <.rtsc> file contains the number of reverse transcriptase stops at each position of every transcript. All replicate <.rtsc> files are available as supplemental files for GSE134865. Replicate correlation was calculated using the rtsc_correlation.py script followed by the Replicate_correlation.R script.
The coverage of every transcript was calculated for every replicate from each of the DMS (+) <.rtsc> files, using the rtsc_coverage.py script. Coverage is calculated as the number of stops at every adenine or cytosine within the transcript, divided by (the length of the transcript × AC content of the transcript). For example if a transcript was 2000 nt long and had 50% AC content, it would have a coverage of 1 if there were 1000 stops at all A and C positions within the transcript. Transcripts were filtered by coverage with a threshold of 1 in every replicate. Of the 55,770 transcripts in the MCF7-specific transcriptome, 26,820 had a coverage of 1 or higher in every replicate from the control and
hip-puristanol DMS (+) samples. 5′end coverage was
calcu-lated with the rtsc_end_coverage.py script, using the equation in Additional file1: Figure S3B. All transcripts with a 5′end coverage score less than 1.5, withnset to 10, were removed prior to analysis. Of the 55,770 tran-scripts in the MCF7-specific transcriptome, 26,393 had a 5′coverage of 1.5 or higher in both the control and hip-puristanol DMS (−) samples. One hundred twenty-five
nucleotides was trimmed from the 3′end of transcripts
before any analyses. This was determined by the analysis
carried out in Additional file 1: Figure S3C using the
rtsc_end_coverage.py script.
The specificity and ligation bias of each sample was
calculated using the rtsc_specificity.py and check_
ligation_bias.py scripts respectively, and the plots were generated using the Specificity_and_ligation_bias.R script.
The rtsc_to_react.py script was used to generate <.react> files for each replicate under each condition. The script uses a DMS(−) and DMS(+) <.rtsc> file to generate a <.react> file which contains the normalized reactivity for every A and C within every transcript, as in [29]. The script either generates a <.scale> file or requires one as input. The <.scale> generated for control A was therefore used for every other replicate and condition so that the scaling was the same for every sample. All replicate <.react> files are available as supplemental files for GSE134865. The reactivity in control and hippuristanol samples was then
averaged across the replicates using the react_average.py script. The <.react> files generated were split into 5′UTR,
CDS, and 3′UTR regions using the same coordinates
calculated to divide the <.FASTA> file (see below).
dStruct analysis
dStruct [50] analysis was performed with the following options: reps_A = 3, reps_B = 3, min_length = 10, batches = T, check_signal_strength = T, check_nucs = T, check_quality = T in R with the dStruct. R script. Reactivities for full-length transcripts were used, and each window was assigned its location subsequently.
RNA folding predictions
RNA sequences were folded using the batch_fold.py script which uses RNAstructure (version 6.1) [67]. Default settings were used with control and hippuristanol reactivities as restraints.
Polysome profiling
Fifteen-centimeter plates with 70–80% confluent MCF7
cells were treated for 1 h with 150 nM hippuristanol or
an equal concentration of DMSO (0.07%) by
replenishment of medium. Cells were treated for 5 min
with 100μg/ml cycloheximide at 37 °C before being
washed with ice-cold PBS containing 100μg/ml
cyclo-heximide. Cells were collected by gentle scraping and
then lysed in 500μl lysis buffer (15 mM Tris-HCl pH
7.5, 300 mM NaCl, 15 mM MgCl2, 2 mM DTT, 100μg/
ml cycloheximide, 1% Triton X and 1000 U/ml Supera-seIn (AM2694)) for 1 min on ice. Lysate was centrifuged
at 12,000g for 1 min at 4 °C and the supernatant
col-lected. Four hundred microliters was loaded onto a 10–
50% sucrose density gradient (15 mM Tris-HCl pH 7.5,
300 mM NaCl, 15 mM MgCl2, 2 mM DTT, and 100μg/
ml cycloheximide) and centrifuged in a pre-cooled ultra-centrifuge with the SW40 Ti rotor at 38,000 rpm for 2 h at 4 °C. For total RNA samples, 50μl lysate was added to 1 ml TRIzol and the RNA extracted as per the
manufac-turer’s instructions. Gradients were fractionated and
11 × 1 ml fractions were collected and the RNA precipi-tated overnight at−20 °C following the addition of 3 ml guanidine HCl (7.7 M) and 4 ml 100% ethanol. Precipi-tated RNA was dissolved in 350μl TE buffer and ethanol
precipitated with 500 mM ammonium acetate and 1μl
GlycoBlue. RNA was then dissolved in 30μl Tris-HCl
pH 7.5, and concentrations were determined with the
nanodrop. Equal volumes of RNA from fractions 1–5
and 6–11 were each pooled to form the sub-polysomal