R E S E A R C H
Open Access
Benchmarking transposable element
annotation methods for creation of a
streamlined, comprehensive pipeline
Shujun Ou
1, Weija Su
2, Yi Liao
3, Kapeel Chougule
4, Jireh R. A. Agda
5, Adam J. Hellinga
5,
Carlos Santiago Blanco Lugo
5, Tyler A. Elliott
5, Doreen Ware
4,6, Thomas Peterson
2, Ning Jiang
7*,
Candice N. Hirsch
8*and Matthew B. Hufford
1*Abstract
Background:Sequencing technology and assembly algorithms have matured to the point that high-quality de novo
assembly is possible for large, repetitive genomes. Current assemblies traverse transposable elements (TEs) and provide an opportunity for comprehensive annotation of TEs. Numerous methods exist for annotation of each class of TEs, but their relative performances have not been systematically compared. Moreover, a comprehensive pipeline is needed to produce a non-redundant library of TEs for species lacking this resource to generate whole-genome TE annotations.
Results:We benchmark existing programs based on a carefully curated library of rice TEs. We evaluate the performance of methods annotating long terminal repeat (LTR) retrotransposons, terminal inverted repeat (TIR) transposons, short TIR transposons known as miniature inverted transposable elements (MITEs), and Helitrons. Performance metrics include sensitivity, specificity, accuracy, precision, FDR, andF1. Using the most robust programs, we create a comprehensive pipeline called Extensivede-novoTE Annotator (EDTA) that produces a filtered non-redundant TE library for annotation of structurally intact and fragmented elements. EDTA also deconvolutes nested TE insertions frequently found in highly repetitive genomic regions. Using other model species with curated TE libraries (maize and Drosophila), EDTA is shown to be robust across both plant and animal species.
Conclusions:The benchmarking results and pipeline developed here will greatly facilitate TE annotation in eukaryotic genomes. These annotations will promote a much more in-depth understanding of the diversity and evolution of TEs at both intra- and inter-species levels. EDTA is open-source and freely available:https://github.com/oushujun/EDTA.
Keywords:Transposable element, Annotation, Genome, Benchmarking, Pipeline
Background
Transposable elements (TEs) are repetitive, mobile sequences found in most eukaryotic genomes analyzed to date. Originally discovered by Barbara McClintock in maize (Zea mays) [1], TEs are now known to comprise the majority of genetic material in many eukaryotic genomes. For example, TEs make up nearly half of the
human (Homo sapiens) genome [2] and approximately 85% of the genomes of wheat (Triticum aestivum) and maize [3, 4]. The functional and evolutionary signifi-cance of TEs has also become increasingly clear. Stow-away and PIF/Harbinger transposons in rice (Oryza sativa), for instance, are associated with subspecies-specific hotspots of recombination [5], and subspecies-specific TE insertions have been associated with plant architecture [6] and flowering time [7] in maize, generating pheno-typic variation important during domestication and tem-perate adaptation.
Despite their prevalence and significance, TEs have remained poorly annotated and studied in all but a few model systems. Transposable elements create a
© The Author(s). 2019Open AccessThis article is distributed under the terms of the Creative Commons Attribution 4.0 International License (http://creativecommons.org/licenses/by/4.0/), which permits unrestricted use, distribution, and reproduction in any medium, provided you give appropriate credit to the original author(s) and the source, provide a link to the Creative Commons license, and indicate if changes were made. The Creative Commons Public Domain Dedication waiver (http://creativecommons.org/publicdomain/zero/1.0/) applies to the data made available in this article, unless otherwise stated. * Correspondence:[email protected];[email protected];
7Department of Horticulture, Michigan State University, East Lansing, MI
48824, USA
8
Department of Agronomy and Plant Genetics, University of Minnesota, Saint Paul, MN 55108, USA
1Department of Ecology, Evolution, and Organismal Biology, Iowa State
University, Ames, IA 50011, USA
particularly challenging genome assembly problem due to both their high copy number and the complex nesting structures produced by new TE insertions into existing TE sequences. While the low-copy, genic fraction of ge-nomes has assembled well, even with short-read sequen-cing technology, assemblies of TEs and other repeats have remained incomplete and highly fragmented until quite recently.
Long-read sequencing (e.g., PacBio and Oxford Nano-pore) and assembly scaffolding (e.g., Hi-C and BioNano) techniques have progressed rapidly within the last few years. These innovations have been critical for high-quality assembly of the repetitive fraction of genomes. In fact, Ou et al. [8] demonstrated that the assembly contigu-ity of repetitive sequences in recent long-read assemblies is even better than traditional BAC-based reference genomes. With these developments, inexpensive and high-quality assembly of an entire genome is now possible. Knowing where features (i.e., genes and TEs) exist in a genome assembly is important information for using these assemblies for biological findings. However, unlike the relatively straightforward and comprehensive pipelines established for gene annotation [9–11], current methods for TE annotation can be piecemeal, can be inaccurate, and are highly specific to classes of transposable elements.
Transposable elements fall into two major classes. Class I elements, also known as retrotransposons, use RNA in-termediates in their“copy and paste”mechanism of trans-position [12]. Class I elements can be further divided into long terminal repeat (LTR) retrotransposons, as well as those that lack LTRs (non-LTRs), which include long in-terspersed nuclear elements (LINEs) and short inter-spersed nuclear elements (SINEs). Structural features of these elements can facilitate automated de novo annota-tion in a genome assembly. For example, LTR elements have a 5-bp target site duplication (TSD), while non-LTRs have either variable length TSDs or lack TSDs entirely, be-ing instead associated with deletion of flankbe-ing sequences upon insertion [13]. There are also standard terminal se-quences associated with LTR elements (i.e., 5′-TG…C/G/ TA-3′for LTR-Copiaand 5′-TG…CA-3′for LTR-Gypsy elements), and non-LTRs often have a terminal poly-A tail at the 3′end of the element (see [14] for a complete de-scription of structural features of each superfamily).
The second major class of TEs, Class II elements, also known as DNA transposons, use DNA intermediates in their“cut and paste” mechanism of transposition [15]. As with Class I elements, DNA transposons have superfamily-specific structural features that can be used to facilitate an automated identification process [16]. For example,hAT el-ements typically have an 8-bp TSD, 12–28-bp terminal inverted repeat sequence (TIRs) and contain 5′-C/TA… TA/G-3′terminal sequences. Each Class II superfamily has different structural features that need to be considered
when TE annotation programs are being developed and de-ployed [16,17].Helitronsare a unique subclass of Class II elements that replicate through a rolling-circle mechanism and, as such, do not generate a TSD sequence and do not have TIRs, but do have a signature 5′-TC…CTRR-3′ ter-minal sequence and frequently a short GC-rich stem-loop structure near the 3′end of the element [16,18,19].
High-quality TE annotations have been generated for several model species through extensive community efforts and manual curation (e.g., human [2],Drosophila melano-gaster [20], Arabidopsis thaliana [21], rice [22, 23], and maize [4]). However, with numerous reference genome as-semblies being generated both within and across species, large-scale manual curation is no longer feasible, and auto-mated annotation of TEs is required. Dozens of programs have been developed for this purpose, and these generally fall into one of three categories [24, 25]. First, general repeat finders identify high copy number sequences in a genome [26–28]. These programs can have high sensitivity for identifying repetitive sequences, but have limited ability to classify them into specific TE superfamilies and can mis-identify non-TE features (e.g., high copy number genes). Second, the sequence homology approach [29–32] is quick and takes advantage of prior knowledge (i.e., databases), but is limited by the depth and accuracy of this knowledge and variability across TE sequences. The final approach takes advantage of the structural makeup of classes and superfamilies of TEs for de novo structural annotation [24, 25]. This approach is advantageous in that it is codable and does not rely on repeat databases, therefore being ideal for newly assembled species. However, the approach is lim-ited by the knowledge of the sequence structure of TEs and is often characterized by a high false discovery rate.
While numerous and, in some cases, redundant TE iden-tification methods exist, their performance has not been comprehensively benchmarked, despite recognition that this would be an important exercise [33]. Here, we have gathered a broad set of existing TE annotation software and, using several metrics, have compared each program’s performance to a highly curated TE reference library in rice [34]. Based on our benchmarking results, we propose a comprehensive pipeline for the generation of de novo TE li-braries that can then be used for genome annotation. Exist-ing curated TE libraries can also be integrated into this pipeline to create an expanded library with new TE exemplars.
Results
in the library are then used to detect fragmented and mu-tated TE sequences that are not recognizable using struc-tural features. Importantly, if there are errors in the annotation library, these will be propagated during the whole-genome annotation process. We have benchmarked commonly used programs for metrics including sensitiv-ity, specificsensitiv-ity, accuracy, and precision (Fig.1). To evaluate each program, we used a high-quality, manually curated library developed for the model species Oryza sativa (rice), which has a long history of TE discovery and an-notation [23, 35–43]. The optimal set of programs de-termined by this benchmarking have been combined into a comprehensive pipeline called the Extensive de-novo TE Annotator (EDTA) [34]. Additionally, the ro-bustness of this pipeline was validated across maize and Drosophila for which high-quality, manually curated TE libraries were available [34].
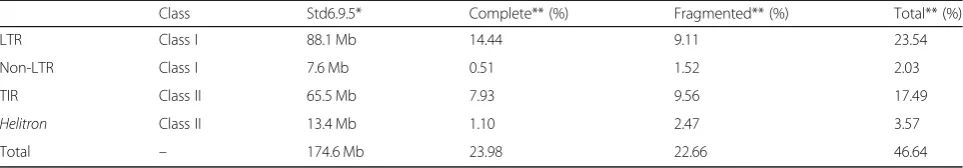
Setting up a reference annotation for benchmarking The reference annotation library for rice was created through substantial manual curation of repeat families ob-tained from an all-versus-all BLAST search of the rice genome (details in the“Methods”section). This curated li-brary was then used to annotate the rice genome for both structurally intact and fragmented TE sequences, which comprised 23.98% and 22.66% of the rice genome, respect-ively (46.64% in total; Table1). Since half of all TEs in the rice genome are fragmented, structural annotation alone would miss a substantial portion of TE sequences. Thus, a
homology-based approach that uses a TE library is neces-sary to obtain a complete annotation. In this study, the whole-genome TE annotation based on the curated library was used as the ground-truth annotation for benchmark-ing of TE annotation programs.
TEs in this curated library are broken down into a num-ber of non-overlapping categories, including LTR (referring to LTR retrotransposons), non-LTR (including SINEs and LINEs), TIR (referring to DNA transposons with TIRs, in-cluding MITEs), Helitron, and non-TE repeat sequence. LTR retrotransposons contribute the largest component, 23.54% of the total genomic DNA (Table1). Non-LTR ret-rotransposons including SINEs and LINEs contribute the smallest proportion of total sequence (7.6 Mb or ~ 2% of the genome; Table1). DNA transposons contribute ~ 21% (17.49% TIR elements and 3.57%Helitrons; Table1).
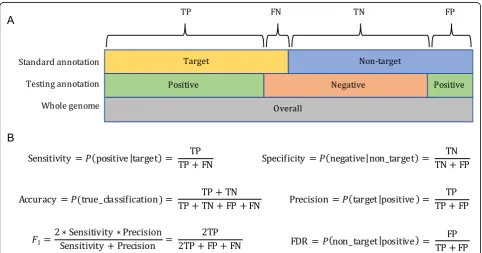
To test various programs, the genome was partitioned into target and non-target sequences (Fig. 1a). For ex-ample, when testing the performance of an LTR annota-tion program, predicted LTR sequences matching our curated library were labeled “target” and all other sequences were labeled “non-target.” Each program’s annotation was then compared to that from our curated library, with sequences included in our target subset counted as true positives (TP), sequences in our non-target subset categorized as false positives (FP), missed targets counted as false negatives (FN), and the remain-der of the genome (not TP, FP, nor FN) labeled as true negative (TN; Fig.1a).
[image:3.595.57.540.442.695.2]We then used six metrics (sensitivity, specificity, accur-acy, precision, FDR, andF1) to characterize the annotation
performance of the test library created by various pro-grams (Fig. 1b). These metrics were calculated based on the total number of genomic DNA bases, because misan-notations occurring in the test library will be amplified in the whole-genome annotation process.Sensitivitydenotes how well the test library can correctly annotate target TE sequences. Specificity describes how well the test library can correctly exclude non-target sequences.Accuracy de-notes the true rate in discriminating target and non-target sequences.Precisionis the true discovery rate, whileFDR is the false discovery rate. Finally, the F1 measure is the
harmonic mean of precision and sensitivity; F1is similar
to accuracy, but is useful because it does not require an estimate of TN, which can be difficult to quantify. While we can estimate TNs with the use of the curated annota-tion, we still include theF1measure in our study to allow
for comparison to previous work.
We exhaustively searched the literature for open-source programs and databases that have been developed for gen-eral repeat annotations as well as structural annotation programs for LTR elements, SINEs, LINEs, TIR elements, andHelitrons. We applied educated parameters based on knowledge of transposon structures to run these programs (see the“Methods”section and Additional file1). We also applied filters on initial program predictions to remove low-quality candidates and potentially false predictions such as short sequences and tandem-repeat-containing se-quences (Additional file 1). For each program, a non-redundant test library was created from filtered TE candi-dates, which was then used to annotate the rice genome. The annotation from each program for each category of TEs was compared with those from the curated library for calculation of benchmarking metrics.
Comparison of general repeat annotators
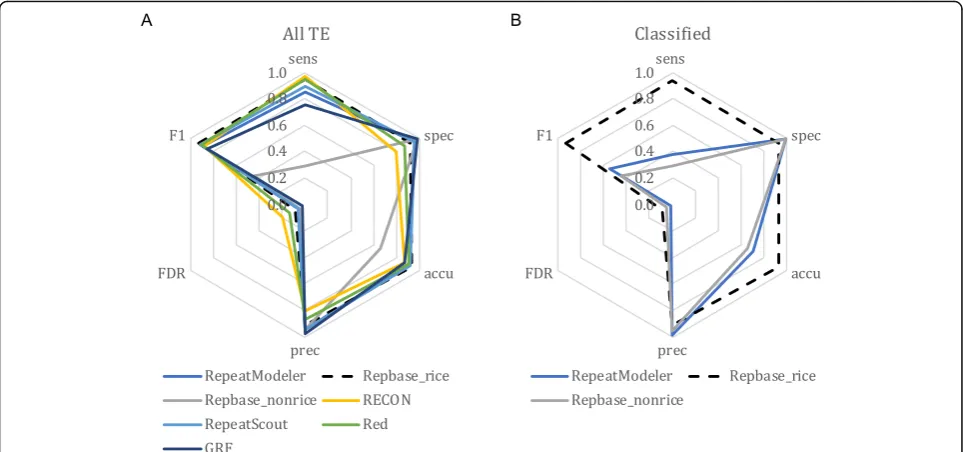
We benchmarked five general repeat annotators, including RECON [44], RepeatScout [26], RepeatModeler [28], Red [27], and Generic Repeat Finder (GRF) [45], as well as a repeat database Repbase [30], which is widely used as the default library in RepeatMasker [29]. For these TE annota-tion approaches, only RepeatModeler and Repbase provide
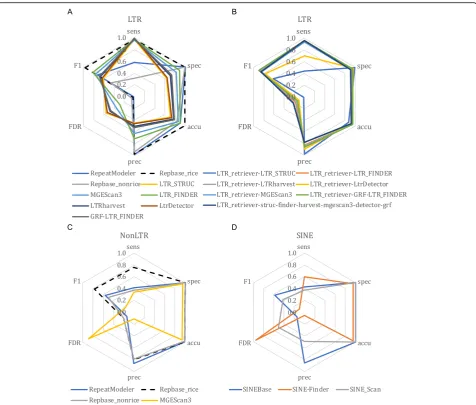
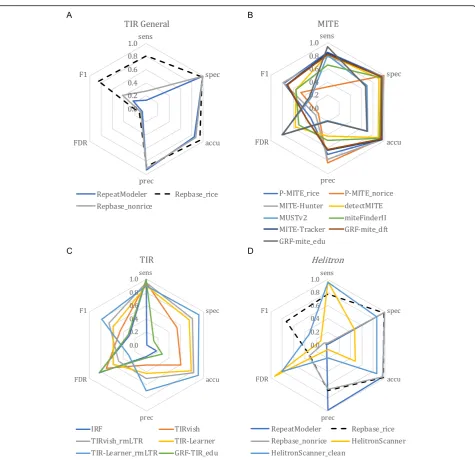
classification of TE annotations. Among these methods, we found that Repbase employing the rice TE database had very high performance in both TE identification and classification (Fig.2), which is a product of continuous im-provement and curation of rice TEs by the community. However, if we exclude rice-related TEs in Repbase and treat rice as a newly sequenced species (Repbase_norice in Fig.2), the annotation (Fig.2a) and classification (Fig.2b) sensitivity both drop from ~ 94 to ~ 29%, despite ex-tremely high specificity (~ 99%) and low FDR (~ 5%; Add-itional file 2: Table S1A). This result was consistent for each of the TE classes (Fig.3a—LTR elements; Fig. 3c— non-LTR elements; Fig.4a—TIR elements; Fig. 4d—Heli-tron), though the drop in sensitivity was substantially greater for Helitrons (dropped from 78 to 3%) than for other elements. For TE classifications, RepeatModeler per-formed similarly to Repbase without rice sequences (Fig.2b), and both can, therefore, be used as high-quality supplements to other specialized TE annotators. GRF is the most recently developed general repeat finder. It had the lowest sensitivity (75%; Fig.2a; Additional file2: Table S1A), which is likely due to its inability to introduce gaps during the multiple sequence alignment process [45].
[image:4.595.57.539.99.183.2]Overall, the general repeat finders we tested have consist-ently high performance in identifying repetitive sequences in the rice genome, with the exception of Repbase without rice sequences (Fig. 2a). What really differentiates these programs is their ease in processing raw results. All are open source and easy to install except Repbase (Add-itional file2: Table S2), which requires an institutional sub-scription for access. Red runs on a single CPU and took the shortest time for execution (~ 33 min); however, Red pro-duced the largest raw result file, which is highly redundant (35 Mb after clustering; Additional file2: Table S2). Repeat-Modeler and RepeatScout produced very compact outputs (< 4 Mb). The RepeatScout program runs more efficiently but provides no classification of repeat sequences (Add-itional file 2: Table S2). The RECON and RepeatScout packages are not actively maintained, but have been incor-porated into the RepeatModeler package. In summary, RepeatModeler has the highest performance among the general repeat annotators based on our evaluation metrics (Fig. 2) and is open source, able to produce a compact
Table 1TE content in the rice (Oryza sativa ssp. japonicacv.“Nipponbare”v. MSU7) genome
Class Std6.9.5* Complete** (%) Fragmented** (%) Total** (%)
LTR Class I 88.1 Mb 14.44 9.11 23.54
Non-LTR Class I 7.6 Mb 0.51 1.52 2.03
TIR Class II 65.5 Mb 7.93 9.56 17.49
Helitron Class II 13.4 Mb 1.10 2.47 3.57
Total – 174.6 Mb 23.98 22.66 46.64
*Annotation based on the curated library (v6.9.5)
output, and able to classify TE families to some degree. Still, further classification or use of more specialized software based on the specific structures of each superfamily of TEs is necessary to achieve more accurate annotations.
Comparison of LTR annotators
LTR retrotransposons have received the most attention in TE annotation software development due to their abun-dance in eukaryotic genomes. In addition to the two gen-eral repeat identification methods with classification (RepeatModeler and Repbase), we found seven structure-based methods that are specifically designed for de novo LTR identification. Chronologically in order of develop-ment, they are LTR_STRUC [46], LTR_FINDER [47], LTRharvest [48], MGEScan3 [49], LTR_retriever [40], LtrDetector [50], and GRF [45]. In a previous study [40], we developed LTR_retriever and compared its perform-ance to LTR_STRUC, LTR_FINDER, LTRharvest, and MGEScan_LTR [51]. Here, we update the comparison with the recently developed MGEScan3, LtrDetector, and GRF. Meanwhile, the LTR_retriever package has been up-dated from v1.6 to v2.7 since its initial publication.
The six structure-based methods that we tested all had very high sensitivity (> 96%) but also high FDR (28–55%); specificity, accuracy, andF1measures were also somewhat
suboptimal (Fig. 3a). Among these six methods, LTR_ FINDER demonstrated the best balance of performance across metrics followed by MGEScan3 (Fig.3a). However, it runs slowly partly because it is single-threaded. For fas-ter execution of LTR_FINDER, we developed LTR_ FINDER_parallel that splits chromosome sequences into
shorter segments and executes LTR_FINDER in parallel [52]. We used LTR_FINDER_parallel for all related ana-lyses in this study.
LTR_retriever does not have its own search engine; rather, it was designed as a stringent filtering method for raw results of other LTR programs. LTR_retriever can process results of all six aforementioned LTR methods or any combination of them. We used LTR_retriever in conjunction with each of the six programs and with all six programs together to benchmark its performance. Our re-sults show that LTR_retriever has consistently high speci-ficity (94.8% ± 3%), accuracy (92.2% ± 3%), precision (84.9% ± 7%), andF1measure (82.4% ± 10%) and relatively
low FDR (15.1% ± 7%) (Fig. 3b; Additional file 2: Table S1B). The sensitivity of LTR_retriever is also high (≥93%), except when used in combination with LTR_STRUC and LtrDetector (Fig.3b; Additional file2: Table S1B). This is due to the imprecisely defined sequence boundaries of LTR candidates of these two methods, preventing LTR_ retriever from finding microstructures like TSD and terminal motifs [40], yielding a high false negative rate.
Overall, LTR_retriever represents the best compromise between sensitivity and specificity. LTR_retriever also generated the most compact LTR library in comparison to the other programs (Additional file 2: Table S2), allowing efficient and precise whole-genome LTR anno-tations. It is not necessary to run all six structure-based programs along with LTR_retriever. Instead, the com-bination of LTR_FINDER and LTRharvest with LTR_re-triever achieved the best performance and the shortest processing time as previously demonstrated [40].
[image:5.595.57.539.88.314.2]Comparison of non-LTR annotators
Non-LTR retrotransposons include LINEs and SINEs that propagate via reverse transcription of RNA intermediates [16]. Identification of non-LTR retrotransposons is very challenging due to the lack of a terminal repeat structure and also their sequences often degenerate quickly [32]. In addition to the general repeat annotators described above, we also benchmarked a dedicated database for SINEs (SINEBase) and three structure-based methods.
SINEBase [32] is a species-agnostic database that per-formed poorly in terms of sensitivity, similar to the non-rice Repbase library (Fig. 3d). The specialized structure-based annotation methods, including MGEScan3, SINE-Finder,
and SINE_Scan also exhibited suboptimal sensitivity (< 60%) and very high FDRs (51–95%) (Fig. 3; Additional file 2: Table S1C). SINE_Scan is a successor of SINE-Finder, which aims to detect all known types of SINEs with higher accur-acy [53]. Based on our results, SINE_Scan did have a much lower FDR compared to SINE-Finder; however, its sensitiv-ity was also much lower (Fig.3d).
The possibility remains that SINEs are under-annotated in the curated library, which may contribute to the high FDR values that were observed across programs. To test the validity of these SINE candidates, we followed the instructions in the SINE_Scan package and manually inspected terminal alignments of all candidate SINE
[image:6.595.60.537.86.491.2]families (n= 35). Out of 35 candidate families, we found six longer than 99 bp that possess clear sequence boundaries with poly-A or poly-T tails. These six families were already present in the curated library, indicating the high FDR is a product of false discovery rather than a limitation of the cu-rated library being used to evaluate these programs.
In summary, we found general methods such as RepeatModeler, the non-rice Repbase, and SINEBase provided high-quality annotations for non-LTR retro-transposons, while structure-based methods such as
MGEScan3, SINE-Finder, and SINE_Scan have low sen-sitivity and high rates of false discovery. Therefore, re-searchers may want to use RepeatModeler for de novo annotation of non-LTR elements, and supplement these annotations with SINEBase or Repbase.
Comparison of TIR annotators
TIR transposons are a subclass of TEs that carry inverted repeats at their ends [16]. Miniature inverted transposable elements (MITEs) are a special kind of TIR
[image:7.595.61.537.83.543.2]transposon that lack any coding potential (non-autono-mous) and are usually shorter than 600 bp [16]. These elements are highly abundant in eukaryotic genomes, and many annotation programs have been designed for their identification. We tested P-MITE [31], a specialized database of curated plant MITEs; IRF [54], TIRvish [55], TIR-Learner [17], and GRF (grf-main -c 0) [45], which structurally identify TIR elements; and finally MITE-Hunter [56], detectMITE [57], MUSTv2 [58], miteFin-derII [59], MITE-Tracker [60], and GRF (grf-mite), which structurally identify MITEs specifically.
The P-MITE database performed similarly to what we observed for classifications from the general repeat an-notators; the rice-specific database (P-MITE_rice) anno-tated TIR elements accurately and sensitively, while the non-rice database (P-MITE_norice) had very low FDR and low sensitivity (Fig. 4b), suggesting the necessity of using structure-based methods for de novo annotation.
We tested four structure-based methods for TIR anno-tation: IRF, GRF with educated parameters (GRF-TIR_ edu), TIRvish, and TIR-Learner. Each of these methods had high sensitivity (> 90%; Fig.4c; Additional file2: Table S1D); however, IRF and GRF-TIR_edu performed poorly for the remaining metrics (Fig.4c). The poor performance of IRF and GRF-TIR_edu is due to the large number of candidates they identified, with 4.7 Gb and 630 Gb (13×– 1684× the size of the 374-Mb rice genome) of raw TIR candidate sequences produced, respectively. The majority of raw candidate sequences were overlapping and nested within each other. The output of both programs was sub-stantially filtered and condensed using EDTA utility scripts (Additional file1; Additional file2: Table S2), but still had poor performance based on our analysis metrics (Fig. 4c). TIRvish was among the fastest TIR programs (Additional file2: Table S2); however, it does not provide further classification of superfamilies. In contrast, TIR-Learner provided superfamily classifications and demon-strated relatively high sensitivity, specificity, and accuracy (Fig.4c), which is promising for TIR annotation.
For structure-based MITE annotation, GRF with edu-cated parameters (GRF-mite_edu) also produced large out-put files similar to IRF and GRF-TIR_edu. After filtering for false discovery and redundancy (Additional file1), the candidate sequence file was reduced from 47 Gb (130× the size of the rice genome) to 10 Mb (Additional file2: Table S2). Still, given its inferior annotation performance relative to other MITE methods (Fig. 4b), GRF-mite_edu is not ideal for de novo annotation. Interestingly, GRF with de-fault parameters (GRF-mite_dft) had high performance similar to MITE-Hunter and MITE-Tracker (Fig.4b). The poor performance of GRF-mite_edu is mostly due to chan-ging the internal region length from default 780 bp to 10 Kb (Additional file 1), which captured significantly more non-MITE sequences, suggesting the default parameters of
GRF may have been optimized for MITE detection. These three MITE methods all had high specificity (≥95%) and accuracy (≥94%), reasonable sensitivity (79–84%), but somewhat lower precision (64–79%) (Fig. 4b; Add-itional file 2: Table S1D), suggesting high potential for these programs. miteFinderII and detectMITE also had high performance but with comparatively lower sensitivity for miteFinderII and lower specificity and accuracy for detectMITE (Fig. 4b; Additional file 2: Table S1D). MUSTv2 performed similar to GRF-mite_edu and worse than other MITE programs (Fig.4b).
We identified promising methods for TIR transposon and MITE annotation including TIR-Learner, MITE-Hunter, MITE-Tracker, and GRF-mite_dft. These methods all have relatively high specificity but somewhat high FDR (Fig. 4), indicating each program generated annotations that matched our curated library as well as additional potential TEs. Our curated library is likely in-complete, and these new candidates could be real TIR elements or MITEs. We compared these new TE candi-dates with the curated library and to TIR element-specific conserved domains (Additional file 1). On an element basis, we found over 65% (5688 out of 7435 novel TIR elements and 11,885 out of 18,093 novel MITEs) of the candidates shared similar TIR sequences with our curated library, but included more diverse in-ternal sequences, with a subset of elements showing po-tential to be autonomous (Additional file 3: Table S3). Such variation is common in non-autonomous TIR transposons, such asDselements [61]. For MITE candi-dates with novel TIRs, the majority had more than three copies in the rice genome (Additional file 3: Table S3), suggesting these are likely real TEs that were not in-cluded in the curated library. Out of the four MITE pro-grams, MITE-Hunter identified sequences most similar to the curated library (Additional file3: Table S3).
FDR was partially caused by misclassification of LTR se-quences as TIR elements. We also removed LTR sese-quences from the TIRvish identified candidates and observed a 27% increase of specificity (80.5%) without any loss of sensitivity (94.5%; Fig. 4c; Additional file 2: Table S1D), suggesting that LTR sequences were a common source of false posi-tives during structural identification of TIR elements.
In summary, MITE-Hunter and TIR-Learner showed the best performance for structural identification of MITEs and TIR elements (Fig. 4b, c), respectively, when TIR-Learner results were filtered to control false discovery (Fig.4c). RepeatModeler, Repbase, and P-MITE had high accuracy but low sensitivity (Fig.4a, b) and could be used to supplement structural annotations of MITE and TIR elements.
Comparison ofHelitronannotators
Helitrons are a subclass of DNA transposons that lack terminal repeats and do not generate target site duplica-tions when transposed due to their rolling-circle mech-anism of transposition [62], making identification of these elements particularly challenging. We found only one structure-based software, HelitronScanner [18], that is available, is bug-free (no errors in our test), and pro-ducedHelitronpredictions.
HelitronScanner produced 52 Mb of raw candidate sequences in rice (13.9% of the genome; Additional file 2: Table S2). Since Helitrons may capture DNA sequences when transposed, many non-Helitron TE sequences and even protein-coding sequences are present in the raw pre-diction. Nested insertions between different TE classes are also likely to be present in these initial candidate sequences. Using the curated library, we found that 1.8% ofHelitron candidates consisted of non-LTR sequences (LINEs and SINEs); 21% were LTR sequences and 11% were TIR se-quences. With no filter applied, these Helitron candidates would include all classes of TEs, resulting in a high false discovery rate (93.7%; Additional file2: Table S1E) and low annotation performance (Fig.4d). To control for false dis-covery, we filtered Helitroncandidates that lacked the sig-nature 5′-TC...CTRR-3′ (R = G or A) terminal sequence structure, as well as those not inserted into AT or TT target sites (Additional file1) [63]. We also removed non-Helitron TE sequences in these candidates using the curated library. After applying these filters, both the specificity and accur-acy improved to 86%, while sensitivity was maintained at 95% (Fig.4d; Additional file2: Table S1E).
Similar to TIR-Learner for TIR element identification, HelitronScanner identified most of the curatedHelitrons in the curated library, and also many additional elements not contained in the library (Fig.4d). We further filtered these candidates with the EDTA pipeline (see the “Methods”section) and annotated the rice genome. Our filters yielded annotated sequences covering 7.3% of the
rice genome compared to only 3.6% annotated using the curated library (Additional file3: Table S4). Evaluation of the 30-bp sequences of both terminals with 10-bp flanking sequences as sequence logos showed the AT or TT target sites we required in our filtering and also that these candi-dates clearly have the canonical terminal structure 5′-TC...CTRR-3′(with 5′-TC...CTAG-3′dominating) which is required by HelitronScanner (Additional file 3: Figure S1). These candidates were also located in relatively AT-rich regions with significantly higher AT content in the 5′ terminal (Additional file3: Figure S1), consistent with pre-vious observations by Yang and Bennetzen regarding tar-get site preference [64]. We found enriched CG content at the 3′terminals especially at the−13 and−14 positions, which could produce a hairpin loop, a canonicalHelitron feature [18]. While these elements contain the terminal features of a Helitron, this does not necessarily confirm their validity as intact elements. Further confirmation of these results will require meticulous curation and intra-specific comparisons [18,63].
Comparison of resource consumption and usage
In this study, we benchmarked 25 TE annotation pro-grams and three databases, while nine others were attempted with failure due to a variety of reasons includ-ing (1) lack of maintenance with unresolved program bugs, (2) outdated programs required by the software and a lack of alternatives, (3) required programs or data-bases that are not open-source, and (4) programs take too long to run. For programs that were run successfully, some were more challenging than others. One of the main obstacles was installation. We found compile-free and precompiled programs were the easiest to use, followed by those available via conda and bioconda [65].
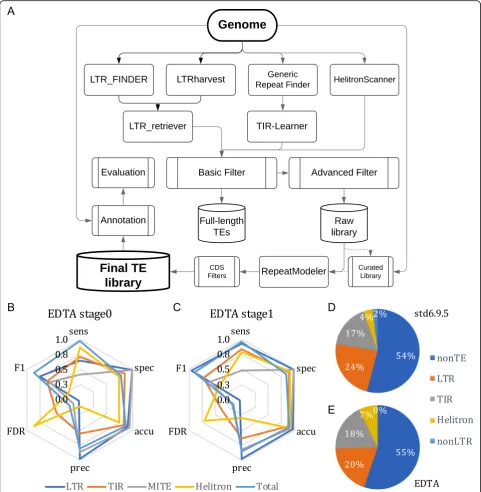
Construction and benchmarking of the EDTA pipeline From the benchmarking results, we identified a set of pro-grams that presented high sensitivity, specificity, and ac-curacy, but, in some instances, high FDR. Using these programs, we have developed a pipeline called Extensive de-novoTE Annotator (EDTA), which combines the best-performing programs and subsequent filtering methods for de novo identification of each TE subclass and com-piles the results into a comprehensive non-redundant TE library. The EDTA pipeline incorporates LTRharvest, the parallel version of LTR_FINDER, LTR_retriever, GRF, TIR-Learner, HelitronScanner, and RepeatModeler as well as customized filtering scripts (Fig.5a). We applied basic filters for LTR candidates, TIR candidates,Helitron candi-dates, and RepeatModeler results to remove short se-quences, tandem repeats, and a portion of false positives (stage 0; the“Methods”section). Advanced filters were ap-plied reciprocally for stage 0 sublibraries to further remove misclassified sequences (stage 1; the“Methods”section).
To test the performance of the EDTA pipeline, we an-notated the rice genome using the curated TE library and the test library generated from the EDTA pipeline. Per-formance metrics for annotation generated using the stage 0 library showed low sensitivity (≤71%) for the annotation of LTR elements, TIR elements, and MITEs, and also sub-optimal specificity (~ 75%) and accuracy (~ 76%) for Heli-tron annotations (Fig. 5b; Additional file 2: Table S1F). This is due to the nested TEs, captured TEs, or false dis-covery inHelitron candidates that impair the annotation performance in the combined stage 0 library. After recip-rocal removal of misclassified TEs in each category (stage 1; Fig.5a; the “Methods” section), the performance met-rics were high for the EDTA stage 1 annotation (Fig.5c). For all four TE subclasses and the overall repetitive se-quences, the annotation sensitivity averaged 75.4%, specifi-city averaged 95.0%, and accuracy averaged 93.0% (Additional file 2: Table S1F). FDRs of these categories ranged from 3–36%, with the exception ofHelitronsthat had 70% of annotations not identified by the curated li-brary (Additional file2: Table S1F).
Overall, 96% of TEs were annotated in the rice gen-ome using EDTA (Additional file 2: Table S1F), which was very close to the estimation based on the curated li-brary (Fig.5d, e). We did not identify any non-LTR ret-rotransposons with the RepeatModeler module (Fig.5e). This is likely due to the low level of non-LTR elements in the rice genome (Table 1; Fig. 5d) that could have been misclassified as other TE subclasses, which is not the case for many of the larger eukaryotic genomes. Fur-ther annotation of non-LTR retrotransposons is neces-sary to exhaustively annotate TEs in the genome. As new programs become available for non-LTR elements, they will be benchmarked and potentially added to the EDTA pipeline based on performance metrics.
The purpose of EDTA is to ease the construction of non-redundant TE libraries for newly sequenced eukaryotic ge-nomes, which can be subsequently used to generate whole-genome de novo TE annotations of structurally intact and fragmented elements. Our initial benchmarking was com-pleted using the model species rice. To demonstrate its util-ity in other species, we applied the pipeline to maize [4,66] and Drosophila [20], both of which have high-quality genomes and manually curated TE libraries to which we could compare the output of EDTA (Additional file3: Ta-bles S5-S6). Our results show that EDTA has high perform-ance in the genomes of maize and Drosophila similar to that in the rice genome (Fig.5c; Fig.6h, i). Across the dif-ferent types of TEs and species, sensitivity is averaged 77%, specificity is averaged 90%, and accuracy is averaged 92% (Fig. 6h, i; Additional file 2: Table S1F). EDTA annotated many moreHelitronsin both species compared to their re-spective, curated libraries (FDR averaged 80%; Fig. 6h, i; Additional file2: Table S1F), which is likely due to the in-completeness of curated libraries. In particular, the curated Drosophila library has only oneHelitronsequence and this does not carry the canonical 5′-TC...CTRR-3′ terminal structure which is currently critical for automated identifi-cation ofHelitrons.
(14–39%), which is likely due to the sequence capture nature of these TEs. Our results indicate the potential need for careful verification and curation ofHelitron an-notations generated by HelitronScanner used within the EDTA pipeline.
There are a number of existing annotation pipelines for de novo TE annotation. REPET [67] is a well-known pipe-line developed for de novo TE identification and annota-tion facilitated by the RepBase database [30]. Tephra was originally developed for structure-based TE annotations of
[image:11.595.57.539.88.581.2]the sunflower (Helianthus annuus) genome [68]. We benchmarked EDTA against these two pipelines in the rice genome. The overall sensitivity of these two pipelines (≥96%) was comparable to the EDTA result (96%), despite the lack of functionality of Helitron detection in REPET (Additional file3: Figure S2; Additional file2: Table S1F). However, neither of the programs were sensitive in TIR and MITE detection (27–62%), nor were they specific in LTR and Helitron (only for tephra) detection (67–78%; Additional file3: Figure S2; Additional file2: Table S1F). This suggests a poor balance between sensitivity and
specificity. We also observed a high misclassification rate of the REPET annotation (15–62%) and a medium level of misclassification of the tephra annotation (21–36%; Add-itional file3: Figure S2). The overall misclassification rate of REPET and tephra (22–28%; Additional file 3: Figure S2) is lower than that of the EDTA stage 0 annotation (37%; Fig.6g), but much higher than the final EDTA an-notation (6%; Fig.6d).
Overall, we observed high performance of EDTA across multiple species including both plant and animal species with varying genome size and TE content. EDTA
[image:12.595.58.539.87.533.2]has demonstrated promise in automated high-quality TE annotations that facilitate whole-genome annotation and TE studies without the need for extensive manual annotation.
Discussion
Recent innovations in third-generation (i.e., long-read) se-quencing have enabled rapid and high-quality assembly of the repetitive fraction of genomes, creating an opportunity and need for high-throughput annotation of TEs. Annota-tion of TEs presents a substantial algorithmic and computa-tional challenge. Different classes of TEs have distinct sequence characteristics, which has led to the development of software programs for each type. While anecdotally re-searchers have known the strengths and weaknesses of each of these methods, no comprehensive benchmarking study has quantified their relative annotation (i.e., sensitivity and specificity) and computational (i.e., run time and memory requirements) metrics. We have exhaustively tested these programs against a high-quality, manually curated rice TE library and have compiled the best-performing software as part of a comprehensive TE annotation pipeline known as EDTA. We have further demonstrated that the pipeline is robust across species.
All TEs were capable of transposition in the genome. However, the ability to amplify varies dramatically among different TE families. In fact, only a few TE families can amplify to high copy number. For example, in maize, the top 20 families of LTR retrotransposons comprise ~ 70% of the genome, whereas the remainder (380 or more) comprise only ~ 5% [69]. From this perspective, if a TE identification program captures elements with high copy number, the majority of the TE body in the genome will be characterized. Consistent with this notion, we observed that all general repeat identification programs, which de-pend on sequence repeatedness, performed well (high sen-sitivity and specificity, good precision and accuracy; Fig. 2a). Most importantly, the results from these pro-grams are associated with very low FDR, suggesting when a sequence is repetitive to a certain degree, it is very likely to be a TE. However, most repeats from general programs are not classified and their sequence boundaries are often approximate. Not all tasks require TE classifications. For example, repetitive sequences are usually masked prior to gene annotation to minimize interference. For such pur-poses, general repeat identification programs and subse-quent filtering for duplicated genes would suffice.
In contrast to the general repeat annotators, structure-based programs can identify low- or even single-copy ele-ments and are therefore more sensitive. Moreover, these programs provide the exact coordinates of elements and are ideal for targeted study of TEs and their interactions with other components in the genome. However, based on our results, the majority of structure-based programs
are associated with high FDR (up to 95%), and such error could be propagated in subsequent analyses. One factor contributing to this high error rate is misidentification due to nested insertion of TEs from different classes. We have developed an approach to minimize this issue by cross-checking sequences derived from programs for dif-ferent classes of TEs. Another potential strategy to reduce FDR is to incorporate copy number control, but this would actually compromise the most important advantage of structure-based programs, which is sensitivity. Thus, this is an unsolvable problem without improvement to structure-based programs; particularly those for non-LTR retrotransposons and Helitrons. While more specific search engines or efficient filters may reduce the FDR, some level of manual curation may still be necessary for the generation of high-quality libraries.
Few species beyond rice have TE libraries of sufficient quality and genomes that are tractable enough to be used for benchmarking purposes. Furthermore, TEs comprise a relatively high proportion of the rice genome (~ 46%), and extensive manual curation efforts make it one of the only species in which a benchmarking study can reliably calcu-late true positive, false positive, true negative, and false negative rates across annotation programs. However, relative performance of TE annotation programs should be similar across systems. Programs have primarily been developed to detect specific types of TEs and are largely agnostic to species. This is possible because classes of TEs generally have similar structures across species [14, 16, 18]. Throughout this benchmarking exercise, we have based our tuning of programs (i.e., our educated parame-ters) on current knowledge of the structure of each target TE subclass [14,16,18], which, again, is not specialized to a particular system or species. As an example of the broad utility of these methods, the LTR_retriever program [40] has been tested for annotation of Arabidopsis, rice, maize, and sacred lotus (Nelumbo nucifera) [70] and demon-strated similar performance across systems. Furthermore, when we applied the EDTA pipeline to generate de novo libraries for maize and Drosophila, we saw consistent per-formance metrics to those observed for the initial bench-marking with rice.
For example, variation in terminal motifs and target site duplication in LTR elements was previously poorly char-acterized. In the development of LTR_retriever, it was found that the terminal motif 5′-TG..CA-3′occurs 99% of the time and that the vast majority of LTR TSDs are 5 bp [40]. While some programs set very flexible parameters for these features (e.g., LTRharvest), in our implementa-tion of LTR_retriever, we applied our new knowledge and observed a substantial improvement in performance with regard to the FDR [40].
Moving forward, we see opportunities for improved an-notation of highly variable TE classes including MITE/TIR elements and SINE/LINE, where, upon insertion, mutations and indels can be created. In these situations, construction of a consensus sequence is necessary for more precise TE annotation. Many programs do not currently have this feature. The GRF program for detection of interspersed repeats (grf-intersperse) has a consensus function, but the program does not allow indels, resulting in the lowest sensi-tivity but also the lowest FDR. For SINE/LINE detection, we found very low sensitivity and very high FDR, which is likely due to variation in these TEs (e.g., most LINEs are truncated upon insertion) and the lack of terminal repeats, making detection very challenging. Further development of consensus-based methods will be important. As new methods are generated and existing methods are improved, they will be benchmarked relative to our rice library and in-cluded in the EDTA pipeline when they result in a marked increase in annotation performance.
Conclusions
Advances in sequencing technology are facilitating as-sembly of the repetitive portion of many genomes, which necessitates the annotation of these features. Using a highly curated library of rice TEs, we have created a benchmarking platform to test TE annotation software. We used this platform to exhaustively test currently available software based on output (i.e., sensitivity and specificity) as well as the performance of the software (i.e., run time and memory usage). From this bench-marking exercise, the EDTA pipeline was developed that combines the highest performing software with neces-sary filtering and processing scripts such that the pipe-line can be applied to any new genome assembly.
Methods
Manual curation of transposable elements in rice
Manual curation of TEs in rice was started after the re-lease of the map-based rice genome [22]. Repetitive se-quences in the rice genome were compiled by RECON [44] with a copy number cutoff of 10. Details for manual curation of LTR sequences were previously described in the LTR_retriever paper [40]. In brief, for the curation of LTR retrotransposons, we first collected known LTR
elements and used them to mask LTR candidates. Unmasked candidates were manually checked for ter-minal motifs, TSD sequences, and conserved coding se-quences. Terminal repeats were aligned with extended sequences, from which candidates were discarded if alignments extended beyond their boundaries. For the curation of non-LTR retrotransposons, new candidates were required to have a poly-A tail and TSD. We also collected 13 curated SINE elements from [53] to com-plement our library.
For curation of DNA TEs with TIRs, flanking sequences (100 bp or longer, if necessary) were extracted and aligned using DIALIGN2 [72] to determine element boundaries. A boundary was defined as the position to which sequence homology is conserved over more than half of the aligned sequences. Then, sequences with defined boundaries were manually examined for the presence of TSD. To classify the TEs into families, features in the terminal and TSD se-quences were used. Each transposon family is associated with distinct features in their terminal sequences and TSDs, which can be used to identify and classify elements into their respective families [14]. ForHelitrons, each rep-resentative sequence requires at least two copies with in-tact terminal sequences, distinct flanking sequences, and inserts into“AT”target sites.
To make our non-redundant curated library, each new TE candidate was first masked by the current library. The unmasked candidates were further checked for structural integrity and conserved domains. For candidates that were partially masked and presented as true elements, the “80-80-80” rule (≥80% of the query aligned with ≥80% of identity and the alignment is≥80 bp long) was applied to determine whether this element would be retained. For el-ements containing detectable known nested insertions, the nested portions were removed and the remaining re-gions were joined as a sequence. Finally, protein-coding sequences were removed using the ProtExcluder package [73]. The curated library version 6.9.5 was used in this study and is available as part of the EDTA toolkit.
Calculation of benchmarking metrics
When we obtained a non-redundant test library from a target program (details in the next section), the test library was used to annotate the rice genome with the same RepeatMasker parameters, except that the test library was provided as a custom library. Then, the testing annotation was compared to the curated annotation for calculations of sensitivity, specificity, accuracy, precision, FDR, and F1
measures (Fig.1). These six metrics were calculated using the script“lib-test.pl”in our EDTA toolkit.
Execution of TE programs
We exhaustively searched the literature for open-source programs and databases that have been developed for both general repeat annotation and structural annotation. We executed each of these programs to obtain candidate sequences or downloaded sequences from specialized da-tabases. All programs were executed using parameters consistent with current knowledge of TE structure (edu-cated parameters). A description of each of these pro-grams, observations we made about accessibility/ease of use of these programs, and the specific parameter options that were used are provided in Additional file 1. To benchmark the algorithmic efficiency, these programs were executed in multiple high-performance computing platforms (Additional file 2: Table S2). Run time (wall clock), average CPU usage, and maximum memory con-sumption were recorded using“/usr/bin/time -v.”
After we obtained raw sequences from programs, we went through three steps to construct non-redundant test libraries. The first step was to remove short tandem repeat contamination sequences that were present in the raw can-didates. Identification of tandem sequences was achieved by Tandem Repeats Finder [74] with parameters“2 7 7 80 10 3000 2000 -ngs -h -l 6”. The second step was to remove missing characters (Ns) in candidates as well as short se-quences. The minimum sequence length was set to 80 bp for TIR candidates and 100 bp for other types of TE candi-dates. We used the script“cleanup_tandem.pl”in the LTR_ retriever package [40] for the first two steps with parame-ters “-misschar N -nc 50000 -nr 0.9 -minlen 100 (or 80) -minscore 3000 -trf 1 -cleanN 1.”The third step was to re-move redundant sequences and nested insertions, which was achieved using the script “cleanup_nested.pl” in the LTR_retriever package [40] with default parameters. The third step was iterated five times to resolve heavily nested TEs for a thorough reduction of sequence redundancy. The resulting sequences were used as the non-redundant test li-brary for the focal programs. Databases were used directly as test libraries without any filtering or manipulations.
Construction of the Extensivede-novoTE annotator pipeline
Extensive de-novo TE Annotator (EDTA) is a pipeline for comprehensive and high-quality TE annotation for
newly assembled eukaryotic genomes or to expand cu-rated TE libraries. We combined open-source programs that are either specialized for a particular subclass of TEs or general for all repetitive sequences. The pro-grams we selected had the highest performance from our benchmarking and together deliver the best TE annotation for a new genome that is possible given current program performance. Still, based on our benchmarking results, substantial contamination will exist due to misclassifica-tion of elements, nested insermisclassifica-tions, and sequences cap-tured by TEs.
The EDTA pipeline contains a set of scripts for filtering the output of each program to reduce the overall false discovery rate. The first set of scripts included in EDTA applies a simple filter for each of the initial predictions to remove tandem repeats and short sequences (< 80 bp for TIR elements and < 100 bp for LTR elements and Heli-trons). For LTR candidates identified by LTRharvest and LTR_FINDER, false discoveries are filtered by LTR_re-triever. For TIR candidates identified by TIR-Learner, se-quences are reclassified as MITEs if their length is≤600 bp. For Helitroncandidates reported by HelitronScanner, filters based on target site (AT or TT) and prediction scores (≥12) are performed (Additional file1).
LTR elements is reported as intact LTR elements. After these basic filtering steps, TE candidates are named stage 0 (full-length TEs in Fig. 5).
Advanced filters are necessary to generate a com-prehensive and high-quality TE library. In stage 0 TE candidates, a fraction (0.3–27%) of them still contain misclassified TE sequences that are augmented when the library is used for whole-genome TE annotation. To further reduce misclassifications, TE sequences are filtered based on their relative richness between subli-braries. For each candidate sequence, the richness was estimated in both the target sublibrary (e.g., LTR) and the other sublibraries (e.g., TIR and Helitron) based on sequence homology. If the richness of the candi-date sequence is not significantly higher in the target sublibrary than in another sublibrary, it is classified as a contaminant to the target sublibrary and discarded. Purification of TE candidates is performed recipro-cally between sublibraries.
After these reciprocal filtering steps, updated subli-braries are aggregated and subjected to nested inser-tion removal and clustering, which generates the non-redundant stage 1 library (raw library in Fig. 5). Be-cause LTR_retriever serves as a strong filter of results from LTRharvest and LTR_FINDER, no further filter-ing was necessary (LTR.stage0 = LTR.stage1). Non-redundant stage 1 TEs are then used to mask the genome. The remaining unmasked portion of the gen-ome is scanned by RepeatModeler with default pa-rameters to identify non-LTR retrotransposons and any unclassified TEs that are missed by structure-based TE identification. Finally, all remaining TEs are aggregated and protein-coding sequences are filtered in order to produce the final EDTA TE library. In this process, users can (1) provide TE-free coding se-quences (CDS) of this species or closely related spe-cies for removal of gene-related sequences in the TE library and (2) provide a curated library; then, EDTA will only identify novel TEs that are not present in the provided library. All EDTA results presented here for rice and maize were based on de novo TE scans without using existing TE libraries. The EDTA library has RepeatMasker-readable sequence names and can be used to annotate whole-genome TE sequences.
To facilitate genome annotation and TE studies, we also provide a number of helpful functions in the EDTA package: (1) Users can white-list genomic re-gions from repeat masking (such as predicted gene regions); (2) output intact TE structural annotation information; (3) users can choose to annotate whole-genome TEs as well as perform low-threshold TE masking for downstream gene annotation; and (4) users can evaluate the TE annotation consistency without using external curated TE libraries.
Supplementary information
Supplementary informationaccompanies this paper athttps://doi.org/10. 1186/s13059-019-1905-y.
Additional file 1.Supplementary Methods.
Additional file 2: Table S1.Performance metrics of TE methods.Table S2.Time and resource consumption.
Additional file 3: Table S3.Verification of new TIR candidates identified by TIR-Learner and MITE programs.Table S4.Comparison of whole-genomeHelitronannotations using the curated library (v6.9.5), the HelitronScanner clean library (HS_clean), and the EDTA filtered Helitron-Scanner library (HS_EDTA).Table S5.TE content in the maize (Zea mays
cv.‘B73’v. 4) genome.Table S6.TE content in the Drosophila (Drosophila melanogasterr6.28) genome.Figure S1.Sequence logos of terminal and flanking sequences ofHelitroncandidates cleaned by the standard library. Figure S2.Performance of TE annotation programs.
Additional file 4.Review history.
Acknowledgements
We wish to acknowledge Margaret Woodhouse and Jeffrey Ross-Ibarra for the helpful feedback on a previous version of this manuscript. We wish to thank Ellen Pritham for her assistance in curation of the rice TE library.
Peer review information
Yixin Yao was the primary editor of this article and managed its editorial process and peer review in collaboration with the rest of the editorial team.
Review history
The review history is available as Additional file4.
Authors’contributions
SO, MBH, and CNH conceived the study. NJ curated the TE library in rice. SO, WS, YL, KC, NJ, AJH, JRAA, CSBL, and TAE conducted the analyses. SO developed the EDTA package. SO, WS, MBH, CNH, NJ, and TAE wrote the manuscript. All authors read and approved the final manuscript.
Funding
This work was supported in part by the NSF Plant Genome Research Program under grants IOS-1744001 (MBH, DW, SO, KC), IOS-1546727 (CNH), and IOS-1740874 (NJ), by the USDA National Institute of Food and Agricul-ture hatch grant IOW05282 (TP, WS), by the State of Iowa (TP, WS), and by the Canada First Research Excellence Fund Ontario (JRAA, AJH, CSBL, TAE).
Availability of data and materials
The curated rice library and all scripts are freely available athttps://github. com/oushujun/EDTA[34].
Ethics approval and consent to participate Not applicable
Consent for publication Not applicable
Competing interests
The authors declare that they have no competing interests.
Author details
1Department of Ecology, Evolution, and Organismal Biology, Iowa State
University, Ames, IA 50011, USA.2Department of Genetics, Development, and
Cell Biology, Iowa State University, Ames, IA 50011, USA.3Department of
Ecology and Evolutionary Biology, University of California, Irvine, CA 92697, USA.4Cold Spring Harbor Laboratory, Cold Spring Harbor, NY 11724, USA. 5Centre for Biodiversity Genomics, University of Guelph, Guelph, Ontario N1G
2W1, Canada.6USDA-ARS NEA Robert W. Holley Center for Agriculture and
Health, Cornell University, Ithaca, NY 14853, USA.7Department of Horticulture, Michigan State University, East Lansing, MI 48824, USA.
8Department of Agronomy and Plant Genetics, University of Minnesota, Saint
Received: 24 May 2019 Accepted: 28 November 2019
References
1. McClintock B. Cytogenetic studies of maize and Neurospora. Year B Carnegie Inst Wash. 1947;46:146–52.
2. Mills RE, Bennett EA, Iskow RC, Devine SE. Which transposable elements are active in the human genome? Trends Genet. 2007;23:183–91.
3. International Wheat Genome Sequencing Consortium (IWGSC), IWGSC RefSeq principal investigators, Appels R, Eversole K, Feuillet C, Keller B, et al. Shifting the limits in wheat research and breeding using a fully annotated reference genome. Science. 2018;361:eaar7191.
4. Schnable PS, Ware D, Fulton RS, Stein JC, Wei F, Pasternak S, et al. The B73 maize genome: complexity, diversity, and dynamics. Science. 2009;326: 1112–5.
5. Marand AP, Zhao H, Zhang W, Zeng Z, Fang C, Jiang J. Historical meiotic crossover hotspots fueled patterns of evolutionary divergence in rice. Plant Cell. 2019;31:645–62.
6. Studer A, Zhao Q, Ross-Ibarra J, Doebley J. Identification of a functional transposon insertion in the maize domestication genetb1. Nat Genet. 2011; 43:1160–3.
7. Huang C, Sun H, Xu D, Chen Q, Liang Y, Wang X, et al.ZmCCT9enhances maize adaptation to higher latitudes. Proc Natl Acad Sci U S A. 2018;115: E334–41.
8. Ou S, Chen J, Jiang N. Assessing genome assembly quality using the LTR Assembly Index (LAI). Nucleic Acids Res. 2018;46:e126.
9. Campbell MS, Holt C, Moore B, Yandell M. Genome annotation and curation using MAKER and MAKER-P. Curr Protoc Bioinformatics. 2014;48:4–11. 10. Hoff KJ, Lange S, Lomsadze A, Borodovsky M, Stanke M. BRAKER1:
unsupervised RNA-Seq-Based genome annotation with GeneMark-ET and AUGUSTUS. Bioinformatics. 2016;32:767–9.
11. Holt C, Yandell M. MAKER2: an annotation pipeline and genome-database management tool for second-generation genome projects. BMC Bioinformatics. 2011;12:491.
12. Kumar A, Bennetzen JL. Plant retrotransposons. Annu Rev Genet. 1999;33: 479–532.
13. Eickbush TH, Jamburuthugoda VK. The diversity of retrotransposons and the properties of their reverse transcriptases. Virus Res. 2008;134:221–34. 14. Wicker T, Sabot F, Hua-Van A, Bennetzen JL, Capy P, Chalhoub B, et al. A
unified classification system for eukaryotic transposable elements. Nat Rev Genet. 2007;8:973–82.
15. Kunze R, Saedler H, Lönnig WE. Plant transposable elements. Adv Bot Res. 1997;27:331–470.
16. Zhao D, Ferguson AA, Jiang N. What makes up plant genomes: the vanishing line between transposable elements and genes. Biochim Biophys Acta. 1859;2016:366–80.
17. Su W, Gu X, Peterson T. TIR-Learner, a new ensemble method for TIR transposable element annotation, provides evidence for abundant new transposable elements in the maize genome. Mol Plant. 2019;12:447–60. 18. Xiong W, He L, Lai J, Dooner HK, Du C. HelitronScanner uncovers a large
overlooked cache ofHelitrontransposons in many plant genomes. Proc Natl Acad Sci U S A. 2014;111:10263–8.
19. Yang L, Bennetzen JL. Distribution, diversity, evolution, and survival of
Helitronsin the maize genome. Proc Natl Acad Sci U S A. 2009;106:19922–7. 20. Adams MD, Celniker SE, Holt RA, Evans CA, Gocayne JD, Amanatides PG,
et al. The genome sequence ofDrosophila melanogaster. Science. 2000;287: 2185–95.
21. Initiative TAG. The Arabidopsis Genome Initiative. Analysis of the genome sequence of the flowering plantArabidopsis thaliana. Nature. 2000;408:796– 815.
22. Sasaki T. International Rice Genome Sequencing Project. The map-based sequence of the rice genome. Nature. 2005;436:793–800.
23. Copetti D, Zhang J, El Baidouri M, Gao D, Wang J, Barghini E, et al. RiTE database: a resource database for genus-wide rice genomics and evolutionary biology. BMC Genomics. 2015;16:538.
24. Goerner-Potvin P, Bourque G. Computational tools to unmask transposable elements. Nat Rev Genet. 2018;19:688–704.
25. Lerat E. Identifying repeats and transposable elements in sequenced genomes: how to find your way through the dense forest of programs. Heredity. 2010; 104:520–33.
26. Price AL, Jones NC, Pevzner PA.De novoidentification of repeat families in large genomes. Bioinformatics. 2005;21(Suppl 1):i351–8.
27. Girgis HZ. Red: an intelligent, rapid, accurate tool for detecting repeats de-novoon the genomic scale. BMC Bioinformatics. 2015;16:227.
28. Smit AFA, Hubley R. RepeatModeler Open-1.0. 2008—2015. 2015. Available from: www. repeatmasker. org
29. Smit AFA, Hubley R, Green P. RepeatMasker Open-4.0. 2013--2015. 2015. Available from:www.repeatmasker.org
30. Bao W, Kojima KK, Kohany O. Repbase Update, a database of repetitive elements in eukaryotic genomes. Mob DNA. 2015;6:11.
31. Chen J, Hu Q, Zhang Y, Lu C, Kuang H. P-MITE: a database for plant miniature inverted-repeat transposable elements. Nucleic Acids Res. 2014;42:D1176–81. 32. Vassetzky NS, Kramerov DA. SINEBase: a database and tool for SINE analysis.
Nucleic Acids Res. 2013;41:D83–9.
33. Hoen DR, Hickey G, Bourque G, Casacuberta J, Cordaux R, Feschotte C, et al. A call for benchmarking transposable element annotation methods. Mob DNA. 2015;6:13.
34. Ou S, Su W. The Extensive de-novo TE Annotator. GitHub. Available from:
https://github.com/oushujun/EDTA. Accessed 15 Nov 2019.
35. Jiang N, Bao Z, Zhang X, Hirochika H, Eddy SR, McCouch SR, et al. An active DNA transposon family in rice. Nature. 2003;421:163–7.
36. Jiang N, Bao Z, Zhang X, Eddy SR, Wessler SR. Pack-MULE transposable elements mediate gene evolution in plants. Nature. 2004;431:569–73. 37. Feschotte C, Swamy L, Wessler SR. Genome-wide analysis ofmariner-like
transposable elements in rice reveals complex relationships with stowaway miniature inverted repeat transposable elements (MITEs). Genetics. 2003;163:747–58. 38. Xie Y, Wang Y, Wu R. A rice DNA sequence that resembles the maizeMu 1
transposable element. Rice Genetics Collect. 2008;2:377–87. 39. Barret P, Brinkman M, Beckert M. A sequence related to ricePong
transposable element displays transcriptional activation byin vitroculture and reveals somaclonal variations in maize. Genome. 2006;49:1399–407. 40. Ou S, Jiang N. LTR_retriever: a highly accurate and sensitive program for
identification of long terminal repeat retrotransposons. Plant Physiol. 2018; 176:1410–22.
41. Zhang X, Jiang N, Feschotte C, Wessler SR.PIF- andPong-like transposable elements: distribution, evolution and relationship withTourist-like miniature inverted-repeat transposable elements. Genetics. 2004;166:971–86. 42. Han Y, Qin S, Wessler SR. Comparison of class 2 transposable elements at
superfamily resolution reveals conserved and distinct features in cereal grass genomes. BMC Genomics. 2013;14:71.
43. Chen J, Lu L, Benjamin J, Diaz S, Hancock CN, Stajich JE, et al. Tracking the origin of two genetic components associated with transposable element bursts in domesticated rice. Nat Commun. 2019;10:641.
44. Bao Z, Eddy SR. Automatedde novoidentification of repeat sequence families in sequenced genomes. Genome Res. 2002;12:1269–76. 45. Shi J, Liang C. Generic Repeat Finder: a high-sensitivity tool for
genome-wide de novo repeat detection. Plant Physiology. 2019:00386.https://doi. org/10.1104/pp.19.00386.
46. McCarthy EM, McDonald JF. LTR_STRUC: a novel search and identification program for LTR retrotransposons. Bioinformatics. 2003;19:362–7. 47. Xu Z, Wang H. LTR_FINDER: an efficient tool for the prediction of full-length
LTR retrotransposons. Nucleic Acids Res. 2007;35:W265–8.
48. Ellinghaus D, Kurtz S, Willhoeft U. LTRharvest, an efficient and flexible software forde novodetection of LTR retrotransposons. BMC Bioinformatics. 2008;9:18. 49. Lee H, Lee M, Mohammed Ismail W, Rho M, Fox GC, Oh S, et al. MGEScan: a
Galaxy-based system for identifying retrotransposons in genomes. Bioinformatics. 2016;32:2502–4.
50. Valencia JD, Girgis HZ. LtrDetector: a tool-suite for detecting long terminal repeat retrotransposons de-novo. BMC Genomics. 2019;20:450.
51. Rho M, Choi J-H, Kim S, Lynch M, Tang H.De novoidentification of LTR retrotransposons in eukaryotic genomes. BMC Genomics. 2007;8:90. 52. Ou S, Jiang N. LTR_FINDER_parallel: parallelization of LTR_FINDER enabling rapid
identification of long terminal repeat retrotransposons. bioRxiv. 2019:722736 Available from:https://www.biorxiv.org/content/10.1101/722736v1. [cited 2019 Aug 17]. 53. Mao H, Wang H. SINE_scan: an efficient tool to discover short interspersed
nuclear elements (SINEs) in large-scale genomic datasets. Bioinformatics. 2017;33:743–5.
55. Gremme G, Steinbiss S, Kurtz S. GenomeTools: a comprehensive software library for efficient processing of structured genome annotations. IEEE/ACM Trans Comput Biol Bioinform. 2013;10:645–56.
56. Han Y, Wessler SR. MITE-Hunter: a program for discovering miniature inverted-repeat transposable elements from genomic sequences. Nucleic Acids Res. 2010;38:e199.
57. Ye C, Ji G, Liang C. detectMITE: a novel approach to detect miniature inverted repeat transposable elements in genomes. Sci Rep. 2016;6:19688. 58. Ge R, Mai G, Zhang R, Wu X, Wu Q, Zhou F. MUSTv2: an improvedde novo
detection program for recently active miniature inverted repeat transposable elements (MITEs). J Integr Bioinform. 2017;14:20170029. 59. Hu J, Zheng Y, Shang X. MiteFinderII: a novel tool to identify miniature
inverted-repeat transposable elements hidden in eukaryotic genomes. BMC Med Genomics. 2018;11:101.
60. Crescente JM, Zavallo D, Helguera M, Vanzetti LS. MITE Tracker: an accurate approach to identify miniature inverted-repeat transposable elements in large genomes. BMC Bioinformatics. 2018;19:348.
61. Du C, Hoffman A, He L, Caronna J, Dooner HK. The completeAc/Ds
transposon family of maize. BMC Genomics. 2011;12:588.
62. Kapitonov VV, Jurka J. Rolling-circle transposons in eukaryotes. Proc Natl Acad Sci U S A. 2001;98:8714–9.
63. Thomas J, Pritham EJ.Helitrons, the eukaryotic rolling-circle transposable elements. Microbiol Spectr. 2015;3:1–32.
64. Yang L, Bennetzen JL. Structure-based discovery and description of plant and animalHelitrons. Proc Natl Acad Sci U S A. 2009;106:12832–7. 65. Grüning B, The Bioconda Team, Dale R, Sjödin A, Chapman BA, Rowe J,
et al. Bioconda: sustainable and comprehensive software distribution for the life sciences. Nature Methods. 2018;15:475–6.
66. Jiao Y, Peluso P, Shi J, Liang T, Stitzer MC, Wang B, et al. Improved maize reference genome with single-molecule technologies. Nature. 2017;546: 524–7.
67. Flutre T, Duprat E, Feuillet C, Quesneville H. Considering transposable element diversification inde novoannotation approaches. PLoS One. 2011;6: e16526.
68. Badouin H, Gouzy J, Grassa CJ, Murat F, Staton SE, Cottret L, et al. The sunflower genome provides insights into oil metabolism, flowering and Asterid evolution. Nature. 2017;546:148–52.
69. Baucom RS, Estill JC, Chaparro C, Upshaw N, Jogi A, Deragon J-M, et al. Exceptional diversity, non-random distribution, and rapid evolution of retroelements in the B73 maize genome. PLoS Genet. 2009;5:e1000732. 70. Ming R, VanBuren R, Liu Y, Yang M, Han Y, Li L-T, et al. Genome of the
long-living sacred lotus (Nelumbo nuciferaGaertn.). Genome Biol. 2013;14:R41. 71. Kvikstad EM, Makova KD. The (r)evolution of SINE versus LINE distributions
in primate genomes: Sex chromosomes are important. Genome Res. 2010; 20:600–13.
72. Morgenstern B, Werner N, Prohaska SJ, Steinkamp R, Schneider I, Subramanian AR, et al. Multiple sequence alignment with user-defined constraints at GOBICS. Bioinformatics. 2005;21:1271–3.
73. Campbell MS, Law M, Holt C, Stein JC, Moghe GD, Hufnagel DE, et al. MAKER-P: a tool kit for the rapid creation, management, and quality control of plant genome annotations. Plant Physiol. 2014;164:513–24.
74. Benson G. Tandem repeats finder: a program to analyze DNA sequences. Nucleic Acids Res. 1999;27:573–80.
Publisher’s Note