comment
reviews
reports
deposited research
interactions
information
refereed research
Research
A database for the provisional identification of species using only
genotypes: web-based genome profiling
Takehiro Watanabe, Ayumu Saito, Yusuke Takeuchi, Mohammed
Naimuddin and Koichi Nishigaki
Address: Department of Functional Materials Science, Saitama University, 255 Shimo-Okubo, Saitama, Saitama 338-8570, Japan.
Correspondence: Koichi Nishigaki. E-mail: [email protected]
Abstract
Background: For a long time one could not imagine being able to identify species on the basis of genotype only as there were no technological means to do so. But conventional phenotype-based identification requires much effort and a high level of skill, making it almost impossible to analyze a huge number of organisms, as, for example, in microbe-related biological disciplines. Comparative analysis of 16S rRNA has been changing the situation, however. We report here an approach that will allow rapid and accurate phylogenetic comparison of any unknown strain to all known type strains, enabling tentative assignments of strains to species. The approach is based on two main technologies: genome profiling and Internet-based databases.
Results: A complete procedure for provisional identification of species using only their genomes is presented, using random polymerase chain reaction, temperature-gradient gel electrophoresis, image processing to generate ‘species-identification dots’ (spiddos) and data processing. A database website for this purpose was also constructed and operated successfully. The protocol was standardized to make the system reproducible and reliable. The overall methodology thus established has remarkable aspects in that it enables non-experts to obtain an initial species identification without a lot of effort and is self-developing; that is, species can be determined more definitively as the database is used more and accumulates more genome profiles.
Conclusions: We have devised a methodology that enables provisional identification of species on the basis of their genotypes only. It is most useful for microbe-related disciplines as they face the most serious difficulties in species identification.
Published: 28 January 2002
GenomeBiology2002, 3(2):research0010.1–0010.8
The electronic version of this article is the complete one and can be found online at http://genomebiology.com/2002/3/2/research/0010 © 2002 Watanabe et al., licensee BioMed Central Ltd
(Print ISSN 1465-6906; Online ISSN 1465-6914)
Received: 28 August 2001 Revised: 22 October 2001 Accepted: 5 December 2001
Background
A biological species is usually defined in principle as a set of actually or potentially interbreeding organisms, but as inter-breeding is very difficult to measure, species have in practice been identified by their phenotypic traits. Until recently, progress in most microbe-related disciplines has been hampered by the enormous effort needed to identify less
approach to phylogenetics [3-5]. Well-conserved molecules, such as 16S rRNA in particular, have been used to give a species a molecular identifier and to draw phylogenetic rela-tionships. The 16S rRNA-based approach has been widely accepted and has proved successful in phylogenetic tree-making and even in identifying species. In this context, the Ribosomal Database Project has been established [6]. There are other similar approaches, such as one based on the gyrase gene [7] and multilocus sequence typing [8]. Nonetheless, it has been impossible in practice to analyze all the constituents of a microbial population, not only because of the huge size of such populations (more than 108 cells per ml) but also
because of lack of suitable methodology. Although there are methods other than gene and genome sequencing for analyz-ing genomes, such as restriction-fragment length polymor-phism (RFLP), amplified fragment-length polymorpolymor-phism (AFLP), Octamer-based genome scanning (OBGS), random polymerase chain reaction (PCR) and others [9-12], most cannot be used to identify species without a knowledge of phenotypic traits. In reality, there is no general methodology that enables us to identify species by genotype only, although many approaches use genotypic information (DNA sequences) to complement phenotypic information.
We have recently demonstrated the possibility of species identification by genotype using genome profiling [13], which is a temperature-gradient gel electrophoresis (TGGE) analysis of random PCR products [14]. In particular, the use of ‘species-identification dots’ (spiddos), which are feature points in genome profiles, is very useful for objective and reproducible data processing [15,16]. We present here a uni-versal method for provisional genotype-based species identi-fication based on these technological advances and using the Internet environment, which enables us to identify species in general. This paper also presents the important concepts of genome distance and genome sequence space, which are essential for species identification based on genotype.
Results and discussion
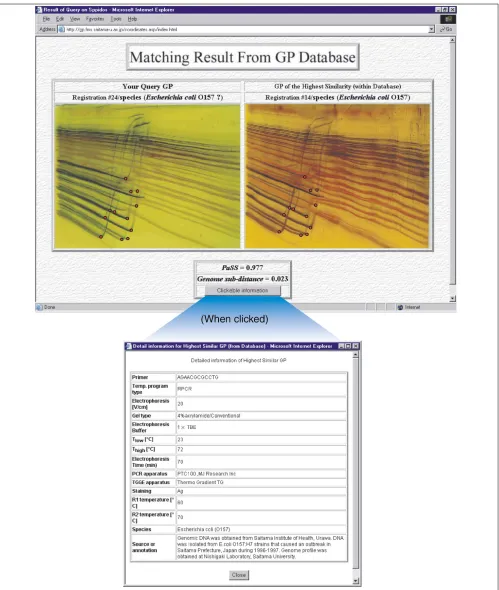
Figure 1 shows one of the results obtained using the proto-cols described in the Materials and methods. For the query species, the closest species as judged by spiddos and a list of genome profiles within the tolerance (), together with the annotation attached to it, is given (Figure 1). If there is a genome profile among the list annotated with species, then it means that the query species is identified with the confi-dence defined by the pattern similarity score (PaSS; see Materials and methods). If the value of PaSS is very high (that is, close to unity), then it is highly probable that it is indeed an exact match. In contrast, if the value is not suffi-ciently close to unity, then it may be only a related species (not the exact species), belonging to the same genus or family or any of the higher taxonomical categories, depend-ing on the value of PaSS. Although we do not yet have enough data to determine the PaSS value at which it is safe
to identify a species, we have a preliminary idea, based on experience, that 0.95 (Zscore 4) may be a critical value [15]. The important challenge of how to reconcile the differ-ence between identification of species by phenotype, which conventional taxonomy has adopted, with that based on genotype, is discussed later. An important aspect of this system is that one does not need to be a specialist in the rele-vant biological field to obtain an initial identification of an unknown organism. All that is required is to register the genome profile of the unknown species on the database. Therefore, an incomplete set of phenotypic data, which do not reach the criteria for species identification (say, peculiar behaviors or unusual properties), can also be registered and later used without having to undertake further laborious phenotypic identification (Figure 2). All the information regarding a given species (in other words, all the entries within a certain PaSS value) will be connected automatically, generating a volume of data on a particular species. Scien-tists can work cooperatively to identify species and collect their phenotypic traits (Figure 2). In conventional approaches to identification, most of which have been phe-notype-based, those data that failed to meet the required cri-teria for identification were left unconnected, and could not be used later because there was no convenient way of corre-lating them with a given species without knowing the species name (Figure 2). Thus, our approach of genotype-based species identification, utilizing genome profile and the Inter-net, will be of great help to the field of taxonomy.
Key concepts of the on-web genome profiling
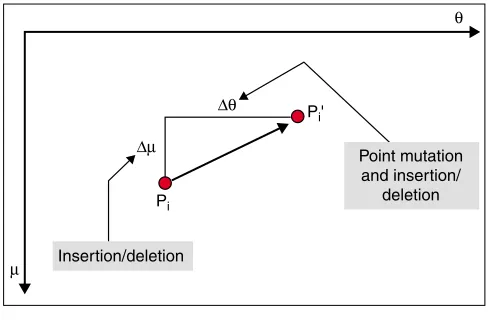
In evaluating the effectiveness of this methodology, the nature of PaSS must first be considered, as it plays the most important part in the method. As PaSS is calculated on the basis of the coordinates of spiddos (see Equation 1 in Materi-als and methods), the nature of spiddos must be thoroughly investigated. If two genomic DNAs contain common sequence regions that can be amplified by random PCR using the same primer, the resultant DNAs will usually generate similar spiddos (by definition, the spiddos obtained by TGGE represent the crucial points of a genome profile, points at which the temperature corresponds to the beginning of a prominent structural transition in DNA [15]). As shown schematically in Figure 3, two corresponding spiddos derived from two closely related species can be connected by a dis-placement vector, which consists of two independent ele-ments of mobility () and temperature (). The differences in each element (and ) can be related to the differences between two sequences as shown in Figure 3. The displace-ment in the ordinate is caused by the difference in length between the two DNAs and is caused by deletion or insertion, whereas that in the abscissa is mainly caused by point muta-tion (although insermuta-tion/delemuta-tion can also contribute).
comment
reviews
reports
deposited research
interactions
information
[image:3.609.55.554.84.674.2]refereed research
Figure 1
approximately proportional to the time since divergence, and thus to the genome-to-genome distance. By using a suf-ficient number of spiddos, we can obtain statistically reliable results. Empirically, we know that 8-10 spiddos, which can be obtained from a single genome profile, can be significant. However, since the more spiddos the better the result, we tentatively made it a rule to adopt four genome profiles (32-40 spiddos) - that is, four random-PCR products - as a current standard of initial species identification. Therefore, PaSS has the theoretical and empirical basis to be used as a measure of similarity between genomes, although the extent of its effectiveness remains to be shown experimentally as data accumulates. We have introduced a measure of distance,
d, obtained from PaSS as formulated in Equation 2 (see Materials and methods), for the sake of convenience [15].
We call da genome sub-distance because it is based not on the whole but a part of the genome sequence. Thus, we intro-duce (true) genome distance, d, as in Equation 3 (see Materi-als and methods). Genome distance must have a close relationship with genetic distance, as defined by Nei and others [17-19], although there is a difference in the defini-tion. The genetic distance based on sequences is basically the Hamming distance (the number of different letters at each corresponding position of two sequences of letters that are optimally aligned) between two nucleotide (or amino-acid)
sequences. In aligning sequences arbitrariness is introduced, depending on the algorithm and parameters used [20]. Another constraint on genetic distance is that it is usually obtained from a limited number of genes, although that is also the case for genome distance. As genome distance is easier to obtain in practice using our method, it should be easier to obtain a lot of data on it compared with genetic dis-tance. On the basis of d (in practice d), we can construct phylogenetic trees and genome sequence space (an imagi-nary spherical space in which all the genomes (individuals) can be uniquely located in a finite manner based on the dis-tance between genomes, providing clusters of species (K.N., unpublished observations)).
[image:4.609.313.557.86.246.2]Although the applicability and effectiveness of genome dis-tance for such purposes needs to be further investigated, it is obvious that an organism that has near-zero genome dis-tance from a certain standard species, as an average over four or more genome sub-distances obtained from as many genome profiles, can be easily assigned to that same species with a high level of confidence. We are not claiming, however, to be able to give the correct taxonomical name to any species using this method. The greater the number of strains registered in the database, the more easily will a species be assigned. Basically, no special efforts, except expanding the database and using sophisticated algorithms, are necessary to raise the proportion of correct assignments. This is the self-developing nature of the database. Therefore, this methodology has two potential great advantages for ten-tative species identification: first, expertise is not always necessary; and second, database building can be carried out in a self-developing manner (that is, by acquiring more and more accurate data on species) with no waste of information.
Figure 2
How to assign species in phenotype-based and genotype-based approaches. Phenotype-based approaches (indicated by p1, p2and p3) are heavily dependent on the traits (phenotypic or behavioral, appearing as different shapes) to identify species. In order to clarify such traits, sophisticated instruments and expert skills are often required. p2 represents a successful identification attempt, where all the required traits for identifying the species have been obtained, whereas p1and p3 are not successful because of insufficient information. Identity confirmed by genome profile in the genotype-based approaches makes it easy to compare and link unknown species (g1-g3) to known ones (g0) without the requirement for extensive knowledge of phenotypic traits. Thus, the traits of each organism can be attributed to a particular species.
p
1p
2p
3g
1g
2g
3g
0(Concept)
species
Organism
(Substance)
[image:4.609.56.298.88.277.2]GP GP GP GP
Figure 3
Causes of displacement in spiddos. The displacement between two spiddos (Piand Pi’) from two genome profiles can be decomposed into two elements, and . , which results from the shift in melting temperature, must have been caused mainly by point mutation and sometimes by deletion/insertion. On the other hand, , which is a measure of length, must be a result of insertion/deletion events occurring in the DNAs.
Insertion/deletion
Point mutation and insertion/
deletion Pi
Pi'
∆µ
µ
θ
Materials and methods
The principle that a species can be identified on the basis of its similarity to a standard species remains unchanged in the shift from phenotype-based to genotype-based methodology. Therefore, the essence of our methodology resides in finding a sufficiently closely related species by way of a measure of similarity - a pattern similarity score (PaSS). Note that this genotype-based methodology cannot define species under the current taxonomy regime, in which phenotype is used as the defining characteristic of species [2].
General protocol for on-web genome profiling
Although genome profiling is the basic technology for our current purpose, provisional species identification based on genotype can be fulfilled only by using computer-aided data-base technology, which is most effectively constructed in the Internet environment. As this methodology is based on use by a large number of scientists, the protocol must be designed to be reproducible and easy to carry out. The processes have been deliberately designed with this in view, and are presented on our website [21].
Genome profiling consists of two basic technologies: random PCR and TGGE, which have been well established [22-24]. However, if it is to be used for the purpose of general and uni-versal applications, well-defined standardization is absolutely required to obtain significant results. We have carried out such standardization for genome profiling. The main topics included in the protocol are: preparation of genome DNAs; the set of primers used for random PCR and the internal ref-erence DNAs used for TGGE; experimental conditions for random PCR; and the experimental conditions for TGGE. The protocol also includes the related procedures (extraction of spiddos, calculation of PaSS, and others).
Preparation of genomic DNA
Briefly, the alkaline extraction method was selected for sim-plicity as follows: 10 mg of cells or tissue are placed in an eppendorf tube and heated for 1 min at 100°C. The cells are mixed with 10g 0.5 M NaOH and stirred for 1 min (or 5 min or so for stiffer cells such as yeast) using a micro-homogenizer, if necessary, with added quartz sand. Immedi-ately, a 5l aliquot of the lysate is mixed with 495l 100 mM Tris-HCl (pH 8.0). Usually, a 3l aliquot of the mixture thus obtained is used as a template for 100-l-scale PCR. In some cases, such as Escherichia coli, which does not have a strong cell envelope, these cell-breakdown processes can even be omitted and the cells can be directly used in PCR. In other cases, such as fungi, thorough mechanical treatment (grinding with quartz sand) is needed. Thus, minimal and common procedures are preferred as much as possible for simplicity and generality in so far as they are consistent with the purity and integrity of the DNA samples. DNA samples thus prepared were shown to be identical with those DNAs prepared by the more elaborate conventional method of Thomas [25] as a PCR template [26]. This seems
quite natural, as PCR can be carried out successfully in the presence of contaminating proteins or polysaccharides, irrespective of the DNA cleavages introduced, unless the regions of DNA to be amplified are completely cleaved. Nonspecific binding of proteins, which gives footprint effects, will change the yield but not the molecular ratio of random PCR products as long as the binding is totally sto-chastic. We also adopt a universal, convenient definition for genome DNA - that it is composed of all DNAs thus pre-pared, including dynamic elements such as satellite and organelle DNAs, and is irrespective of haploid or diploid status of the cells. Therefore, the DNA samples for genome profiling can be prepared in a common, technically well-defined method for all organisms.
Set of primers for random PCR
Technically important restrictions are introduced by selecting a standard set of primers for random PCR (T.W., A.S., M.N. and K.N., unpublished observations). It is important to carry out random PCR with all kinds of organisms using the same primers so that all species can be compared on the same plat-form. We have initially selected four oligonucleotides (pfM12: dAGAACGCGCCTG; pfM19: dCAGGGCGCGTAC; d(TGC)3; d(T3G3)2) as a standard set of random PCR primers. The
primers pfM12 and pfM19 were selected on the basis of the abundant experimental background on them, whereas d(TGC)3 and d(T3G3)2 were rather theoretically favored
(K.N. and A.S., unpublished observations). ‘Oligonucleotide-stickiness analysis’, which monitors oligonucleotide-binding sites along the template DNA (K.N. and A.S., unpublished observations), was exploited to determine the universal primers and moderately sticky oligonucleotides were selected. These four primers can be fluorescently labeled for convenience. More primers can be used to obtain more detailed information or to supplement insufficient informa-tion provided by the four primers about particular pairs of organisms. The information provided by such extra primers can explore in a more detailed manner the local landscape in genome sequence space. In contrast, the standard primers give us rough relationship between any pair of organisms.
Internal reference DNAs
Internal reference bands, which are provided by DNAs of a known melting pattern, are used to calibrate each genome profile, giving highly reproducible results [22].
Conditions for random PCR
Random PCR is usually carried out under standard condi-tions: 10 ng template DNA, 50 pmol primer DNA, 250 µM of each dNTP, 50 mM Tris-HCl (pH 8.8), 15 mM (NH4)2SO4, 10 mM MgCl2, 0.45% Triton X-100, 200 µg/ml bovine
serum albumin and 2 units of TaqDNA polymerase (Biotech International). PCR was carried out in 30 cycles of 30 sec at 94°C, 2 min at 28C and 2 min at 47C, using a thermal cycler PTC-100TM (MJ Research, MA). Annealing tempera-ture can be attenuated depending on the size of the template
DNA (in general, the larger the template, the greater the number of DNA fragments generated by random PCR).
Experimental conditions for TGGE
TGGE analysis of random PCR products is carried out with co-migrating internal reference DNAs. TGGE can be either the conventional type or a micronized type [16]. At least two feature points are extracted from the band pattern of the internal reference DNA(s), and then used for calibration of genome profiles or species identification dots (spiddos) [15] as described below. After calibration, sufficiently high repro-ducibility of the pattern of spiddos is guaranteed [16].
Extraction of spiddos
Although the genome profile is a kind of reduction of infor-mation contained in the whole genome sequence, it is still too complicated to deal with as it is. Thus, a second reduc-tion is carried out by extracting feature points (spiddos) from the genome profiles. Double-stranded DNAs are known to melt in an intrinsically determined manner, depending on their sequence, when heated gradually [27]. All the interme-diate states of DNA have their own structure and mobility in gel. Spiddos correspond to the structural transition points appearing in band patterns (Figure 4). Currently, there are four kinds of spiddos: initial melting point (Pini); minimum mobility point (Pmin); isomobility point (Piso); and the end melting point (Pend). Empirically, Pini is the most
repro-ducible. Therefore, Piniis recommended for working spiddos wherever possible. Further details are given in the standard protocol on our website [21].
Calculation of PaSS and genome distance
A set of spiddos (around ten), assigned to a genome profile on a computer display, is processed to calculate the normal-ized mobility and temperature of each point. A measure of
similarity of two genomes - the PaSS - is introduced as follows.
n P
i(1) – Pi(2)
PaSS = 1 - —1n
冱
————————— (1) i=1Pi(1) P
i(2)
Pof each spiddo (1 to n) is its position vector and is a func-tion of temperature and mobility (that is, P= P (T, m)). The superscripts 1 and 2 in parentheses in Equation (1) rep-resent genomes 1 and 2, respectively. PaSS will be unity for a complete match in two sets of spiddos. In general, 0 PaSS 1. Genome distance and genome sub-distance (d) are derived from PaSS as follows:
d= (1 - PaSS)/PaSS (2)
n
d = lim
冱
d(i) /n (3)ni=1
Where d(i) is the ith genome sub-distance obtained with the
ith primer used for random PCR.
Computer-aided data acquisition
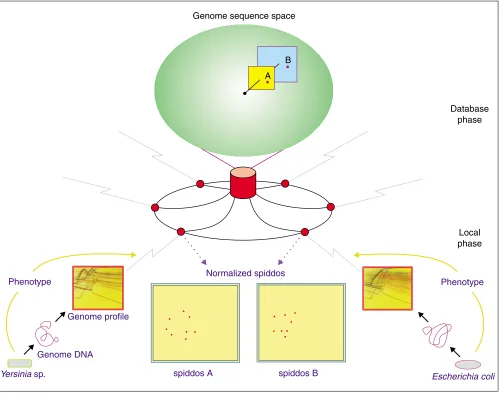
[image:6.609.56.558.518.683.2]The overall process of obtaining an on-web genome profile is shown in Figure 5. There are two steps in this methodology: the local phase and the database phase. In the local phase, genome profiling is carried out for the organism of interest, following the standard protocol presented on our website [21] and outlined in the previous sections. After obtaining a genome profile, the database is accessed and the database phase is begun as a client. The database site requires the client to input an image of the genome profile, to assign
Figure 4
Spiddo assignment. (a)A genome profile before processing. The temperature gradient is set from left (low) to right (high) and the direction of migration is top to bottom; IR, internal reference band used for normalization. (b)The spiddos of the genome profile are marked with red filled circles; those of the IR are indicated with red open circles. All the spiddos except for the rightmost one are at the first transition of DNA melting (Pini). Although there are four kinds of spiddos (dots), as described in Materials and methods, Piniis used for simplicity as these points are clearly visible.
IR
spiddos on the genome profile (Figure 4), and to fill in rele-vant data on the online form. The site will search the data-base for species with the most similar pattern of spiddos by calculating the PaSS [15].
Acknowledgements
This study was supported in part by a Grant-in-Aid (09272203) from the Ministry of Education, Science, Sports and Culture of Japan. M.N. was sup-ported by the Japan Society for Promotion of Science (13001147).
References
1. Woese CR, Kandler O, Wheelis ML: Towards a natural system of organisms: Proposal for the domains Archaea, Bacteria, and Eukarya.Proc Natl Acad Sci USA1990, 87:3140-3145.
2. Wayne LG, Brenner DJ, Colwell RR, Grimont PAD, Kandler O, Krichevsky MI, Moore LH, Moore WEC, Murray RGE, Stackebrandt E, et al.: Report of the ad hoc committee on reconciliation of approaches to bacterial systematics. Int J Syst Bacteriol1987, 37:463-464.
3. Olsen GJ, Overbeek R, Larsen N, Marsh TL, McCaughey MJ, Maciukenas MA, Kuan WM, Macke TJ, Xing Y, Woese CR: The Ribosomal Database Project.Nucleic Acids Res1992, 20:199-200. 4. Preparata RM, Meyer EB, Preparata FP, Simon EM, Vossbrinck CR, Nanney DL: Ciliate evolution: the ribosomal phylogenies of the tetrahymenine ciliates.J Mol Evol1989, 28:427-441. 5. Martinez JG, Bescos I, Sala JJR, Valera FR: RISSC: a novel
data-base for ribosomal 16S–23S RNA genes spacer regions. Nucleic Acids Res2001, 29:178-180.
6. Maidak BL, Cole JR, Lilburn TG, Parker CT Jr, Saxman PR, Farris RJ, Garrity GM, Olsen GJ, Schmidt TM, Tiedje JM: The RDP-II (Ribo-somal Database Project).Nucleic Acids Res2001, 29:173-174. 7. Yamamoto S, Harayama S: PCR amplification and direct
sequencing of gyrBgenes with universal primers and their application to the detection and taxonomic analysis of
comment
reviews
reports
deposited research
interactions
information
[image:7.609.55.559.87.484.2]refereed research
Figure 5
On-web genome profiling. The overall procedures to tentatively identify species by genotype only (genome profiling) are shown. Genome profiles are prepared by TGGE of random PCR products obtained from the genome DNA of a particular organism at the client site (the local phase). After accessing the database (represented by the red cylinder), a client (red circle) has spiddos assigned to each genome profile, which are used to calculate the measure of similarity, PaSS, and will finally get an output of the nearest species registered in the database (this phase of the process is called the database phase). Genome sequence space, with the location of the genomes A and B, is shown in green above the database of genomes.
B
A
Genome DNA
Yersinia sp.
Genome profile Phenotype
spiddos A spiddos B
Normalized spiddos
Escherichia coli Phenotype
Genome sequence space
Database phase
Pseudomonas putidastrains.Appl Environ Microbiol1995, 61: 1104-1109.
8. Maiden MC, Bygraves JA, Feil E, Morelli G, Russell JE, Urwin R, Zhang Q, Zhou J, Zurth K, Caugant DA, et al.: Multilocus sequence typing: a portable approach to the identification of clones within populations of pathogenic microorganisms. Proc Natl Acad Sci USA1998, 95:3140-3145.
9. Tsipouras P: Restriction fragment length polymorphisms. Methods Enzymol1987, 145:205-213.
10. Vos P, Hogers R, Bleeker M, Reijans M, van de Lee T, Hornes M, Fri-jters A, Pot J, Peleman J, Kuiper M, Zabeau M:AFLP: a new tech-nique for DNA fingerprinting. Nucleic Acids Res 1995, 23:4407-4414.
11. Kim J, Nietfeldt J, Benson AK: Octamer-based genome scanning distinguishes a unique subpopulation of Escherichia coli
O157:H7 strains in cattle.Proc Natl Acad Sci USA1999, 96: 13288-13293.
12. Williams JG, Kubelik AR, Livak KJ, Rafalski JA, Tingey SV: DNA polymorphisms amplified by arbitrary primers are useful as genetic markers.Nucleic Acids Res1990, 18:6531-6535.
13. Nishigaki K, Naimuddin M, Hamano K: Genome profiling: a real-istic solution for genotype-based identification of species.J Biochem2000, 128:107-112.
14. Nishigaki K, Amano N, Takasawa T: DNA profiling: an approach of systematic characterization, classification, and compari-son of genomic DNAs.Chem Lett1991, 1991: 1097-1100. 15. Naimuddin M, Kurazono T, Zhang Y, Watanabe T, Yamaguchi M,
Nishigaki K: Species-identification dots: a potent tool for developing genome microbiology.Gene 2000, 261:243-250. 16. Biyani M, Nishigaki K: Hundredfold productivity of genome
analysis by introduction of microtemperature-gradient gel electrophoresis.Electrophoresis 2000, 22:23-28.
17. Barnabas J, Goodman M, Moore GW: Descent of mammalian alpha globin chain sequences investigated by the maximum parsimony method.J Mol Biol1972, 69:249-278.
18. Nei M, Chakraborty R: Genetic distance and electrophoretic identity of proteins between taxa.J Mol Evol1973, 2:323-328. 19. Tateno Y, Nei M, Tajima F:Accuracy of estimated phylogenetic
trees from molecular data. I. Distantly related species.J Mol Evol1982, 18:387-404.
20. Argos P: Sensitive methods for determining the relatedness of proteins with limited sequence homology.Curr Opin Biotech-nol1994, 5:361-371.
21. On-Web GP[http://gp.fms.saitama-u.ac.jp]
22. Nishigaki K, Tsubota M, Miura T, Chonan Y, Husimi Y: Structural analysis of nucleic acids by precise denaturing gradient gel electrophoresis: I. Methodology.J Biochem1992, 111:144-150. 23. Henco K, Harders J, Wiese U, Riesner D: Temperature gradient
gel electrophoresis (TGGE) for the detection of polymor-phic DNA and RNA.Methods Mol Biol1994, 31:211-228. 24. Wartell RM, Hosseini S, Powell S, Zhu J: Detecting single base
substitutions, mismatches and bulges in DNA by tempera-ture gradient gel electrophoresis and related methods. J Chromatogr A1998, 806:169-185.
25. Berns KI, Thomas CA Jr: Isolation of higher molecular weight DNA from Hemophilus influenzae. J Mol Biol1965, 11:476-490. 26. Hamano K, Takasawa T, Kurazono T, Okuyama Y, Nishigaki K:
Genome profiling- establishment and practical evaluation of its methodology.Nikkashi 1996, 1996:54-61.