Georgia State University
ScholarWorks @ Georgia State University
Public Health Theses School of Public Health
Spring 3-22-2018
Spatial Analysis of County Level Influenza
Vaccination Coverage Estimates
Seth Meador
Follow this and additional works at:https://scholarworks.gsu.edu/iph_theses
This Thesis is brought to you for free and open access by the School of Public Health at ScholarWorks @ Georgia State University. It has been accepted for inclusion in Public Health Theses by an authorized administrator of ScholarWorks @ Georgia State University. For more information, please contact [email protected].
Recommended Citation
i ABSTRACT
Spatial Analysis of County Level Influenza Vaccination Coverage Estimates
By
Seth Abram Meador
3/22/18
INTRODUCTION: The Centers for Disease Control and Prevention (CDC) reported 43.3% of adults (>18) received a flu vaccination in the 2016-17 season (FluVaxView, 2018). Despite long-standing recommendations and the enormous burden caused by the virus, vaccination coverage for flu is consistently low across seasons.
AIMS: This study examines influenza vaccination coverage among adults at the county level, in
the contiguous United States (U.S.), to identify clusters of high and low coverage as well as assess access to care variables that could impact coverage levels.
METHODS: County level influenza vaccination coverage estimates from the 2014 Behavioral Risk Factor Surveillance System (BRFSS) were examined to identify statistically significant clusters using global (Moran’s I) and local (Local Indicators of Spatial Association (LISA)) spatial clustering tests in GeoDa 1.10. To examine spatial effects of area provider supply and population demand variables, regression analyses were performed in GeoDaSpace. Independent variables were obtained from the Area Health Resource File (AHRF) and the National Council for Prescription Drug Program (NCPDP).
RESULTS: The Moran’s I value comparing coverage estimates to the spatially lagged values was 0.48, indicating the coverage estimates are not spatially random. Five hundred sixty five counties were considered ‘High-High’, four hundred sixty three were ‘Low-Low’, and sixty seven had high coverage but were surrounded by counties with low coverage, designated as ‘High-Low’. ‘Low-High’ counties are defined as counties with low coverage surrounded by counties with high coverage. Forty counties were considered ‘Low-High’ in this analysis. The final regression model used a regime to stratify counties by states that expanded Medicaid under the Affordable Care Act and those that did not. Among counties in states that did not expand Medicaid, the variables per capita pharmacies, per capita clinics, and percent less than sixty five years with no health insurance had no statistically significant associations with the outcome. In counties that were part of the Medicaid expansion, only per capita pharmacies and per capita clinics were not significant.
DISCUSSION:Per capita health care providers were statistically significant and positively
associated with influenza vaccination coverage in both regime models, but had a larger regression coefficient in the expanded Medicaid regime model.
ii
Spatial Analysis of County Level Influenza Vaccination Coverage Estimates
by
Seth A. Meador
B.A., KENNESAW STATE UNIVERSITY
M.P.H. Candidate, GEORGIA STATE UNIVERSITY SCHOOL OF PUBLIC HEALTH
A Thesis Submitted to the Graduate Faculty of Georgia State University in Partial Fulfillment
of the
Requirements for the Degree
MASTER OF PUBLIC HEALTH
iii APPROVAL PAGE
Spatial Analysis of County Level Influenza Vaccination Coverage Estimates
by
Seth A. Meador
Approved:
Lee Mobley, PhD Committee Chair
Stacie Greby, DVM, MPH Committee Member
iv Acknowledgments
My sincerest gratitude to Drs. Lee Mobley and Stacie Greby for sharing their knowledge, for providing guidance, and support through this process. I am truly honored to have the
opportunity to learn from such talented individuals.
v Author’s Statement Page
In presenting this thesis as a partial fulfillment of the requirements for an advanced degree from Georgia State University, I agree that the Library of the University shall make it available for inspection and circulation in accordance with its regulations governing materials of this type. I agree that permission to quote from, to copy from, or to publish this thesis may be granted by the author or, in his/her absence, by the professor under whose direction it was written, or in his/her absence, by the Associate Dean, School of Public Health. Such quoting, copying, or publishing must be solely for scholarly purposes and will not involve potential financial gain. It is understood that any copying from or publication of this dissertation which involves potential financial gain will not be allowed without written permission of the author.
vi TABLE OF CONTENTS
ACKNOWLEDGMENTS ...iv
LIST OF TABLES………...………viii
LIST OF FIGURES………ix
INTRODUCTION...1
REVIEW OF THE LITERATURE...2
Barriers to vaccination ………...…….2
Disparities………3
Healthcare Providers…………...………….………4
Knowledge, attitudes, and beliefs………...…….4
DATA SOURCES………...5
Behavioral Risk Factor Surveillance System (BRFSS)………...5
Area Health Resource File (AHRF)……….6
National Council for Prescription Drug Program (NCPDP)………6
MEASURES………...6
METHODS………..7
Spatial Autocorrelation………...……….………7
Spatial Regression………8
SPATIAL CLUSTERING ANALYSIS………..9
REGRESSION ANALYSIS………..…....10
RESULTS...11
DISCUSSION AND CONCLUSION...12
vii List of Tables
Table 1. Sample Statistics for States that did not Expand Medicaid
Table 2. Sample Statistics for States that did Expand Medicaid
Table 3. Spatial Regime Regression Analysis of Influenza Vaccination Coverage Among Adults in U.S. Counties
viii List of Figures
Figure 1. Cluster Analysis Results
1
Introduction
Annually, the U.S. experiences an influenza (flu) epidemic with unpredictable gradients
of severity. The virus is responsible for thousands of deaths and hospitalizations (CDC, 2018).
The Centers for Disease Control and Prevention (CDC) reported 43.3% of adults (>18) received
a flu vaccination in the 2016-17 season (FluVaxView, 2018). Receiving an annual flu
vaccination is considered an effective method of preventing the flu, and is recommended for
everyone six months of age and older without contraindications by the Advisory Committee on
Immunization Practices (Grohskopf et al., 2017). Different vaccine types are available for use,
including unadjuvanted, egg-based trivalent and quadrivalent inactivated influenza vaccines
(IIV3 and IIV4), adjuvanted trivalent egg-based inactivated influenza vaccines (aIIV3),
high-dose trivalent egg-based inactivated influenza vaccines (hd IIV3), quadrivalent cell culture–
based inactivated influenza vaccines (ccIIV4), and recombinant trivalent influenza vaccines
(RIV3) (Budd, et al., 2016). The quadrivalent live attenuated intranasal influenza vaccine
(LAIV4) was not been recommended for use in the 2017-18 season because of concerns about
effectiveness (Budd, et al., 2016). Despite long-standing recommendations and the enormous
burden caused by the virus, vaccination coverage for flu is consistently low among adults 18-64
years across seasons. Examining contextual factors of vaccination coverage at a finer geographic
resolution (county) may provide clues to better target specific populations.
Using spatial data this analysis sought to answer the following: 1) were 2014 county level
flu vaccination coverage estimates clustered locally among U.S. counties, or were the estimates
spatially random? It was hypothesized that statistically significant clusters of both high and low
coverage estimates will be detected. Findings of significant clusters would suggest that
2 across counties in the U.S. statistically and significantly related to area provider supply and
population demand variables? If so, which independent variables seem to have the greatest
impact? The ability to assess whether a county was influenced by adjacent counties, also known
as spillover effect, is an additional benefit from estimating spatial regression. As discussed in
Trogdon and Ahn (2015) such spillovers would suggest that targeting interventions to increase
influenza vaccination in one area could have spillover benefits that would lead to increases in
neighboring areas as well.
Literature Review
The selection of literature regarding adult vaccination coverage and spatial analysis is
limited in scope. However, similar methods have been utilized to assess childhood vaccination
(Omer et al. 2008; Trogdon and Ahn, 2015) as well as stroke hospitalization clusters over time
(Schieb, et al, 2013). An analysis of immunization registry data from North Carolina revealed
clusters of low coverage rates among uninsured and publicly insured children, concluding
coverage was lower in areas of persistent poverty and shortages of providers, indicating
out-of-pocket costs are only one of numerous factors contributing to low coverage (Trogdon and Ahn,
2015). Using the 2014 county level estimates provided by the Behavioral Risk Factor
Surveillance System (BRFSS), this project provides a new perspective on identifying both
clusters of above-average and below average-vaccination, the provider supply and population
demand characteristics that define those areas, and how those characteristics compare across the
two types of areas. Additionally, this project can demonstrate the value of applying spatial
techniques to gain new knowledge in public health.
Barriers to influenza vaccination uptake have been identified consistently throughout the
3 Healthy People 2020 target of 70% (HP2020, 2017). With their analysis of the 2009 BRFSS
data, Takayama et al. found a negative association between receiving the flu vaccine and having
an income less than $35,000, as well as those without health insurance (2012). This association
continued despite increased coverage with advanced age. Higher levels of flu coverage are
generally seen among adults older than sixty five years as compared to adults eighteen to sixty
four (FluVaxView, 2017), which is likely the result of mandatory coverage of the vaccine by
Medicare and generally utilize health care more often than those less than sixty five years. Lu et
al. found similar results when analyzing data from the National Health Interview Survey (2013).
They concluded that adults 18-64 years were more likely to have received the vaccine if they
were employed, living at or above poverty, and had health insurance.
Disparities in flu vaccination coverage by race were identified in the 2011-12 season by
Lu et al. (2014) and remains a consistent theme throughout the literature. In the 2016-17 season
coverage for Asians was 52.8% while coverage for Hispanic whites was 47.5%,
non-Hispanic blacks 43.0%, non-Hispanics 46.2%, American Indian/Alaska Natives was 41.8%, and
people of other or multiple races was 46.7% (FluVaxView, 2018). Addressing the enduring
coverage gaps are difficult given the combination of factors, including: socio-demographic
characteristics, patients and provider attitudes toward vaccination, awareness of
recommendations, systems used in clinics serving different patient populations, preventive care,
propensity to seek and accept vaccination, and quality of care received by racial/ethnic
populations (Lu et al. 2014). Quinn et al. noted a similar list of contributing factors for
disparities in coverage in their study of flu vaccination among African Americans specifically
4 Healthcare providers, both medical and pharmacy trained, are instrumental in increasing
flu vaccine uptake. These providers are in a unique position to educate their patients and address
potential concerns, with one literature review citing pregnant women rely almost entirely on their
medical provider for information during pregnancy (Myers, 2016). Routine visits to healthcare
providers are essential to increasing coverage, and the inability to pay for the visit has been
negatively associated with receiving the influenza vaccine in numerous studies (Takayama et al.,
2012; Lu et al., 2016; La et al., 2017). However, few studies have examined the association
between healthcare provider density and influenza vaccination coverage. Gai & Gu combined
individual level data from BRFSS and healthcare provider data from the Area Health Resource
file and concluded an increase in provider density was associated with greater odds of receiving
the flu vaccine (2014). Associations between vaccination coverage and pharmacy density has
been explored in greater detail. Examining the same data set, but replacing per capita physicians
with per capita pharmacies, Gai and Feng concluded the number of pharmacies per 1000 people
was associated with greater odds of receiving a flu shot (2017). Murphy et al. found that
pharmacies in medically underserved areas administered one third of all influenza vaccinations
in the 2009-10 flu season (2012).
Knowledge, attitudes, and beliefs have tremendous influence on the decision to receive
the flu vaccine. In a systematic review of the literature Yeung et al. concluded that perceived
vaccine efficacy and safety were main deterrents to receiving the vaccine, and were more
influential factors than an increase in knowledge of influenza (2016). Internet panel surveys of
pregnant women revealed concern of the vaccine’s safety and effectiveness. However, women
5 more likely to be vaccinated than those that did not receive the recommendation (Ding et al.,
2017).
Data Sources
County level influenza vaccination coverage estimates were obtained from the BRFSS
Small Area Estimation (SAE) project. Due to an increased demand for local level data, BRFSS
developed methods to produce county level prevalence estimates for flu vaccinations as well as
other public health indicators for health policy and program evaluation (BRFSS, 2018). The
BRFSS SAE method relied on data from 4 sources: 1) the 2013 BRFSS (n = approximately
430,000 individual survey responses), which provides data on health behaviors, demographic
characteristics, and county; 2) the 2008–2012 American Community Survey (ACS) Public Use
Microdata Sample (PUMS), which provided individual-level data with person weights (n =
approximately 11,600,000) and Public Use Microdata Areas (PUMAs); 3) the Missouri Census
Geographic Equivalency File (GEOCORR), which matched counties and PUMAs; 4) the 2013
Nielsen Claritas population totals used for weighting to county-level populations (Pierannunzi et
al, 2016). Prevalence estimates were created by aggregating individual level probabilities,
generated by linear random effects models, to the county level. Variables used in the final
specified model included demographic factors such as age, sex, race or ethnicity, and used
county as the random effect. Internal validity was checked by comparing imputed estimates to
estimates generated directly from BRFSS data. To verify external validity, imputed estimates for
the proportion of the population (18-64 years) without health insurance were compared to
proportions generated by the ACS.
In the empirical model estimated here, demographic variables were explicitly excluded
6 Predictor variables in the empirical model included provider supply characteristics and
population demand characteristics thought to be important in this ecological model of flu
vaccination uptake. Most of these variables were obtained from The Area Health Resource File
(AHRF), 2016-17. This data set acts as a repository for dozens of population health related data
sources and provides estimates at the county, state, and national levels. More than fifty sources
are combined in the AHRF under eight categories: Health Care Professions, Health Facilities,
Population Characteristics, Economics, Health Professions Training, Hospital Utilization,
Hospital Expenditures, and Environment (HRSA, 2018). In conjunction with AHRF data,
pharmacy location data from the National Council for Prescription Drug Program (NCPDP) was
used in the final model. NCPDP provides unique identification numbers to pharmacies to
improve interactions with the federal government. All data provided to NCPDP is self-reported
from each pharmacy.
Measures
To determine the influence of supply variables such as access to care on influenza
vaccination, variables were created for per capita healthcare providers, per capita clinics, and per
capita licensed pharmacists by county. Healthcare providers included primary care doctors,
obstetricians and gynecologists (OB/GYNs), Physician’s Assistants, and Nurse Practitioners.
Federally Qualified Health Centers were combined with Rural Health Clinics to calculate the
variable per capita clinics. A file from NCPDP containing pharmacy addresses was geocoded
using ESRI’s ArcMap to determine the number of pharmacies per county. After completing a
quality assurance check on the unmatched addresses, the geocoded addresses were spatially
7 process that produces a sum of all points in each polygon (county). The sum was divided by the
total population in each county to calculate the per capita pharmacist variable.
Because of strong evidence correlating insurance status with vaccination status, the
variable percent of persons under sixty five years without health insurance, from the AHRF, was
included in the model. Socioeconomic factors reflecting population demand included percent
persons in poverty, and percent urban population of each county.
Methods
Spatial autocorrelation is defined as the correlation among values of a single variable
with adjacent values in terms of their geospatial location. When groups of values are similar
among neighboring locations, there is spatial clustering in the values. When being more similar
to a neighbor is due to some reciprocation – also known as a ‘spillover’ effect – then neighboring
observations are not independent, which can cause problems in regression analysis (Griffith,
1987). Since the early 1950s the global Moran’s I test has been used to quantify the presence of
spatial clustering and is applicable to nearly any discipline that incorporates spatially referenced
data. Subsequently, a statistical procedure was developed using the global Moran’s I logic that
allows for the decomposition of global indicators into the local contribution of each individual
observation to detect statistically significant high and low local clusters, relative to the mean of
all observations (Anselin, 1995).
County level vaccination coverage clusters were assessed using global and local spatial
clustering tests. All spatial analyses were conducted with GeoDa 1.10. Assessment began with
creating a spatial weights matrix to establish spatial relationships among counties in the data set.
8 identify the spatial neighbors for each county. The Global Moran’s I is used to determine if the
data are spatially random or if clustering is present. If the Moran’s I is a positive number
between 0 and 1 and the p-value is significant (α≤.05), then we can say local clustering is
occurring somewhere among the map features. To locate the local clusters, we conduct the
Local Moran’s I test. The output is displayed on a map with five classifications as either ‘Not
Significant’, ‘High-High Cluster’, ‘Low-Low Cluster’, ‘High-Low Outlier’, or ‘Low-High
Outlier’. A ‘High-High Cluster’ is defined as the central county and its neighbors have values
that are statistically significantly different than the mean. ‘Low-Low Clusters’ are defined in the
same way except their values are below the mean. ‘High-Low’ or ‘Low-High’ indicate a central
county with a statistically significantly different value that is the inverse of its neighbors.
Next, if significant clusters were found, we would expect that the regression analysis
should include spatial effects. The exploratory Ordinary Least Squares (OLS) regression
analysis included all areas and all predictor variables together, and specification tests on the
residuals of the regression were used to determine what refinements to the simple OLS model are
required for producing reliable estimates. These explorations revealed that spatial spillovers
were present in the data. Further analysis grouping the Medicaid expansion and non-expansion
states suggested that groupwise heteroscedasticity was confounding the estimates in a
single-equation model. The final spatial regression model was stratified into two separate single-equations to
represent the group of states that expanded Medicaid under the Affordable Care Act in 2014
(ACA, 2018), versus the group that did not.
To address unmodeled spatial heterogeneity and spatial autocorrelation, GeoDaSpace was
used to estimate a third model, including both lag and error terms, and used a spatial regime that
9 The model was specified with General Method of Moments and ‘KP-HET’ which accounts for
spatial heteroskedasticity to produce robust standard errors. Results are estimated separately for
each of the two groups of states (based on the predefined regimes). The method used allowed for
groupwise heteroskedasticity, estimating separate equations while correlating errors across
equations to enhance efficiency. The results also provided a Chow test of whether the
coefficients were stable across the Regimes.
Using the descriptive statistics for each covariate and the outcome variable, the standard
deviations are used to interpret the quantitative results for the significant regression coefficients.
We answer the question: by how much does flu coverage change (in terms of its own mean and
standard deviation) when the explanatory variable is increased one standard deviation from its
mean? This approach allows the interpretation to bypass the units of measurement, which can
make estimates appear very large or small, and focuses on the quantitative impacts rather than
solely the statistical significance (Kuo & Mobley, 2016).
Spatial Clustering Analysis
It’s hypothesized that flu vaccination coverage among adults is not spatially random
among counties in the U.S. The univariate global Moran’s I test can detect clustering across the
area of interest by comparing the coverage estimate for each county to the mean of the data set.
A Moran’s I value between zero and one indicates clustering somewhere in the areas of interest.
A value between zero and negative one suggests spatial randomness among counties. Prior to
running the test, a spatial weights matrix is generated using queen contiguity to specify the
neighboring structure for each county. The Moran’s I value comparing coverage estimates to the
spatially lagged values was 0.48, indicating the coverage estimates are not spatially random. The
10 The results of the Local Indicators of Spatial Association (LISA) test display only the
‘core’ counties at the center of the statistically significant (α < .05) cluster in the map (Figure 1).
Five hundred sixty five counties were considered ‘High-High’, four hundred sixty three were
‘Low-Low’, and sixty seven had high coverage but were surrounded by counties with low
coverage, designated as ‘High-Low’. Forty counties had low coverage surrounded by counties
with high coverage, designated as ‘Low-High’. The significant Moran’s I also provides a
rational to conduct a spatial regression to assess the variables with the most impact on influenza
coverage.
Regression Analysis
Because it is hypothesized that influenza vaccination coverage does not exhibit a spatially
random pattern among U.S. counties, spatial considerations are needed in regression modeling.
There are possibly two separate spatial processes at work, spatial regimes and spatially correlated
variables and errors across the counties.
A correlation matrix was created using the correlation procedure in SAS to limit
problems associated with multicollinearity among predictor variables. Not all variables initially
selected for the analysis were included in the final model due to the effect of measuring similar
county characteristics. For example, percent of the county population in poverty and median
household income both measure wealth among the county populations, and appear to be highly
correlated with a correlation coefficient of -0.78. This would be an expected outcome as one
would assume that as income increases, the poverty rate decreases. The percent poverty variable
resembled a similar pattern as the LISA results and was chosen for the final model. Because the
flu vaccine should be covered by health insurance for everyone six months and older, and
11 percent of those less than sixty five years without health insurance was also included in the final
model. Using quantile classification, thematic maps were created of all variables and visually
compared to the results of the LISA analysis map. The map displaying urbanicity showed little
similarity to the LISA map, but was included in the model because of prior studies showing
associations between living in an urban area and receiving a flu vaccine (Galarce, et al., 2011).
Per capita health care provider, clinic, and pharmacy were included in the final model as well to
identify associations between flu vaccination coverage and access to care.
Results
To discover the model that best fits the data, one starts with OLS, and uses a series of
diagnostic tests on the residuals to further refine the model. OLS was used to specify the first
model using the spatial weights file created for the cluster analysis to assess spatial effects that
may be left over in the OLS model residuals. Model diagnostics suggested that some
improvements were needed over the OLS model. The multicollinearity condition number (11.9)
is significantly lower than the suggested limit of 50 indicating the explanatory variables are not
correlated with one another, so no problems with multicollinearity are evident with the group of
regressors chosen. The Moran’s I test of spatial dependence in the residuals was significant, as
expected. However, to determine the best alternative model (lag or error), a comparison was
made between the Robust Lagrange Multiplier lag and error tests. Both non-robust tests were
significant, but only the robust lag test was significant, thus the subsequent regression estimated
was the spatial lag model.
The spatial lag model improved fit as evidenced by the reduced log likelihood values
(-9920 compared to -9406). With the exception of per capita clinic and per capita pharmacy, all
12 percent less than sixty five years without health insurance (-0.077) had negative coefficients,
suggesting an inverse relationship to influenza vaccination coverage. The additional lag variable
in the model was highly significant, illustrating the significant spillover effects among adjacent
counties. The Breusch-Pagan test for heteroskedasticity was highly significant, suggesting that
the lag model was not sufficient to explain all of the spatial heterogeneity in the data.
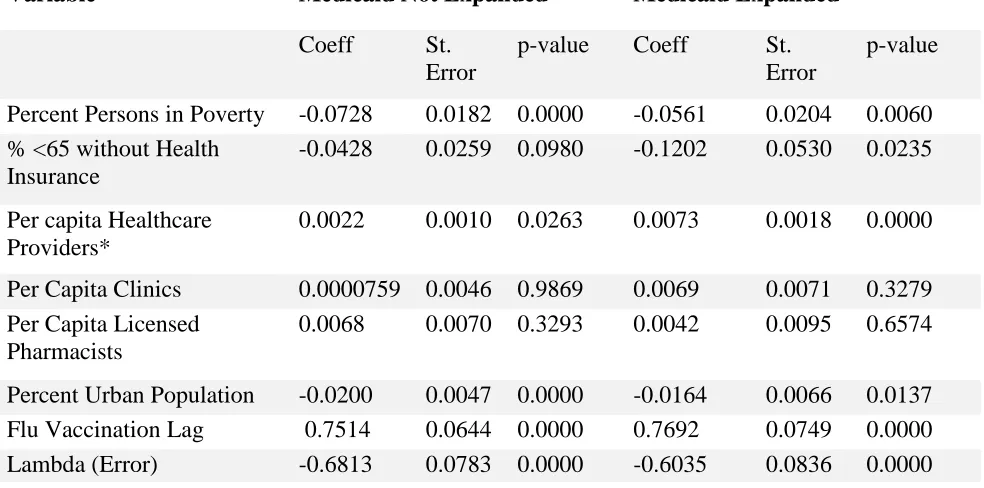
Among counties in states that did not expand Medicaid variables per capita pharmacies,
per capita clinics, and percent less than sixty five years with no health insurance were not
statistically significant. In counties that were part of the Medicaid expansion, only per capita
pharmacies and per capita clinics were not significant. Additionally, results of the Chow test
comparing variables across regimes revealed only per capita healthcare providers was
statistically significantly different between states that expanded Medicaid and those that did not.
Discussion
Figure 2 shows the states that expanded Medicaid. Comparing this to Figure 1, it is
evident that there may be some relationship between Medicaid expansion status and vaccination
coverage. The counties designated ‘High-Low’ and ‘Low-High’ in the spatial clustering analysis
are particularly interesting because they are considered outliers. This designation indicates they
are statistically significantly different from their neighboring counties with regards to flu
vaccination coverage. Further investigation is required to determine which factors would lead a
particular county to have higher or lower vaccination coverage than surrounding areas.
Per capita healthcare provider was statistically significant and positively correlated with
flu vaccination coverage in both regimes, however the regression coefficient was larger in the
expanded Medicaid regime compared to unexpanded. This larger effect suggests that Medicaid
13 vaccinations following the coverage of preventative health services by health insurance plans as
specified by the ACA. Corriero et al. found increases in human papillomavirus (HPV)
vaccination coverage in their examination of The National Health and Nutrition Examination
Survey (NHANES) data pre and post implementation of ACA (2018). Providers may also be
more inclined to recommend the vaccine to patients because of improvements in reimbursement
that accompany expansion of the percentage of populations covered by health insurance (Hurley
et al., 2017). Results of a 2013 survey of providers showed physicians reported not
recommending vaccinations to their adult patients and patients frequently refusing vaccines for
financial reasons (Hurley et al., 2017).
Among states that did not expand Medicaid, the effect of a one standard deviation change
in per capita healthcare providers increased influenza vaccination coverage by about a quarter of
a percent (0.265). States that expanded Medicaid saw an increase of about three quarters of a
percent (0.748) for one standard deviation change in per capita healthcare provider. Quantifying
the magnitude of effects was done only for per capita healthcare provider because of results of
the Chow test showed these effects were significantly different across the Regimes. These
effects are small relative to the standard deviations of influenza vaccination coverage (6.35-did
not expand Medicaid; 6.11-did expand Medicaid). However, it provides further evidence that
increased access to and affordability of the flu vaccine may increase vaccination coverage.
Negative correlation coefficients for percent poverty in both models was an expected
outcome as previous studies have reported lower influenza vaccination coverage among those
living in poverty (Lu, et al.2016; Redelings, et al. 2011). Among states that expanded Medicaid,
the percent less than sixty five years with no health insurance was statistically significant with a
14 insurance, there was a twelve percent decrease in influenza vaccination coverage. There is some
speculation as to what is responsible for this outcome. This uninsured variable is capturing those
in the population that make too much money to qualify for Medicaid (under the new, more
generous rules) but not enough to buy insurance. The Chow test does not find this negative
effect to be significantly different across the regimes. Generally, one would expect a higher
uninsured rate to be associated with a lower vaccination rate. Another postulation would be that
coverage is consistently lower for those less than sixty five years (FluVaxView, 2018) and thus
health insurance status would not affect their decision to be vaccinated. Further investigation is
required to determine possible associations.
Several limitations should be taken into consideration for interpretation of the results.
1) The influenza vaccination coverage estimates from BRFSS were modeled using SAE methods
and might not reflect the true coverage status in a particular county. These estimates have gone
through validity checks but may be problematic where data for independent variables was sparse.
This could also account for the strong need to include both spatial error and spatial lag terms in
the final models. Some of the spatial autocorrelation could have been a result of the estimation
methods used to produce the vaccination coverage variable, which highlights the need for using
correctly specified spatial regression models when analyzing these data. 2) Alaska, Hawaii, and
island counties in Washington and Massachusetts were excluded due to the requirement for
contiguity among polygons to complete the analysis. Counties in these areas are considered
‘spatial islands’ and would therefore not have neighbors. 3) Areas of high or low coverage in the
cluster analysis are in relation to the mean coverage estimate of all counties included in the data
15 department standards. 4) Flu vaccination coverage is based on self-report from survey
respondents and may be subject to recall bias.
The application of spatial analysis to vaccination coverage data is a relatively new
technique. With the availability of vaccination coverage data at higher geographic resolutions
(county, zip code, etc.), investigators can identify pockets of low coverage in need of vaccination
services during an outbreak or an epidemic. These techniques may also provide insight on
identifying disparities that may not be revealed in large surveys. Future research should focus on
local level effects of campaigns to increase coverage. Despite state and national efforts to
increase access by reducing the cost burden of flu vaccination, other factors are equally as
16
Table 1. Sample Statistics for States that did not Expand Medicaid
Variable Mean SD
Economic Conditions
Percent Persons in Poverty 17.5385 6.5644
Health Insurance
% <65 without Health Insurance 16.5525 4.6697
Access to Care
Per Capita Healthcare Providers Per Capita Clinics
Per Capita Licensed Pharmacists
162.3827 18.1491 31.2386
120.2696 24.3520 16.6917
Rural/Urban
Percent Urban Population 39.3341 31.3692
17
Table 2. Sample Statistics for States that did Expand Medicaid
Variable Mean SD
Economic Conditions
Percent Persons in Poverty 15.8126 6.1191
Health Insurance
% <65 without Health Insurance 10.7487 3.4161
Access to Care
Per capita Healthcare Providers Per Capita Clinics
Per Capita Licensed Pharmacists
179.7315 17.0611 29.8400
102.5019 24.0202 14.0473
Rural/Urban
Percent Urban Population 44.8907 31.2227
18
Table 3. Spatial Regime Regression Analysis of Influenza Vaccination Coverage Among Adults in U.S. Counties
Variable Medicaid Not Expanded Medicaid Expanded
Coeff St.
Error
p-value Coeff St.
Error
p-value
Percent Persons in Poverty -0.0728 0.0182 0.0000 -0.0561 0.0204 0.0060
% <65 without Health Insurance
-0.0428 0.0259 0.0980 -0.1202 0.0530 0.0235
Per capita Healthcare Providers*
0.0022 0.0010 0.0263 0.0073 0.0018 0.0000
Per Capita Clinics 0.0000759 0.0046 0.9869 0.0069 0.0071 0.3279
Per Capita Licensed Pharmacists
0.0068 0.0070 0.3293 0.0042 0.0095 0.6574
Percent Urban Population -0.0200 0.0047 0.0000 -0.0164 0.0066 0.0137
Flu Vaccination Lag 0.7514 0.0644 0.0000 0.7692 0.0749 0.0000
Lambda (Error) -0.6813 0.0783 0.0000 -0.6035 0.0836 0.0000
19
20
21
References
ACA. (2018). Medicaid in an Era of Health & Delivery System Reform: Results from a 50-State Medicaid Budget
Survey for State Fiscal Years 2014 and 2015. Retrieved from
https://www.kff.org/medicaid/report/medicaid-in-an-era-of-health-delivery-system-reform-results-from-a-50-state-medicaid-budget-survey-for-state-fiscal-years-2014-and-2015/
Anselin, L. (1995). Local Inidcators of Spatial Association-LISA. Geographical Analysis, 93-115.
BRFSS. (2018). Retrieved from A Methodological Approach to Small Area Estimation for the Behavioral Risk Factor Surveillance System: https://www.cdc.gov/pcd/issues/2016/15_0480.htm
Budd, A., Blanton, L., Kniss, K., Smith, S., Mustaquim, D., Davlin, S., . . . Brammer, L. (2016). Update: Influenza
Activity — United States and Worldwide, May 22–September 10, 2016. Morbidity and Mortality Weekly
Report, 1008-1014.
CDC. (2017). Disease Burden of Influenza. Retrieved from https://www.cdc.gov/flu/about/disease/burden.htm
Corriero, R., Gay, J., Robb, S., & Stowe, E. (2018). Human Papillomavirus Vaccination Uptake before and after the Affordable Care Act: Variation According to Insurance Status, Race, and Education (NHANES 2006-2014).
North American Society for Pediatric and Adolescent Gynecology, 23-27.
Ding, H., Black, C., Ball, S., Fink, R., Williams, W., Fiebelkorn, A., . . . Greby, S. (2017). Influenza Vaccination
Coverage Among Pregnant Women — United States, 2016–17 Influenza Season. Morbidity and Mortality
Weekly Report (MMWR), 1016-1022.
FluVaxView. (n.d.). Flu Vaccination Coverage, United States, 2016-17 Influenza Season. Retrieved from
https://www.cdc.gov/flu/fluvaxview/coverage-1617estimates.htm
Gai, Y., & Feng, L. (2017). Relationship between pharmacist density and adult influenza vaccination after controlling
for individual and neighborhood effects. Journal of the American Pharmacists Association, 474-482.
Gai, Y., & Gu, N. (2014). Relationship between local family physician supply and influenza vaccination after
controlling for individual and neighborhood effects. American Journal of Infection Control.
Galarce, E., Minsky, S., & Viswanath, K. (2011). Socioeconomic status, demographics, beliefs and A(H1N1) vaccine
uptake in the United States. Vaccine, 5284-5289.
Griffith, D. (1987). Spatial Autocorrelation. A Primer. Association of American Geographers.
Grohskopf, L., Sokolow, L., Broder, K., Walter, E., Bresee, J., Fry, A., & Jernigan, D. (2017). Prevention and Control of Seasonal Influenza with Vaccines: Recommendations of the Advisory Committee on
Immunization Practices — United States, 2017–18 Influenza Season. Morbidity and Mortality Weekly
Report (MMWR) , 1-20.
HP2020. (2018). Retrieved from Immunization and Infectious Diseases:
https://www.healthypeople.gov/2020/topics-objectives/topic/immunization-and-infectious-diseases/objectives
HRSA. (2018). Retrieved from HRSA Data Warehouse: https://datawarehouse.hrsa.gov/topics/ahrf.aspx Hurley, L., Lindley, M., Allison, M., Crane, L., Brtnikova, M., Beaty, B., . . . Kempe, A. (2017). Primary care
physicians' perspective on financial issues and adult immunization in the Era of the Affordable Care Act.
Vaccine, 647-654.
Kuo, T.-M., & Mobley, L. (2016). How generalizable are the SEER registries to the cancer populations of the USA?
Cancer, Causes, and Control.
La, E., Trantham, L., Kurosky, S., Odom, D., Aris, E., & Hogea, C. (2017). An analysis of factors associated with influenza, pneumoccocal, Tdap, and herpes zoster vaccine uptake in the US adult population and
corresponding inter-state variability. Human Vaccines & Immunotherapeutics.
Lu, P., O'Halloran, A., Bryan, L., Kennedy, E., Ding, H., Graitcer, S., . . . Singleton, J. (2014). Trends in
racial/ethnic disparities in influenza vaccination coverage among adults during the 2007-08 through 2011-12
seasons. Am J Infect Control, 763-769.
Lu, P., O'Halloran, A., Ding, H., Srivastav, A., & Williams, W. (2016). Uptake of Influenza Vaccination and Missed
Opportunities Among Adults with High-Risk Conditions, United States, 2013. The American Journal of
22 Murphy, P., Sharon, F., Cantlin, J., Cohen, E., Rosan, J., & Harshburger, D. (2012). Pharmacy provision of
influenza vaccinations in medically underserved communities. Journal of the American Pharmacists
Association.
Myers, K. (2016). Predictors of maternal vaccination in the United States: An integrative review of the literature.
Vaccine, 3942-3949.
Omer, S., Enger, K., Moulton, L., Halsey, N., Stokley, S., & Salmon, D. (2008). Geographic Clustering of Nonmedical Exemptions to School Immunization Requirements and Associations With Geographic
Clustering of Pertussis. American Journal of Epidemiology, 1389-1396.
Pierannunzi, C., Xu, F., Wallace, R., Garvin, W., Greenlund, K., Bartoli, W., . . . Town, M. (2016). A Methodological Approach to Small Area Estimation for the Behavioral Risk Factor Surveillance System.
Preventing Chronic Disease.
Quinn, S., Jamison, A., An, J., Freimuth, V., Hancock, G., & Musa, D. (2018). Breaking down the monolith:
Understanding flu vaccine uptake among African Americans. Population Health, 25-36.
Redelings, M., Piron, J., Smith, L., Chan, A., Heinzerling, J., Sanchez, K., . . . Kuo, T. (2012). Knowledge, attitiudes, and beliefs about seasonal influenza and H1N1 vaccinations in a low-income, public health clinic
population. Vaccine, 454-458.
Schieb, L., Mobley, L., George, M., & Casper, M. (2013). Tracking Stroke Hospitalization Clusters Over Time and
Associations With County-Level Socioeconomic and Healthcare Characteristics. Journal of the American
Heart Association, 146-152.
Takayama, M., Wetmore, C., & Mokdad, A. (2012). Characteristics associated with the uptake of influenza
vaccination among adults in the United States. Preventive Medicine, 358-362.
Trogdon, J., & Ahn, T. (2015). Geospatial patterns in human papillomavirus vaccination uptake: Evidence from
unisured and publicly insured children in North Carolina. Cancer Epidemiology, Biomarkers & Prevention,
595-602.
Yeung, M., Lam, F., & Coker, R. (2016). Factors associated with the uptake of seasonal influenza vaccination in