EXPERIMENTAL STUDY THE INFLUENCE OF TEMPERATURE AND
TIME HOLDING PARTITIONING VARIATION ON QUENCHING
PARTITIONING STEEL JIS S45C PROCESS ABOVE THE
MARTENSITE TEMPERATURE START
Wahyu Wijanarko and Muhammad Hafidh
Department of Mechanical Engineering, Faculty of Industrial Technology, Institut Teknologi Sepuluh Nopember (ITS) Arief Rahman Hakim Street, Surabaya, Indonesia
E-Mail: [email protected]
ABSTRACT
Heat treatment is one of the ways to fix the mechanical properties of a material. The principle of heat treatment on steel is the austenite phase’s transformation into another form. Quenching process and partitioning are heat treatment processes to increase the amount of retained austenite in room temperature to obtain steel as a result from strong, hard yet tough heat treatment. In this experimental study, there will be quenching process and partitioning on steel JIS S45C.The heat treatment process for quenching and partitioning are conducted on steel JIS S45C with the heating process until
austenitization temperature which is 900˚C with 4 hours of holding time. The process continued with immersing the
specimen to a salt bath at quenching temperature which is 230˚C for 10 seconds. After quenching, the specimenimmersed
into the salt bath at partitioning temperature varied which are 350˚C, 375˚C, 400˚C, and 425˚C with immersion time also
varied for 10 seconds, 100 seconds and 1000 seconds. The cooling media at partitioning temperature is water. After heat treatment; the specimen will be tested to discover the changes that happen to the mechanical properties and microstructure. Those tests are a tensile test, metallography test, and hardness test. In this experimental study, the result shows that there is an increase in strength, hardness, and toughness in the microstructure of steel JIS S45C which is followed by the ductility reduction on the steel.
Keywords: steel JIS45C, quenching - partitioning, retained austenite phase fraction, mechanical properties.
1. INTRODUCTION
In this sophisticatedera, the need for excellent material and affordable price is increasing rapidly. Various materials with various supremacy were created to fulfill those needs. Every single type of material has its limitation. Usually, the material which has high strength and hardness has low ductility. On the otherhand, material which has high ductility has low strength and hardness.
Many alternative methods couldbe doneto fulfill the needs about the supremacy of materials. One of them is heat treatment process. Heat treatment process is usually performed on steel. Most of the application of this method is applied on steel because it’s relatively not too hard to do and it has a high flexibility level.
Steel is used starting from light load to heavy load tools, such as; turbine’s shaft, sprocket and hydraulic piston use steel as the basic material. Those applications demand high toughness and hardness properties from this type of steel, so there should be heat treatment process to increase the mechanic properties of the steel before it could be used on these tools.
The heat treatment itself consists of several methods such asquenching, martempering, and austempering. Between those methods, quenching is the most frequently used. Then, continued with tempering. The quenching tempering process produces steel which has high strength and hardness level; moreover, it has quite good toughness. Besides, this process relatively has a low level of difficulty.
The quenching partitioning heat treatment is an expansion from quenching tempering heat treatment
process. Both of these processes have similar steps. The difference is spotted on the result of the microstructures. Quenching tempering produces martensite temper phase, while quenching partitioning produces retained austenite and martensite. The difference of the microstructure produces a significant difference on the mechanical properties as well.
2. EXPERIMENTAL ANALYSIS
This experiment was performed on steel JIS S45C with these chemical compositions.
Table-1. Chemical composition steel JIS S45C.
Element C Mn P S Fe
%wt 0.42 0.67 0.018 0.007 98.5
This experimental study is conducted by varying
the partitioning temperature at 350˚C, 375˚C, 400˚C,and
425˚C and each temperature havethreevariationsof holding
Figure-1. Experimental flowchart.
Austenitization temperature of steel JIS S45C is 880˚C [1]. The selection of austenitization temperature at 900˚C is conducted to ensure that the whole existing carbon is dissolved in austenite. Meanwhile, the selection of austenitization holding time for 4 hours is intended to enlarge the grain size of the material so that the curve on TTT diagram slides to the right. Therefore the required CCR (Critical Cooling Rate) to gain martensite phase is getting slower as well.
The quenching process on quenching partitioning is performed at a certain temperature between martensite start (Ms) and martensite finish (Mf). Previously, the Ms temperature of steel S45C must be known with the following equation.
_ °𝐹 = − 𝑥 %𝐶 − 𝑥 % − 3 𝑥 % 𝑖 − 𝑥 %𝐶 − 𝑥 % [2]
From this equation was obtained that the initial formation of martensite for JIS S45C happens at 350˚C. Thistemperature is the basic reason for selecting thevariation of partitioning temperature above the martensite start.
The selection of quenching temperature based on the similar experimental which was done by J. Speers. On Figure-2 shows that maximum austenite fraction for steel with 0.4% carbon was obtained at 230˚C for quenching temperature. This temperature is the basic reason for selecting the quenching temperature at 230˚C.
Figure-2. The prediction of retained austenite fraction after partitioning quenching temperature function for
different carbon content [20].
3. DATA ANALYSIS AND DISCUSSIONS
From tensile testresult on figure3, it is shown that the highest strength for each holding time variation is at 425˚C then descended gradually to 350˚C. Specimen with
temperature variation at 350˚C has the lowest strength of
all three-holding time variation. One of the most interesting things is that the specimen with temperature variation at 375˚C and holding time at 1000 s has very high tensile strength than a specimen with other variations.
Figure-3. Graph of ultimate tensile strength against time and temperature partitioning variation.
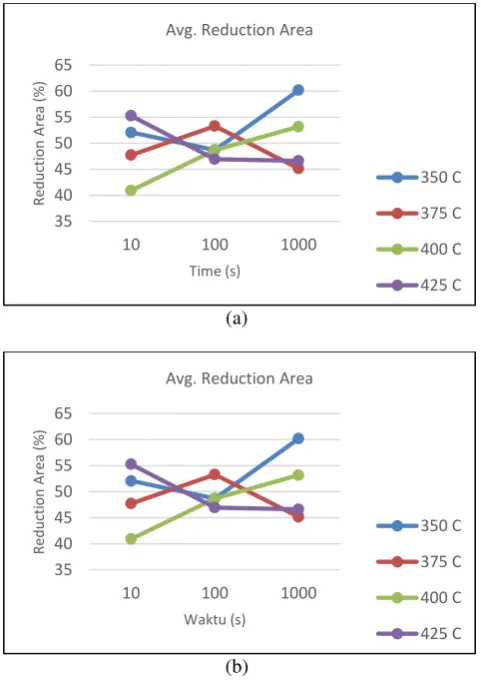
The tensile test also generates toughness value, reduction area, and elongation value. From the tensile test graph Figure-4 (a), it is shown that the reduction area value of all the specimen around 40% - 60%. The highest reduction area value was found on the specimen with
partitioning temperature at 425˚C withholding time for 10
800 850 900 950 1000 1050 1100
10 100 1000
UT
S
(
M
P
a)
Waktu (s)
Temperatur dan Waktu Partitioning VS UTS
350 C
375 C
400 C
From the tensile test graph Figure-4 (b), it is shown that the elongation value of all the specimen around 6%-19%. The highest elongation value was found on the specimen with partitioning temperature 425˚C with holding time for 10 s which is 19.65%. The smallest elongation value was found on the specimen with partitioning temperature at 375˚C with holding time for 1000 s which is 6.19%. This result is in line with a tensile strength which the material with variation as mentioned has the highest tensile strength.
The toughness calculation was obtained with trapezium area method using the stress-strain graph. In this case, the strain value is the height of the trapezium, and the stress value is the parallel side of the trapezium, so it was obtained a data as shown in Figure-4 (c). From this tensile test graph, it is shown that the toughness value of all the specimen between 115 J/mm3- 193 J/mm3. In broad outline, it is shown that the highest average value of toughness was obtained from holding time variation for 100 seconds. The highest value of toughness is on the
specimen with partitioning temperature at 375˚C with
holding time for 100 s which is 193.14 J/mm3. The smallest value of toughness is on the specimenwith partitioning temperature at 375˚C with holding time for 10 s which is 115.14 J/mm3.
(a)
(b)
(c)
Figure-4. (a) Graph of Reduction Area against time and partitioning temperature variation (b) Graph of Elongation
against time and partitioning temperature variation (c) Graph of Toughness against time and partitioning
temperature variation.
From the graph of hardness on Figure-5, it is shown that the highest hardness value is on the specimen
with partitioning temperature at 350˚C with holding time
[image:3.595.309.548.95.246.2]for 100 s which is 47 HRC. The smallest hardness value is on the specimen with partitioning temperature at 350˚C with holding time for 10 s and 375˚C and holding time for 10 s which is 30.5 HRC. The hardness value around 30-47 HRC.
Figure-5. Graph of hardness value against temperature and partitioning time.
In Figure-6 it is shown that the higher partitioning temperature, the white region of thefraction. Based on Atlas Microstructure of Industrial Alloys [4] this region is called ferrite. Ferrite fraction is quite a lot because of the duration of partitioning time that was given; therefore martensite on the carbon was diffusing out and changing the crystal structure of the martensite from BCT to BCC. So theoretically, martensite will be seen as ferrite. This kind of thing that caused the increase of white region fraction in microstructure.
35 40 45 50 55 60 65
10 100 1000
R e du ct io n A re a (%) Time (s)
Avg. Reduction Area
350 C 375 C 400 C 425 C 35 40 45 50 55 60 65
10 100 1000
R e du ct io n A re a (%) Waktu (s)
Avg. Reduction Area
350 C 375 C 400 C 425 C 100 120 140 160 180 200
10 100 1000
T o ug hnes s 𝒙 ^( − 𝟑 ) 𝑱 / 𝒎 𝒎 ^ 𝟑 ) Waktu (s) Avg. Toughness 350 375 400 425 30 35 40 45 50
10 100 1000
Ke
keras
an
(HRC)
[image:3.595.50.291.392.733.2]Waktu (s)
Tabel Kekerasan vs Temperatur vs Waktu Partitioning
350 C
375 C
400 C
[image:3.595.308.552.427.580.2](a)
(b)
(c)
(d)
Figure-6. The microstructure of steel JIS S45C after quenching partitioning heat treatment at 230˚C quenching
temperature and partitioning temperature (a) 350 ˚C (b)
375 ˚C (c) 400 ˚C (d) 425 ˚C with holding time for 10 s.
Partitioning holding time affects the microstructure of the material as well. In partitioning temperature case above martensite start, the longer holding time not only affects the amount of the carbon that diffused out of the martensite, but also it affects the forming of bainite. Because of temperature above
This phenomenon caused tensile strength and material hardness with holding time for 100 seconds is better than material with 10 seconds and 1000 seconds. Specimen with holding time for 10 seconds can’t form bainite because of the given time is not enough to form bainite. While the specimen with holding time for 1000 seconds also form bainite. But the holding time is too long, so the carbon that comes out of the martensite is multiplied so that it contributes to reduced hardness and strength of the specimen.
From Figure-7, it is shown that the longer of the holding time for partitioning, the ferrite fraction (white region) will multiply, this is caused by the addition of partitioning duration will give time for carbon in martensite to diffuse out and form carbide. The martensite has lost of the carbon plenty enough to change the structure from BCT to BCC which is identic to the ferrite. Therefore, this explanation elaborates the increase of ferrite fraction in themicrostructure.
(a)
(b)
(c)
4. STATISTICAL TEST
The statistical test in this experimental study is a Two Way ANOVA factorial test to see whether the time and temperature changing affects the value of UTS, elongation, reduction area, and hardness.
In this test, Time and temperature are variables while UTS value, elongation and reduction area are responses. Two Way ANOVA factorial test was conducted to obtain p-value from some data. Then this p-value will be compared to α value to obtain statistic hypothesis from
the data. The α value was obtained from a confidence
level. The confidence level that is used in this test is 95%.
So, the value of α = 100% - 95% = 5% (0.05). If the value
of p > α, the initial hypothesis (H0) will be accepted. On
the contrary, if p < α, the initial hypothesis (H0) will be
rejected.
There isthree hypotheses in this statistical test. The hypotheses are the hypothesis of temperature changes to see the effect of partitioning temperature changing against the data, the hypothesis of time changing to see the effect of partitioning time changing against the data and hypothesis of time and temperature interactionto see the effect of time and temperature of partitioning interaction against the data. For every hypothesis, H0 states that “there
is no effect of temperature/time/time and temperature interaction against the data” while H1 states that “at least
there is a couple of temperature/time/time and temperature interaction affects the data.” These tables below are the test results of Two Way ANOVA for each group of the data. P-value is on the “Sig.” column on the table.
The statistical test result shows that there is no specific effect between time and temperature changes against strength, toughness, and elongation. For the calculation statistic software result, it is shown in the attachment labeled with a red circle.
5. CONCLUSIONS
It can be concludedfrom the statistic test Two Way ANOVA result that holding time and partitioning temperature with variations above martensite start has no specific effect against the mechanical properties on steel JIS S45C; it can be seen from the data pattern doesn’t have a certain pattern (up or down). Nevertheless, it can be seen that the best mechanical properties were obtained on the specimenwith holding time for 100 seconds of all tests. It is expected that this data can be used as a benchmark for a further experimental study about quenching partitioning.
For the next experimental study, it is suggested to use a material with slower CCR, for example, AISI 4140 or AISI 4340. Therefore there will be plenty of martensites that can be produced in quenching process. It is also suggested for the next experimental study to perform XRD test and microhardness as austenite presence validation on steel microstructure.
6. ATTACHMENT
REFERENCES
[1] ASM. 1991. Atlas of Time-Temperature Diagrams for Irons and Steels.ASM International.
[2] S. H. Avner. 1974. Introduction to Physical Metallurgy, 2nded. McGraw Hill. J.
[3] J.G. Speer, D.K. Matlock, B.C. De Cooman, J.G. Schroth. 2005. The “Quenching and Partitioning” Process: Background and Recent Progress. 8(4): 417-423.
[4] ASM Metal Handbook vol.7. 1972. Atlas Microstructures of Industrial Alloys. ASM International.
[5] Thelning K.E. 1984. Steel and Its Heat Treatment, 2nded.Butterworths, London.
[6] J. Speer, et al. 2003. Carbon Partitioning into
Austenite after Martensite Transformation. ActaMaterialia. 51: 2611-2622.
[7] J.G. Speer, et al. 2003. Austenite Formation and
[8] W. F. Smith. 1993. Structure and Properties of Engineering Alloys, 2nded. McGraw Hill.
[9] F. L. H. Gendermann. 2004. Microstructure and Hardness of 9260 Steel Heat-Treated by Quenching and Partitioning Process. Diploma, Aachen University of Technology, Germany.
[10]ASM. 1995. Heat Treater’s Guide. ASM International.
[11]ASM. 1995. Heat Treater’s Guide. ASM International.
[12]Ir. Wahid Suherman. Pengetahuan Bahan. Surabaya.
[13]ASM Handbook vol.1. 1990. Irons, Steels, and High Performance Alloys. ASM, Ohio.
[14]William D. Callister, Jr. 2007. Material Science and Engineering. 7th ed.: John Wiley & Sons, Inc., United States of America.
[15]H. Yu, S.G. Mhaisalkar. 2006. Time - Temperature Transformation (TTT) Cure Diagram of a Fast Cure Non-Conductive Adhesive, Thin Solid Films. 504: 331-335.
[16]George Krauss. 1999. Martensite in Steel: Strength and Structure. Material Science and Engineering. A273-275, 40-57.
[17]J. Speer, et al. 2003. Carbon Partitioning into
Austenite after Martensite Transformation. ActaMaterialia. 51: 2611-2622.
[18]J.G. Speer, D.K. Matlock, B.C. De Cooman, J.G. Schroth. 2005. The Quenching and Partitioning Process: Background and Recent Progress. 8(4): 417-423.
[19]J.G. Speer, et al. 2003. Austenite Formation and
Decomposition. in TMS/ISS, Warrendale, PA, USA. pp. 505-522.
[20]D. V. Edmons, et al. 2006. Quenching and