Application of Taguchi Technique to Optimize Tribological Behaviour of
Al6061T6/SiC/Al
2O
3Metal Matrix Composite
Vinod Kumar*, Ashok Kr. Mishra**, Dr. B.K.Roy***
*M.Tech Student Om Institute of Technology & Management Juglan, Hisar(Haryana) ** Astt. Prof. in BRCM College of engineering & Technology Behal, Bhiwani(Haryana)
*** Director-Principal, Om Institute of Technology & Management Juglan, Hisar(Haryana)
ABSTRACT- Tribological behaviour of aluminium alloy Al6061T6 reinforced with silicon carbide and alumina oxide particles (10%weight percentage of SiC and Al2O3 particles) fabricated by stir casting process
was investigated. The wear and frictional properties of the metal matrix composites was studied by performing dry sliding wear test using a computerized pin-on-disc wear tester. Experiments were conducted based on the plan of experiments generated through Taguchi’s technique. A L27 Orthogonal array was selected for analysis of
the data. Investigation is to find the influence of applied load, sliding speed and sliding distance on wear rate, as well as the coefficient of friction during wearing process was carried out using ANOVA and regression equations for each response were developed for 10% SiC and Al2O3 reinforced Al-6061 T6 MMC’s. Objective
of the model was chosen as “smaller the better” characteristics to analyse the dry sliding wear behaviour. Results show that sliding distance has the highest influence followed by applied load and sliding speed. Among interaction terms, Load*speed and Load*distance was found most affecting term the wear rate and coefficient of friction respectively.
Keywords: Metal Matrix Composites, Stir casting, Taguchi’s techniques, orthogonal array,
Analysis of variance, wear behaviour, Pin-on-disc machine.
I. INTRODUCTION
General Engineering materials have limitations in achieving optimum levels of strength, stiffness, density, toughness and wear resistance. To overcome these shortcomings, discontinuously reinforced aluminium metal matrix composites (DRAMMCs) are gaining importance due to their high specific strength, high stiffness, low density and good wear resistance and they have the potential to replace their monolithic counterparts primarily in automotive, aerospace and energy applications [1]. Fabrication of MMCs has several challenges like porosity formation, poor wettability and improper distribution of reinforcement. Achieving uniform distribution of reinforcement is the foremost important work. A new technique of fabricating cast Aluminium matrix composite has been proposed to improve the wettability between alloy and reinforcement. In this, all the materials are placed in graphite crucible and heated in an inert atmosphere until the matrix alloy is melted and followed by two step stirring action to obtain uniform distribution of reinforcement. The fabrication techniques of MMCs play a major role in the improvement of mechanical and tribological properties. The performance characteristics of Al alloy reinforced with 5% volume fraction of SiC fabricated through stir casting and found that the stir casting specimen have higher strength compared to powder metallurgy specimen. The size and type of reinforcement also has a significant role in determining the mechanical and tribological properties of the composites. The effect of type of reinforcements such as SiC whisker, alumina fiber and SiC particle fabricated by Powder Metallurgy on the properties of MMCs has been investigated. It was found that there existed a strong dependence on the kind of reinforcement and its volume fraction. The results revealed that particulate reinforcement is most beneficial for improving the wear resistance of MMCs. [2]
Wear is an important property in the selection of DRAMMCs. Wear is not an intrinsic material property but characteristics of the engineering system which depend on load, speed, temperature, hardness, and the environmental conditions. Wear performances of particulate reinforced aluminium matrix composites reinforced with various reinforcements ranging from very hard ceramic particulates such as SiC and Al2O3 have been
The Taguchi approach to experimentation provides an orderly way to collect, analyze and interpret data to satisfy the objectives of the study. Essentially, traditional experimental design procedures are too complicated and not easy to use. A large number of experimental works have to be carried out when the number of process parameters increases. To solve this problem, the Taguchi method uses a special design of orthogonal arrays to study the entire parameter space with only a small number of experiments. The greatest advantage of this method is the saving of effort in conducting experiments; saving experimental time, reducing the cost, and discovering significant factors quickly. Taguchi’s robust design method is a powerful tool for the design of a high-quality system. In addition to the S/N ratio, a statistical analysis of variance (ANOVA) can be employed to indicate the impact of process parameters on metal removal rate values [4]. A plan order for performing the experiments was generated by Taguchi method using orthogonal arrays. This method yields the rank of various parameters with the level of significance of influence of a factor or the interaction of factors on a particular output response [5]. The major aim of the present investigation is to analyse the influence of parameters like load, sliding speed and fly ash content on dry sliding wear of aluminium/SiC/Al2O3 hybrid metal matrix
composites using Taguchi technique. A multiple linear regression model is developed to predict the wear rate of the hybrid composites.
III. MATERIAL SELECTION
In the present investigation, Al6061 T6 alloy was chosen as the base matrix since its properties can be tailored through heat treatment process. The reinforcement was sic and Al2O3 average size of 400 µm, and there are
sufficient literatures elucidating the improvement in wear properties through the addition of SiC and Al2O3.
Addition of Silicon carbide and alumina oxide into aluminium base matrix, results into improved wear resistance, high strength, low density, low coefficient of thermal expansion and high thermal conductivity of metal matrix composite.
Table 1- Chemical Composition of Al6061T6 alloy
Element Si
Fe
Mn
Mg
Cu
Zn
Ti
Cr
Al
Wt%
0.76
0.14
0.29
0.84
0.33
0.004
0.02
0.006
97.61
Composite Preparation
Wear Behaviour
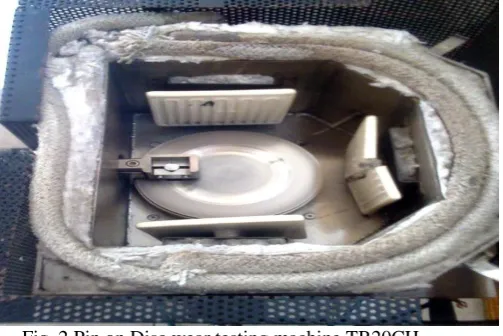
The aim of the experimental plan is to find the important factors and combination of factors influencing the wear process to achieve the minimum wear rate and coefficient of friction. The experiments were developed based on an orthogonal array, with the aim of relating the influence of sliding speed, applied load and sliding distance. These design parameters are distinct and intrinsic feature of the process that influence and determine the composite performance. Taguchi recommends analysing the S/N ratio using conceptual approach that involves graphing the effects and visually identifying the significant factors. The above mentioned pin on disc test apparatus was used to determine the sliding wear characteristics of the composite. Specimens of size 12 mm diameter and 30 mm length were cut from the cast samples, and then machined. The contact surface of the cast sample (pin) was made flat so that it should be in contact with the rotating disk. During the test, the pin was held pressed against a rotating EN31 carbon steel disc (hardness of 65HRC) by applying load that acts as counterweight and balances the pin. The track diameter was taken 100mm for each batch of experiments and the parameters such as the load, sliding speed and sliding distance were varied in the range given in Table 2. A LVDT (load cell) on the lever arm helps determine the wear at any point of time by monitoring the movement of the arm. Once the surface in contact wears out, the load pushes the arm to remain in contact with the disc. This movement of the arm generates a signal which is used to determine the maximum wear and the coefficient of friction is monitored continuously as wear occurs and graphs between co-efficient of friction and time was monitored for both of the specimens i.e., Al6061T6/SiC/Al2O3 MMC’s. Further, weight loss of each specimen
was obtained by weighing the specimen before and after the experiment by a single pan electronic weighing machine with an accuracy of 0.0001g after thorough cleaning with acetone solution. The difference between the initial and final mass of the pin gave the mass loss due to sliding wear. The volume loss due to wear was calculated by the use of corresponding density values of the pin. The wear rate of the composite pins was then calculated (ratio of volume loss to sliding distance).The results for various combinations of parameters were obtained by conducting the experiment as per the Orthogonal array and show the Table 3. The measured results were analysed using the commercial software MINITAB 15 specifically used for design of experiment applications.
Fig. 2Pin on Disc wear testing machine TR20CH
IV. PLAN OF EXPERIMENTS
[image:3.595.169.421.394.562.2]In this investigation, an L27 OA which has 27 rows corresponding to the number of tests and 26 degrees of
freedom (DOFs) with 13 columns at three levels is chosen. To check the DOFs in the experimental design, for the three level test, the three main factors take 8 [3 × (3 − 1)] DOFs. The DOF for three second-order interactions (L × S, L × T, S × T) is 12 [3 × (3 − 1) × (3 − 1)] and the total DOFs required is 18. As per the Taguchi method, the total DOFs of selected OA must be greater than or equal to the total DOFs required for the experiment and hence the L27 OA has been selected. As per the requirements of the L27 OA, the 1st column is
assigned to applied load (L), the 2nd column is assigned to sliding speed (S), the 5th column is assigned to sliding distance (D) and six columns are assigned to the two-way interactions of the first three factors while the remaining three columns are for error terms. In this study, “smaller the better‟ characteristic was chosen to analyse the dry sliding wear resistance. The S/N ratio for wear rate and coefficient of friction using “smaller the
better” characteristic given by Taguchi, is as follows:
S/N (η)
∑
[image:4.595.148.450.83.189.2]
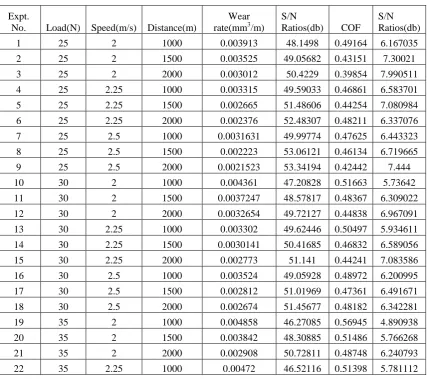
Where y1, y2...yi are the response of friction and sliding wear; and n is the number of observations. Table 3-Result of L27 orthogonal array
Expt.
No. Load(N) Speed(m/s) Distance(m)
Wear rate(mm3/m)
S/N
Ratios(db) COF S/N Ratios(db)
1 25 2 1000 0.003913 48.1498 0.49164 6.167035
2 25 2 1500 0.003525 49.05682 0.43151 7.30021
3 25 2 2000 0.003012 50.4229 0.39854 7.990511
4 25 2.25 1000 0.003315 49.59033 0.46861 6.583701 5 25 2.25 1500 0.002665 51.48606 0.44254 7.080984 6 25 2.25 2000 0.002376 52.48307 0.48211 6.337076 7 25 2.5 1000 0.0031631 49.99774 0.47625 6.443323 8 25 2.5 1500 0.002223 53.06121 0.46134 6.719665 9 25 2.5 2000 0.0021523 53.34194 0.42442 7.444 10 30 2 1000 0.004361 47.20828 0.51663 5.73642 11 30 2 1500 0.0037247 48.57817 0.48367 6.309022 12 30 2 2000 0.0032654 49.72127 0.44838 6.967091 13 30 2.25 1000 0.003302 49.62446 0.50497 5.934611 14 30 2.25 1500 0.0030141 50.41685 0.46832 6.589056 15 30 2.25 2000 0.002773 51.141 0.44241 7.083586 16 30 2.5 1000 0.003524 49.05928 0.48972 6.200995 17 30 2.5 1500 0.002812 51.01969 0.47361 6.491671 18 30 2.5 2000 0.002674 51.45677 0.48182 6.342281 19 35 2 1000 0.004858 46.27085 0.56945 4.890938
Controllable
Factors
Load(L)
(N)
Sliding
Speed(S)
(m/s)
Sliding
Distance
(D)(m)
Level 1
24.525
2
1000
Level 2
29.43
2.25
1500
[image:4.595.75.503.390.769.2]23 35 2.25 1500 0.003585 48.91022 0.48893 6.214992 24 35 2.25 2000 0.002779 51.12223 0.46931 6.570861 25 35 2.5 1000 0.0046823 46.59082 0.4842 6.299504 26 35 2.5 1500 0.003827 48.34283 0.46245 6.698648 27 35 2.5 2000 0.003182 49.946 0.43901 7.150551
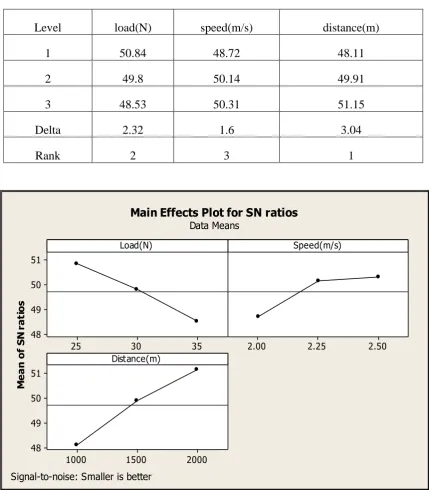
Table 4- Response Table for Signal to Noise ratios- Smaller is better (Wear rate)
Level
load(N)
speed(m/s)
distance(m)
1
50.84
48.72
48.11
2
49.8
50.14
49.91
3
48.53
50.31
51.15
Delta
2.32
1.6
3.04
Rank
2
3
1
Fig. 3- Main Effects Plot for Signal to Noise ratios- Smaller is better (Wear rate) 35
30 25
51
50
49
48
2.50 2.25
2.00
2000 1500
1000 51
50
49
48
Load(N)
M
e
a
n
o
f
S
N
r
a
ti
o
s
Speed(m/s)
Distance(m)
Main Effects Plot for SN ratios
Data Means
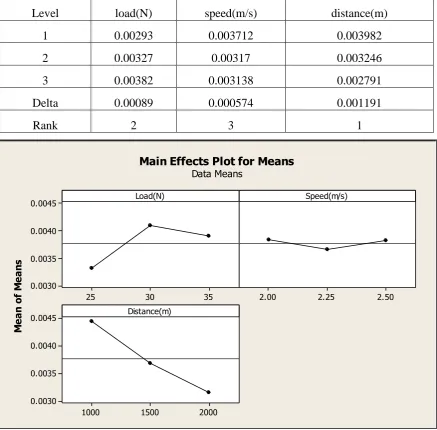
Table 5-Response Table for Means- Smaller is better Wear rate
Level
load(N)
speed(m/s)
distance(m)
1
0.00293
0.003712
0.003982
2
0.00327
0.00317
0.003246
3
0.00382
0.003138
0.002791
Delta
0.00089
0.000574
0.001191
Rank
2
3
1
Fig. 3- Main Effects Plot for Means- Smaller is better (Wear rate)
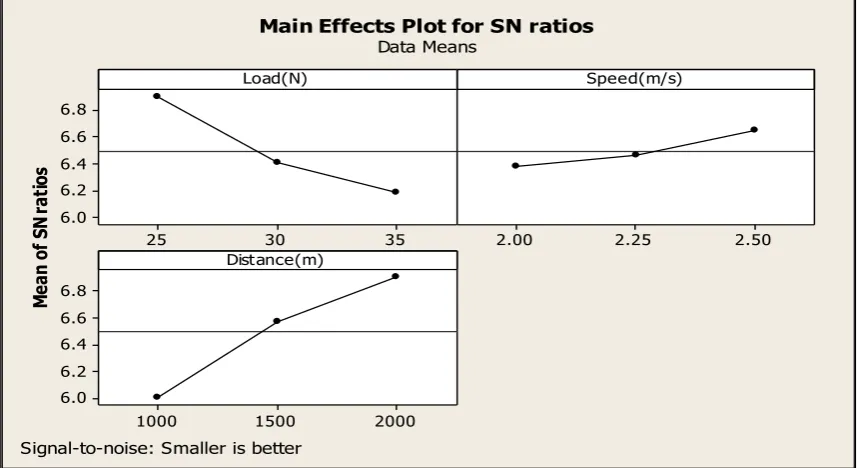
Table 6- Response Table for Signal to Noise ratios- Smaller is better (Coefficient of friction)
Level
load(N)
speed(m/s)
distance(m)
1
6.896
6.374
6.004
2
6.406
6.464
6.575
3
6.179
6.643
6.903
Delta
0.717
0.269
0.899
Rank
2
3
1
35 30
25 0.0045
0.0040
0.0035
0.0030
2.50 2.25
2.00
2000 1500
1000 0.0045
0.0040
0.0035
0.0030
Load(N)
M
e
an
o
f
M
e
an
s
Speed(m/s)
Distance(m)
Main Effects Plot for Means
[image:6.595.70.505.584.722.2][image:7.595.66.509.347.744.2]
Fig. 3- Main Effects Plot for Signal to Noise ratios- Smaller is better (Coefficient of friction) Table 7- Response Table for Means- Smaller is better (Coefficient of friction)
Level
load(N)
speed(m/s)
distance(m)
1
0.453
0.4825
0.5017
2
0.4788
0.4757
0.4697
3
0.4922
0.4659
0.4526
Delta
0.0392
0.0166
0.0491
Rank
2
3
1
Fig. 4- Main Effects Plot for Means- Smaller is better (Coefficient of friction) 35
30 25
6.8 6.6 6.4 6.2 6.0
2.50 2.25
2.00
2000 1500
1000 6.8
6.6 6.4 6.2 6.0
Load(N)
M
ea
n
of
S
N
ra
tio
s
Speed(m/s)
Distance(m)
Main Effects Plot for SN ratios Data Means
Signal-to-noise: Smaller is better
35 30
25 0.495
0.480
0.465
0.450
2.50 2.25
2.00
2000 1500
1000 0.495
0.480
0.465
0.450
Load(N)
M
ea
n
of
M
ea
ns
Speed(m/s)
Distance(m)
Table8 Analysis of Variance
for Signal to Noise ratios- Smaller is better (Wear rate)
Source
DF
Seq. SS
Adj. SS
Adj. MS
F
P
%
Load(N)
2
24.2318 24.2318
12.1159
67.35
0
25.973
Speed(m/s)
2
13.851
13.851
6.9255
38.5
0
14.846
Distance(m)
2
42.0188 42.0188
21.0094
116.79
0
45.038
Load(N)*speed(m/s)
4
7.6352
7.6352
1.9088
10.61
0.003 8.1839
Load(N)*distance(m)
4
3.379
3.379
0.8448
4.7
0.03
3.6218
Speed(m/s)*distance(m)
4
0.7406
0.7406
0.1851
1.03
0.448 0.7938
Residual Error
8
1.4391
1.4391
0.1799
1.5425
Total
26
93.2954
Table9Analysis of Variance for Signal to Noise ratios- Smaller is better (coefficient of friction)
Source
DF
Seq. SS
Adj. SS
Adj. MS
F
P
%
Load(N)
2
2.4174
2.4174
1.20868
9.43
0.008 23.561
Speed(m/s)
2
0.338
0.338
0.16902
1.32
0.32
3.2943
Distance(m)
2
3.7229
3.7229
1.8617
14.52
0.002 36.285
Load(N)*speed(m/s)
4
1.856
1.856
0.46399
3.62
0.057 18.089
Load(N)*distance(m)
4
0.0439
0.0439
0.01096
0.09
0.985 0.4279
Speed(m/s)*distance(m)
4
0.8025
0.8025
0.20062
1.56
0.273 7.8214
Residual Error
8
1.0256
1.0256
0.1282
9.9958
Total
26
10.2603
ANOVA was used to determine the design parameters significantly influencing the wear rate and coefficient of friction (response). Table8 and Table9 shows the results of ANOVA for wear rate and COF. This analysis was evaluated for a confidence level of 95%, that is for significance level of α=0.05. The last column of Table8 and table9 shows the percentage of contribution (P %) of each parameter on the response, indicating the degree of influence on the result. It can be observed from the result that D was the most significant parameter having the highest statistical influence (45.03%) on the dry sliding wear of composites followed by L (26.0%) and S (15%).When the P-value for this model was less than 0.05, then the parameter or interaction can be considered as statistically significant. This is desirable as it demonstrates that the parameter or interaction in the model has a significant effect on the response. From an analysis of the results obtained in Table 5, it is observed that the interaction effect L*S (8.78%) is significant model terms influencing wear rate of composites. Coefficient of friction was highly influenced by D (36.3%), L (23.5%) and S (3.3%) respectively and interaction term L*D [18.0%] was found most influencing term among different interaction parameters. Thus it is confirmed that this model provides reasonably good explanation of the relationship between the independent factors and the response because lower value of residual error can be easily neglected.
Multiple Linear Regression Model Analysis
A multiple linear regression analysis attempts to model the relationship between two or more predictor variables and a response variable by fitting a linear equation to the observed data. Based on the experimental results, a multiple linear regression model was developed using MINITAB 15. A regression equation thus generated establishes correlation between the significant terms obtained from ANOVA, namely, load, sliding speed, sliding distance and their interactions.
The regression equation developed for wear rate is:
The above equation can be used to predict the wear rate of the hybrid composites. The constant in the equation is the residue. The regression coefficient obtained for the model was 0.964 and this indicates that wear data was not scattered. From the above regression equations for wear rate and coefficient of friction, we found that wear rate of composite is directly proportional to L and inversely proportional to S and D and Coefficient of friction is directly proportional to L and inversely proportional to S and D. The coefficient of friction and wear rate associated with L in the regression equations is positive and it indicates that as the value of L increases, wear rate of the composite also increases.
V. Conclusions
1) Wear rate (Al6061T6/10%Sic/10% Al2O3 MMC) was highly influenced by sliding distance, applied
load and sliding speed respectively and interaction term L*S (Load*Speed) [8%] was found most predominant among different interaction parameters.
2) Coefficient of friction(Al6061T6/10%Sic/10% Al2O3 MMC) was highly influenced by sliding distance,
applied load and sliding speed respectively and interaction term L*D (Load*Distance) [18%] was found most influencing term among different interaction parameters.
3) From the regression equations for wear rate and coefficient of friction(Al6061T6/10%Sic/10% Al2O3
MMC), we found that wear rate and coefficient of friction of composite is directly proportional to applied load and inversely proportional to speed and distance and sliding speed.
References
1. Anandha Moorthy, Dr. N. Natarajan, R. Sivakumar,M. Manojkumar, M. Suresh ”Dry Sliding Wear and Mechanical Behavior of Aluminium/Fly ash/Graphite Hybrid Metal Matrix Composite Using Taguchi Method” International Journal of Modern Engineering Research (IJMER), Vol.2, Issue.3, pp-1224-1230 ISSN: 2249-6645, May-June 2012
2. Ashok Kr. Mishra, Rakesh Sheokand, Dr. R K Srivastava ”Tribological Behaviour of Al-6061 / SiC Metal Matrix Composite by Taguchi’s Techniques” International Journal of Scientific and Research Publications, Volume 2, Issue 10, ISSN 2250-3153, October 2012
3. S. Venkat Prasat, R. Subramanian “Influence of Parameters on the Dry Sliding Wear Behaviour of Aluminium/Fly ash/Graphite Hybrid Metal Matrix Composites” European Journal of Scientific Research Vol.53 No.2, pp.280-290 , ISSN 1450-216X , 2011
4. Rao R.N. and Das S. “Effect of SiC content and sliding speed on the wear behaviour of aluminium matrix composites”, International Journal of Materials and Design, Vol. 32, pp. 1066-1071, 2011
5. Mr.S.Balu Mahandiran, Dr.M.Nataraj “DRY SLIDING WEAR BEHAVIOR OF Al – SiC COMPOSITES USING DESIGN OF EXPERIMENTS” Proceedings of the National Conference on Manufacturing Innovation Strategies & Appealing Advancements MISAA2013 April 19, 2013, PSG College of Technology, Coimbatore, India 6. Umanath K, Selvamani S T “Friction And Wear Behaviour of Al6061alloy (Sicp +Al2o3p) Hybrid Composites”
International Journal Of Engineering Science And Technology (Ijest)
7. V. C. Uvaraja, N. Natarajan “ Optimization of Friction and Wear Behaviour in Hybrid Metal Matrix Composites Using Taguchi Technique” Journal of Minerals and Materials Characterization and Engineering, 2012, 11, 757-768 doi:10.4236/jmmce.2012.118064 Published Online August 2012
8. R. Subramanian, S. Venkat Prasat “Tribological Behaviour of Aluminium/Alumina/Graphite Hybrid Metal Matrix Composite Using Taguchi’s Techniques” Journal of Minerals & Materials Characterization & Engineering, Vol. 10, No.5, pp.427-443, 2011
9. N. Radhika, R. Subramanian, S. Venkat Prasat “Tribological Behaviour of Aluminium/Alumina/Graphite Hybrid Metal Matrix Composite Using Taguchi’s Techniques” Journal of Minerals & Materials Characterization & Engineering, Vol. 10, No.5, pp.427-4
10. Harish K.Garg, Ketan Verma, Alakesh Manna, Rajesh Kumar ” Hybrid Metal Matrix Composites and further improvement in their machinability” International Journal of Latest Research in Science and Technology ISSN(Online):2278-5299Vol.1,Issue1:36-44,May-June(2012)
11. S. Suresha, B.K. Sridhara (2012) "Friction characteristics of aluminium silicon carbide graphite hybrid composites Materials and Design 576–583, 2012
12. Kok M. and Ozdin K. “Wear resistance of aluminium alloy and its composites reinforced by Al2O3 particles”, Journal of Material Processing Technology, Vol. 183, pp. 301-309, 2007
13. Vikas Sahu, Hitesh Dhanda and Nitin Panwar ”Al-Sic Metal Matrix Composite Formation By Varying The Percentage Of Sic Using Stir Casting Technique” Dronacharya Research Journal Vol. V –Issue-I 68ISSN: 0975-3389, Jan – June. 2013