EXPERIMENTAL STUDY OF LOAD BALANCING ON SOFTWARE
DEFINED NETWORK USING ANT-COLONY OPTIMIZATION
Faizal Mulya, Tito Waluyo Purboyo and Roswan Latuconsina
Department of Computer Engineering, Faculty of Electrical Engineering, Telkom University, Bandung, Indonesia E-Mail: [email protected]
ABSTRACT
The development of technology on internet networks is rapidly continues to grow. This development also had an impact on the server because the server had difficulty in distributing request. To meet internet needs, the technique that can be used is load balancing. Load balancing is a technique to use two or more internet connection lines and balance the request between the two internet connection lines. In this research, the main problem to be discussed is a load balancing simulation using ant colony optimization mechanism. Our experiment show that throughput value by using the ant colony optimization algorithm has a greater throughput value than the round-robin algorithm. Also, we found that ant colony optimization algorithm is more balanced because it has a difference CPU utilization lower than Round-Robin.
Keywords: experimental, load balancing, software defined network, ant-colony optimization.
INTRODUCTION
Nowadays, network technologies make human needs can be easily in order to the construction, monitoring or maintaining computer networks. Over time and the rapid development of network technology that gave rise to a new concept in network technology, it is named Software Defined Network (SDN).The ability of an SDN network can also be used to change network behavior and can make these changes automatically, and can maximize the use of network devices such as load balancing. The existence of this SDN concept can help determine routing using the path determination algorithm [12]. Then from that, to help ease the burden, load balancing is needed which can be maximized by the SDN network. Load balancing is also a mechanism for dividing computational load on several servers. This research is done to increase the throughput and evenly the CPU utilization using an ant colony optimization algorithm because with this algorithm a computer network will maximize the throughput and evenly the CPU utilization because basically this algorithm selects the shortest path.
THEORETICAL BASIS
In this research load balancing will be designed on the Software Defined Network (SDN) network using an ant colony optimization algorithm, and using POX controller on the SDN network.
A. Software defined network
Software Defined Network (SDN) is a term that refers to a new concept in designing, managing and implementing networks, especially to support the needs and innovations of this network which are increasingly widespread [10]. The ability possessed by SDN networks can also be used to change network behavior and can make these changes automatically, and can maximize the use of network devices such as load balancing. The existence of this SDN concept can help determine to route using the path determination algorithm [5].
Figure-1. SDN Architecture [5].
Figure-1 shows the SDN architecture with the following explanation:
a) Application Plane is the topmost layer is an application that can directly and explicitly define network requirements and desired network behaviour [5].
b) Controller Plane is to neutralize the needs of various applications with infrastructure by providing instructions that are in accordance with SDN Data Path and provide relevant information and the required application of SDN [5].
c) Data Plane, consisting of network elements that can receive instructions from the Control Layer. Interfaces between Controller Plane and Data Plane are called South Band Interface (SBI), or Control-To-Data-Plane Interface (CDPI) [5].
B. Load balancing
manner or commonly called load balancing is needed so that traffic can run well, and avoid overloading the server [6].
Figure-2. Load Balancing [6].
Figure-2 above is a computer architecture that is combined with load balancing. Then divided into several devices, that is:
a. Client is the user who uses the service on the server. b. Load Balancer, the technique of dividing traffic load
distribution.
c. Server, the task is to provide services to users, namely a web server.
C. Mininet
Mininet is a Command Line Interface (CLI) emulator for making large-scale network prototypes quickly on very limited resources [1]. Mininet was created with the aim of supporting research in the field of SDN. The Mininet emulator itself makes it possible to run a code interactively without having to modify the code. That is, the simulation code is exactly the same as the code in the real network environment. Mininet is also a solution that is considered the most superior in various ways such as ease of use, accuracy and scalability. Mininet is able to provide a reality and easy configuration at a low price. Compared to testbed hardware which tends to be more expensive, it is very difficult to be reconfigured, but more accurate than using the Mininet emulator [5].
D. POX
POX is an open source development platform for Software Defined Network (SDN) applications that is based on the Python programming language and is an Open Flow controller [9].
List of POX features as follows:
a) Display resembles python for Open Flow interface on POX performance graph.
b) Can be run on all systems. Specifically operated for the Linux, Mac OS, and Windows operating systems.
METHOD
In this paper, we offer a method load balancing on the Network Defined Network (SDN) will be designed using an ant colony optimization algorithm, and the use of
a single topology on the SDN network and run with a Mininet emulator, configuration with a POX controller.
The Ant algorithm is adopted from the behavior of an ant colony known as the ant system (Dorigo, 1996) which is a probabilistic technique for solving computational problems by finding the best path through graphs [2]. Ant colonies can find the shortest route between nests and food sources based on footprints on the trajectory that has been traversed. The more ants that pass through a track, the clearer the trace of the foot will be [1]. This will cause the trajectory of the ants to pass in a small amount, the longer the ant density will overtake, or it will not even pass at all. Conversely, the trajectory that ant traverse in large quantities, the longer the ant density increases, the more ants will pass through the trajectory [1].
Load Balancer receive a request from the client, then the request will forward to the server Usually, the Load Balancer intelligently can determine where is the server has a lower load and faster response,it can even stop access to servers that are experiencing problems and only forward them to servers that can provides services, andthe service seems to have no interference in the user's eyes[11].
In this simulation, the parameters and scenarios to be elaborated will be carried out. For this testing phase, the testing will be carried out:
a) Testing the throughput
Actual speed on a connection path when making requests from client to server. The formula for calculating throughput values is [13]:
Throughput = Amount of data sent
Completion time … (1)
b) Testing the CPU utilization
CPU utilization is the amount of work issued by the Central Processing Unit. CPU utilization shows that in things that must be done in the system, if not then the capacity will run out. The formula for calculating is [12]:
CPU Utilization = 100% - CPU Idle (%) … (2)
EXPERIMENT SETUP
Table-1. Simulation Setup.
Simulation Tool Mininet
Platform Windows 10
OS Ubuntu 16 VM
CPU Intel® Core™ i5-5200U
VGA Card NVIDIA Geforce GTX 930M
RAM 8GB
SDN Controller POX
Supporting Tools Miniedit, mpstat
The network topology for this simulation is arranged in Figure-3. This topology from the simulation scenario 2.
Figure-3. Topology for simulation.
Figure-3 shows the general description of load balance on SDN networks that will be applied using an ant colony optimization algorithm. The following is an explanation of Figure-3:
a) Client, sends a request
b) Switch, this device aims to forward requests from the controller.
c) POX Controller, tasked with managing switches that are sending requests.
d) Server, served as a service provider from client request.
RESULTS AND DISCUSSIONS
The test gives results that contain information and values of throughput and CPU utilization in two ant colony optimization algorithms.
Scenario 1:
Implementation has h1, h2 and h6 as server and h3, h4, h5, h7, h8, h9, h10, h11, h12, h13 as client using Mininet as tools to monitoring the network. The server represented using the default port, default TCP window size (85,3 KByte), interval 0.0-10.0 second.
Figure-4. The result of scenario 1 on Mininet.
First simulation scenario using 3 server and 10 clients with 100 requests. Based on the topology, the results of the completion time (s) is low and throughput (MB/s) is high, the result can be seen on the table below.
Table-2. Result from scenario 1.
Server Completion time (s)
Throughput (MB/s)
Server 1 74.8 5.6335
Server 2 75.6 5.3972
Server 3 75.5 5.5127
Scenario 2:
Implementation has h1, h2 and h6, h14, h15 as server and h3, h4, h5, h7, h8, h9, h10, h11, h12, h13 as client using Mininet as tools to monitoring the network. The server represented using the default port, default TCP window size (85, 3 KByte), interval 0.0-10.0 second.
Figure-5. The result of scenario 2 on Mininet.
Table-3. Result from scenario 2.
Server Completion time (s)
Throughput (MB/s)
Server 1 56.8 4.4945
Server 2 70.2 3.503
Server 3 56.1 4.728
Server 4 59 4.2285
Server 5 47.3 4.98
Scenario 3:
Implementation has h1, h2 and h6, h14, h15 as server and h3, h4, h5, h7, h8, h9, h10, h11, h12, h13 as client using Mininet as tools to monitoring the network. The server represented using the default port, default TCP window size (85, 3 KByte), interval 0.0-10.0 second.
[image:4.595.308.546.95.237.2]The third simulation scenario using 10 server and 50 clients with 100 requests. The results of the scenario 2 also get results the completion time (s) is low and throughput (MB/s) is high. Client send a request to server and the result can be seen in table below.
Table-4. Results from scenario 3.
Server Completion time (s) Throughput (MB/s)
Server 1 69.8 1.851
Server 2 84.1 2.112
Server 3 77.9 1.709
Server 4 76.2 1.816
Server 5 82.9 1.744
Server 6 88.4 1.601
Server 7 96.8 1.313
Server 8 80.5 2.2
Server 9 55.2 1.851
Server 10 74.4 2.112
Throughput test result
[image:4.595.50.287.105.220.2]Throughput testing is divided into 3 test simulation scenarios including 3 servers and 10 clients with 100 requests, 5 servers and 10 clients with 100 requests, 10 servers and 50 clients with 100 requests.
Table-5. Average results from 3 scenario.
Simulation Avg. Completion time (s)
Avg. Throughput (MB/s)
Scenario 1 2.259 5.5157
Scenario 2 2.894 4.3868
Scenario 3 7.862 1.8555
The results of the comparison of throughput values after averaging are presented in the figure 6 below.
Figure-6. Comparison of average results in 3 simulation scenario of throughput value.
Based on Figure-6, the x axis is the number of scenarios and the y axis is the number of throughput value. This test it can be concluded that the results of throughput using the ant colony optimization algorithm can increase the throughput value.
CPU utilization test result
CPU utilization testing is divided into 3 test simulation scenarios consisting of 3 server and 10 clients with 100 requests, 5 servers and 10 clients with 100 requests, 10 servers and 50 clients with 100 requests.
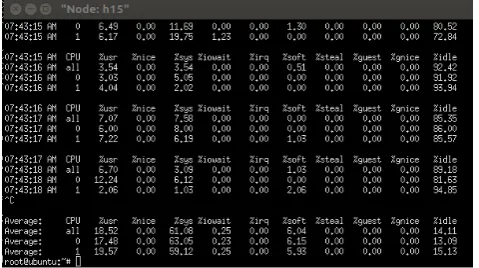
Figure 7. CPU utilization test.
5.5157
4.3868
1.8555
0 1 2 3 4 5 6
Scenario 1 Scenario 2 Scenario 3
T
h
ro
u
g
h
p
u
t
(M
B
/s)
Comparison of average results in 3 scenarios of throughput value
Y
[image:4.595.309.549.416.550.2]Table-6. CPU utilization result.
Server Scenario 1 Scenario 2 Scenario 3
Server 1
= 100 % - 23.05% = 76.95%
= 100 % - 15.25% = 84.75%
= 100 % - 15.23% = 84.77%
Server 2
= 100% - 22.63% = 77.37%
= 100% - 17.22% = 82.78%
= 100% - 14.62% = 85.38%
Server 3
= 100% - 23% = 77%
= 100% - 16.82% = 83.18%
= 100% - 16.6% = 83.4%
Server
4 None
= 100% - 14.72% = 85.28%
= 100% - 15.53% = 84.47%
Server
5 None
= 100% - 14.45% = 85.55%
= 100% - 14.11% = 85.89%
Server
6 None None
= 100% - 16.21% = 83.79%
Server
7 None None
= 100% - 14.22% = 85.78%
Server
8 None None
= 100% - 16.16% = 83.84%
Server
9 None None
= 100% - 15.31% = 84.69%
Server
10 None None
= 100% - 17.87% = 82.13%
Based on the results of the CPU utilization value, the difference is taken from the largest CPU utilization value minus the lowest CPU utilization value in each test.
Table-7. The differences of CPU utilization in scenario.
Simulation Difference CPU utilization
Scenario 1 0.42
Scenario 2 2.77
Scenario 3 3.02
Figure-8. Comparison of the difference CPU utilization in scenario.
The x axis is the number of scenarios and the y axis is the number of CPU utilization. Figure 8 shows CPU utilization generated by the ant colony optimization algorithm is evenly distributed because it has a low CPU utilization difference value for each server.
CONCLUSIONS
The implementation of ant colony algorithm was carried out on a network simulation that uses Mininet emulator. Several simulation scenarios with varies scenarios had been conducted. The experiment recorded completion time, the throughput, and traffic load between two or more internet connection lines when load balancing algorithm is applied. By using the ant colony, the value of throughput was greater than Round-Robin. The test results are intended to maximize the speed. CPU utilization generated by the ant colony optimization algorithm is evenly distributed because it has a less CPU utilization difference value for each server. Ant colony optimization load balancing algorithm will stabilize the overloaded server, so it can be concluded that the use of this algorithm will be very helpful because this algorithm has a mechanism that is fitting in order to look for the shortest path.
REFERENCES
[1] Mann A., Talwar R., Bhushan B. and Gupta R. 2012. A Review of Ant Colony Optimization. International Journal of Engineering and Social Science.
[2] Salem A., Sleit A. 2018. Analysis of Ant Colony Optimization Algorithm solutions for Travelling Salesman Problem. International Journal of Scientific & Engineering Research. 9(2).
[3] Mustafa M. E. G. 2017. Load Balancing Algorithm Round-robin (RR), Least-Connection, and Least Loaded Efficiency. Computer Science and Telecommunications.
0.42
2.77 3.02
0 1 2 3 4 5 6
Scenario 1 Scenario 2 Scenario 3
C P U U ti li za ti o n ( %)
Comparison of the difference CPU utilization in scenario
[4] Tkachova O., Chinaobi U. and Yahya A. R. 2016. A Load Balancing Algorithm for SDN. Third International Scientific-Practical Conference Problems of Info communications Science and Technology.
[5] Keti F., Askar S. 2015. Emulation of Software Defined Networks Using Mininet in Different Simulation.6th International Conference on Intelligent Systems, Modelling and Simulation.
[6] Keslassy I., Chang C. S., McKeown N., Lee D. F. 2005. Optimal Load-Balancing. Proceedings of IEEE INFOCOM.
[7] Hadianto R., Purboyo T. W. 2018. A simulation study of SDN defense against Botnet attack based on network traffic detection. ARPN Journal of Engineering and Applied Sciences.
[8] Fajar A. P., Purboyo T. W. 2018. Experimental Study of Flood Type Distributed Denial-of-Service Attack in Software Defined Networking (SDN) Based on Flow Behaviors. ARPN Journal of Engineering and Applied Sciences.
[9] Azodolmolky Siamak. 2013. Software Defined Networking with Open Flow. Published by Packt Publishing Ltd.
[10]Suwandika I. P. A, Nugroho M. A. 2018. Increasing SDN Network Performance Using Load Balancing Scheme on Web Server.2018 6th International Conference on Information and Communication Technology (ICoICT).
[11]Kasmar A. F., Haryadi S. 2017. Delay analysison load balancing NDN, case study: Palapa ring. 3rd International Conference on Wireless and Telematics (ICWT).
[12]Perdana F. P., Irawan B., Latuconsina R. 2017. Load Balancing Performance Analysis Based on Weigthed Round Robin Algorithm In Software Defined Network (SDN). e-Proceeding of Engineering: Vol. 4.