GE-INTERNATIONAL JOURNAL OF ENGINEERING RESEARCH
VOLUME -3, ISSUE -5 (May 2015) IF-4.007 ISSN: (2321-1717)
ESTIMATION OF SOLAR ENERGY POTENTIAL OF BUILDING ROOFTOPS
USING REMOTE SENSING AND GIS
S. Jayalakshmi
Institute of Remote Sensing, Anna University, Chennai – 25
ABSTRACT
With about 300 clear sunny days in a year, India's theoretical incident solar radiation
(insolation), just on its land area, is about 5 PWh/year (i.e. = 5000 trillion kWh/yr). The daily average
solar energy incident over India varies from 4 to 7 kWh/m2 with about 2,300–3,200 sunshine hours per
year, depending upon location. This is far more than current total energy consumption. A significant
portion of Chennai’s electricity can be produced either by large utility-scale solar power stations or
with small, distributed solar power systems installed in individual buildings. This study discusses the
application of geographical information system (GIS) to map the solar potential of some of the
individual building roof tops in Alwarpet region, Chennai.
Producing energy in large solar power stations requires vast tracts of land and may necessitate
an extensive upgrade of the power grid. Distributed production using photovoltaic panels on rooftops,
on the other hand, does not have these drawbacks and takes advantage of the omnipresence of
insolation. Assessment of available rooftop area in these buildings, using a complete set of GIS and
Remote sensing data and its photovoltaic potential has been estimated using Point Solar Radiation tool
in ArcGis 9.3. This analysis provides a picture of the potential of individual buildings. Roof-mounted
solar heating and photovoltaic systems are not only important technologies to decrease the emissions
of carbon dioxide caused by domestic fuel consumption, but they also help saving energy and financial
costs. Therefore, today the worldwide use of solar systems is increasing. Private investors as well as
local authorities have a rising interest in identifying roof areas which are suitable for mounting solar
systems. Thus a more economic, environment friendly and feasible scenario for the near future is
derived, assuming PV installations only on large (>100 m2) rooftops and with lower panel efficiencies (16%). It is found that even in this case, a substantial amount of today’s electricity dem and can be met.
GE-INTERNATIONAL JOURNAL OF ENGINEERING RESEARCH
VOLUME -3, ISSUE -5 (May 2015) IF-4.007 ISSN: (2321-1717)
1. Introduction
Energy crisis is one of the most important challenges faced by many countries. Solar power in particular has increased in popularity due to its wide-ranging applicability and, in many cases, government-sourced financial incentives (Pragya and Tirumalachetty 2014, Ramachandra 2007 ). As solar power generation continues to grow, new methods for sitting this technology are being developed (Alstan et al 2013). Many of these sitting techniques use GIS software and remote sensing data to evaluate true solar potential for large-scale solar farms, distributed generation scenarios, and building- scale systems (Charith et al 2011, Alessandro et al 2014, Caiaffa et al 2014 and Esclapse et al 2014). No matter the scale of the analysis - from rural plains to individual rooftops - GIS and remote sensing play a pivotal role (Bareth et al 2005, Ben et al 2010, Melius et al, 2013 and Johan et al 2014).
Solar energy plays a vital role as a renewable energy because of its unpolluted nature and its reliability in tropical countries (Charith et al 2011). Tamil Nadu is one of the states located in the southern peninsular region of India lying in the sunny belt between 8.5 ˚ and 13.35 ˚ N. Its geographical location is advantageous for utilizing the solar energy. For effective and efficient utilization of solar energy, it is necessary to have a precise knowledge about the various components of solar energy available at the locations of our interest. Global radiation is the most important component of solar radiation since it gives the total solar availability at a given place. Everyone agrees in principle that solar energy is a good idea. But even metro cities like Chennai hasn’t harnessed it for conversion to electricity as some barriers still exist that prevent solar energy entering the mainstream.
Tamil Nadu Solar Policy was introduced in October 2013. Till then, the State had solar power capacity of 7 Mega Watts (MW). Now, as a consequence of a tender floated by the Tamil Nadu Generation and Distribution Company (TANGEDCO), at least 226-MW worth of projects is very likely to be set up within a year. A part from this there are many other private developers such as INDarya Green Power which intends to put up a 300-MW solar park. Given the level of interest among developers, it is not inconceivable that the State could end up with 1,000 MW in the next couple of years
GE-INTERNATIONAL JOURNAL OF ENGINEERING RESEARCH
VOLUME -3, ISSUE -5 (May 2015) IF-4.007 ISSN: (2321-1717)
The other is the Rs. 20,000 subsidy which the Chief Minister announced recently for capacities up to 1 KW. But the rules are still being formulated. This study may help individual building owners to think about installing solar panels on their roof tops.
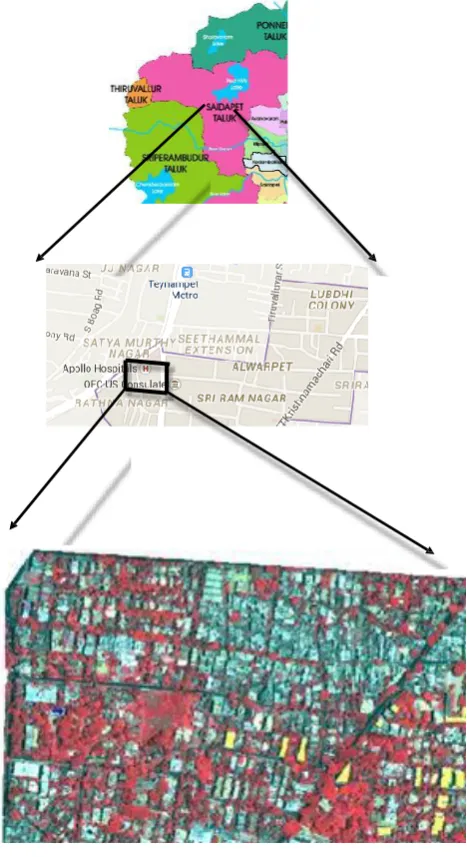
2. Study Area Description
Alwarpet is a mixed residential zone in central Chennai. The area has commercial, Residential and Institutional buildings with varying heights. The study area falls under the ward Alwarpet which is in Kodambakkam zone. The extent of Latitude and Longitude consider in this study is 13°02’07.58’’N to 13°02’05.01’’ N, 13°01’42.51’’ N to 13°01’45.13’’N , 80°14’55.27’’ E to 80°15’34.06’’E and 80°15’35.89’’E to 80°14’53.25’’ E respectively. Extent of the study area is
971583.870 m2. Alwarpet is chosen as the study area since it has got more buildings with open
GE-INTERNATIONAL JOURNAL OF ENGINEERING RESEARCH
VOLUME -3, ISSUE -5 (May 2015) IF-4.007 ISSN: (2321-1717)
Figure 1 Study Area
3. Methodology
GE-INTERNATIONAL JOURNAL OF ENGINEERING RESEARCH
VOLUME -3, ISSUE -5 (May 2015) IF-4.007 ISSN: (2321-1717)
used to find the solar radiation values for individual buildings using 3Danalyst tool in ARC GIS
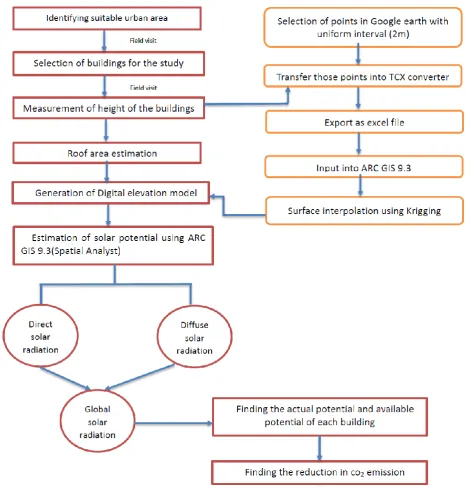
9.3. The obtained raw radiation values which are in w/m2 is converted into available solar potential in KWh using the roof area of each building. The available solar radiation values and the efficiency of solar panels are used to find actual solar potential of individual buildings. The actual solar potential value is used to estimate the amount of carbon footprint reduction. The complete methodology is described on a flowchart shown in F igure 2 .
3.1 Calculation of Roof Area and Height of the of the Buildings
The roof area of all the 26 buildings are found using ARC GIS 9.3 by digitizing the roof areas using QUICKBIRD satellite imagery with 0.6m resolution which is PAN merged and Orthorectified. The roof areas are found using Calculate area tool which is available in SPATIAL STATICS TOOL in ARC GIS 9.3.
GE-INTERNATIONAL JOURNAL OF ENGINEERING RESEARCH
VOLUME -3, ISSUE -5 (May 2015) IF-4.007 ISSN: (2321-1717)
Figure 3 Methodology of the study
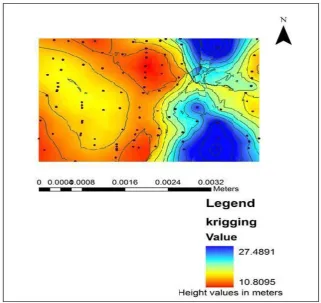
3.2 Generation of Digital Elevation Model
GE-INTERNATIONAL JOURNAL OF ENGINEERING RESEARCH
VOLUME -3, ISSUE -5 (May 2015) IF-4.007 ISSN: (2321-1717)
points by Krigging surface interpolation method using ARC GIS 9.3.
3.3 Estimation of Solar Radiation
The solar potential of the each building is found using a tool POINT SOLAR RADIATION which is available in the SPATIAL ANALYST tool in ARC GIS 9.3. Using this tool the amount of direct radiation, diffuse radiation, global radiation and the annual solar duration of each building is obtained.
3.3.1 Estimation of Direct Solar Radiation
The direct insolation from the sunmap sector (Dirθ,α) with a centroid at zenith angle (θ)
and azimuth angle (α) is calculated using the equation 1
Dirθ, α = SConst * βm (θ)* SunDurθ,α * SunGapθ,α * cos(AngInθ,α ………….(1)
Where,
SConst is the solar flux outside the atmosphere at the mean earth-sun distance, known as solar
constant. The solar constant used in the analysis is 1367 w/m2.
β is transmisivity of the atmosphere (averaged over all wavelengths) for the shortest path (in the
direction of the zenith)
m(θ) is the relative optical path length, measured as a proportion relative to the zenith path length
SunDurθ,α is the time duration represented by the sky sector. For most sectors, it is equal to the day interval (for example, a month) multiplied by the hour interval (for example, a half hour). For partial sectors (near the horizon), the duration is calculated using spherical geometry.
SunGapθ,α is the gap fraction for the sunmap sector.
AngInθ,α is the angle of incidence between the centroid of the sky sector and the axis normal to the surface
Relative optical length (m(θ)) is determined by the solar zenith angle and elevation above sea
level. For zenith angles less than 80o, it can be calculated using the equation 2
M (θ) = EXP (-0. 000118 * Elev - 1. 638 * 10-9 * Elev2) /cos (θ) ………… (2)
Where,
GE-INTERNATIONAL JOURNAL OF ENGINEERING RESEARCH
VOLUME -3, ISSUE -5 (May 2015) IF-4.007 ISSN: (2321-1717)
Elev is elevation above sea level in meters.
The effect of surface orientation is taken into account by multiplying by the cosine of the angle
of incidence. Angle of incidence (AngInSkyθ,α) between the intercepting surface and a given
sky sector with a centroid at zenith angle and azimuth angle is calculated using the equation 3
AngInθ,α= acos[Cos(θ)*Cos(Gz)+Sin(θ)*Sin(Gz)*Cos(α-Ga)] …………...(3)
Where,
Gz is the surface zenith angle.
Ga is the surface azimuth angle. (For zenith angles greater than 80° refraction is important).
Total direct insolation (Dirtot) for a given location is the sum of the direct insolation
(Dirθ,α) from all sunmap sectors and is calculated using equation 4
Dirtot = ΣDirθ, α ………. (4)
3.3.2 Estimation of Diffuse Solar Radiation
For each sky sector, the diffuse radiation at its centroid (Dif) is calculated, integrated over the
time interval, and corrected by the gap fraction and angle of incidence using the equation 5
Difnθ,α = Rglb * Pdif * Dur * SkyGapθ,α * Weightθ,α * cos(AngInθ,α) …………(5)
Where,
Rglb is the global normal radiation.
Pdif is the proportion of global normal radiation flux that is diffused. I t is approximately 0.2 for very clear sky conditions and 0. 7 for very cloudy sky conditions.
Dur is the time interval for analysis
SkyGapθ,α is the gap fraction (proportion of visible sky) for the sky sector
Weightθ,α is the proportion of diffuse radiation originating in a given sky sector .
AngInθ,α is the angle of incidence between the centroid of the sky sector and the intercepting surface.
The global normal radiation (Rglb) can be calculated by summing the direct radiation
from every sector (including obstructed sectors) without correction for angle of incidence, then correcting for proportion of direct radiation, which equals to 1- Pdif and it is shown in equation 6
Rglb = (SConst Σ(βm(θ)))/ (1 - Pdif) ………(4.6)
GE-INTERNATIONAL JOURNAL OF ENGINEERING RESEARCH
VOLUME -3, ISSUE -5 (May 2015) IF-4.007 ISSN: (2321-1717)
Weightθ,α = (cosθ2- cos θ1) / Divazi ……….(4.7)
Where,
θ1 and θ2 are the bounding zenith angles of the sky sector;
Divazi is the number of azimuthal divisions in the skymap.
For the standard overcast sky model, Weightθ,α is calculated using the equation 8
Weightθ,α = (2cosθ2+ cos2θ2- 2cosθ1- cos2θ1) / 4 * Divazi ………..(8)
Total diffuse solar radiation for the location (Diftot) is calculated as the sum of the diffuse solar
radiation (Dif) from all the skymap sectors and it is shown in equation 9
Diftot = ΣDifθ,α ………….(9)
3.3.3 Estimation of Global Solar Radiation
Global radiation (Globaltot) is calculated as the sum of direct (Dirtot) and diffuse (Diftot) radiation of all sunmap and skymap sectors, respectively and it is shown in equation 10
Globaltot = Dirtot + Diftot ……… (10)
3.4 Estimation of Actual and Available Solar Potential
The output from Point Solar Radiation tools is invariably a raster. Using equation 11 the raster output from point solar radiation can be converted into electrical units.
(KWh) = (Wh/m2)*[shape_area]/1000 …………(11)
After finding the available potential, Actual potential is obtained using equation 12.
Actual potential = KWh * Efficiency of Solar Panel ………. (12)
The efficiency of solar panels are considered as 16% of the total solar radiation, hence the efficiency value is taken as 0.16.The efficiency of solar panels depends on the materials used in production. The average efficiency ranges from 16% to 20% (Piera, and Teller, 2014).
3.5. Estimation of Carbon Footprint Reduction
For producing 1 unit of electricity i.e. 1 KWh from coal 612.5 g of co2 is emitted (Cranston
GE-INTERNATIONAL JOURNAL OF ENGINEERING RESEARCH
VOLUME -3, ISSUE -5 (May 2015) IF-4.007 ISSN: (2321-1717)
Carbon footprint reduction (kg) = Actual Potential * 0.6125 ……….. (13)
4. Results and Discussion
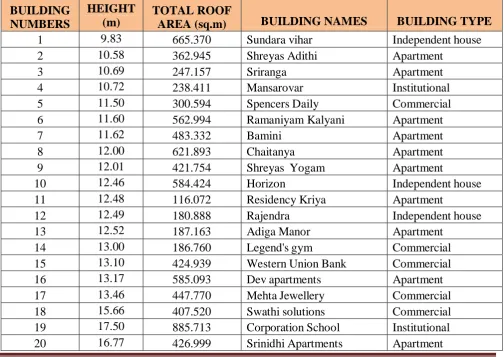
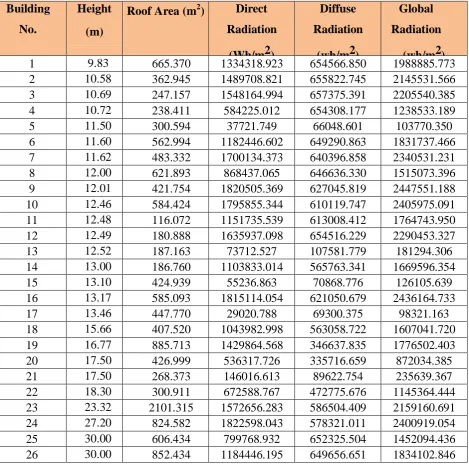
4.1 Height and Roof Area of Buildings
[image:10.595.53.558.407.764.2]The height of the buildings found using LASER MEASURING TAPE (BOSCH DLE40) and the roof area found using ARC GIS 9.3. From Table 1 it is observed that the elevation of the buildings varies from 9.83m to 30.0m with an average height of 15.36m.The buildings chosen vary between residential, commercial and institutional. The Ramaniyam towers, an apartment complex, are the highest in the study area. Larger the rooftop, more energy can be harnessed and in that regard, Park Sheraton, a popular hotel has the highest area value of 2101.315 sq.m The roof area is extracted from a PAN sharpened Quickbird image of 0.6m resolution. This can be seen in figure 3.The buildings fall within a maximum radius of 3km.
Table 1 Building information
BUILDING NUMBERS
HEIGHT (m)
TOTAL ROOF
AREA (sq.m) BUILDING NAMES BUILDING TYPE
1 9.83 665.370 Sundara vihar Independent house
2 10.58 362.945 Shreyas Adithi Apartment
3 10.69 247.157 Sriranga Apartment
4 10.72 238.411 Mansarovar Institutional
5 11.50 300.594 Spencers Daily Commercial
6 11.60 562.994 Ramaniyam Kalyani Apartment
7 11.62 483.332 Bamini Apartment
8 12.00 621.893 Chaitanya Apartment
9 12.01 421.754 Shreyas Yogam Apartment
10 12.46 584.424 Horizon Independent house
11 12.48 116.072 Residency Kriya Apartment
12 12.49 180.888 Rajendra Independent house
13 12.52 187.163 Adiga Manor Apartment
14 13.00 186.760 Legend's gym Commercial
15 13.10 424.939 Western Union Bank Commercial
16 13.17 585.093 Dev apartments Apartment
17 13.46 447.770 Mehta Jewellery Commercial
18 15.66 407.520 Swathi solutions Commercial
19 17.50 885.713 Corporation School Institutional
GE-INTERNATIONAL JOURNAL OF ENGINEERING RESEARCH
VOLUME -3, ISSUE -5 (May 2015) IF-4.007 ISSN: (2321-1717)
21 17.50 268.373 Coral classic Apartment
22 18.30 300.911 State Bank of India Commercial
23 23.32 2101.315 Park Sheraton Commercial
24 27.20 824.582 Shanthi Haven Residential
25 30.00 606.434 Ramaniyam abbotsbory1 Apartment
26 30.00 852.434 Ramaniyam abbotsbory2 Apartment
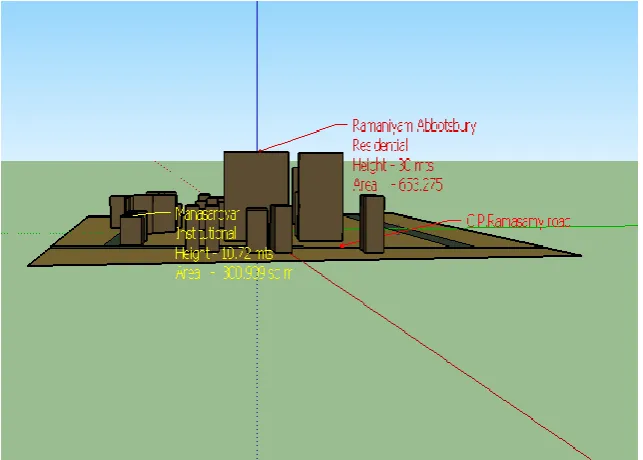
4.2 Extrution of Buildings
The buildings taken for the analysis are extruded based on their heights in GOOGLE SKETCH UP tool. This tool helps to view the buildings in 3D.The extruded buildings are shown in the figure 4. Apart from Visualization, GOOGLE SKETCHUP can also be used to determine the shadow effect of the buildings Here we see Ramaniyam abbotsbory with a height of 30m is surrounded by buildings whose average height is 15m Hence the amount of solar radiation received on these buildings will be lesser due to shadow effect from the taller nearby building . Solar simulation can also be done to determine the shadow effect on each building.
GE-INTERNATIONAL JOURNAL OF ENGINEERING RESEARCH
VOLUME -3, ISSUE -5 (May 2015) IF-4.007 ISSN: (2321-1717)
Figure 4 Extruded buildings view in google sketch up with their details
4.3 Digital Elevation Model
GE-INTERNATIONAL JOURNAL OF ENGINEERING RESEARCH
VOLUME -3, ISSUE -5 (May 2015) IF-4.007 ISSN: (2321-1717)
Figure 5 Digital Elevation Model
4.4 Point Solar Radiation
The radiation reaching the earth's surface can be represented in a number of different ways. Using the input of digital elevation model which in turn computes a viewshed raster from which the global radiation is computed. In this study area direct solar radiation values vary from
29020.788wh/m2 to 1822598.043wh/m2. Diffuse solar radiation varies from 66048.601 wh/m2 to
657375.391 wh/m2. The global solar radiation values vary from 98321.163 wh/m2 to 2447551.188
wh/m2.
4.4.1 Direct Solar Radiation
The Direct solar radiation values considers only the radiation that falls directly on the roof area is
GE-INTERNATIONAL JOURNAL OF ENGINEERING RESEARCH
VOLUME -3, ISSUE -5 (May 2015) IF-4.007 ISSN: (2321-1717)
Table 2 Solar radiation values
Building No.
Height (m)
Roof Area (m2) Direct Radiation (Wh/m2) Diffuse Radiation (wh/m2) Global Radiation (wh/m2)
1 9.83 665.370 1334318.923 654566.850 1988885.773
2 10.58 362.945 1489708.821 655822.745 2145531.566
3 10.69 247.157 1548164.994 657375.391 2205540.385
4 10.72 238.411 584225.012 654308.177 1238533.189
5 11.50 300.594 37721.749 66048.601 103770.350
6 11.60 562.994 1182446.602 649290.863 1831737.466
7 11.62 483.332 1700134.373 640396.858 2340531.231
8 12.00 621.893 868437.065 646636.330 1515073.396
9 12.01 421.754 1820505.369 627045.819 2447551.188
10 12.46 584.424 1795855.344 610119.747 2405975.091
11 12.48 116.072 1151735.539 613008.412 1764743.950
12 12.49 180.888 1635937.098 654516.229 2290453.327
13 12.52 187.163 73712.527 107581.779 181294.306
14 13.00 186.760 1103833.014 565763.341 1669596.354
15 13.10 424.939 55236.863 70868.776 126105.639
16 13.17 585.093 1815114.054 621050.679 2436164.733
17 13.46 447.770 29020.788 69300.375 98321.163
18 15.66 407.520 1043982.998 563058.722 1607041.720
19 16.77 885.713 1429864.568 346637.835 1776502.403
20 17.50 426.999 536317.726 335716.659 872034.385
21 17.50 268.373 146016.613 89622.754 235639.367
22 18.30 300.911 672588.767 472775.676 1145364.444
23 23.32 2101.315 1572656.283 586504.409 2159160.691
24 27.20 824.582 1822598.043 578321.011 2400919.054
25 30.00 606.434 799768.932 652325.504 1452094.436
26 30.00 852.434 1184446.195 649656.651 1834102.846
4.4.2 Diffuse Solar Radiation
GE-INTERNATIONAL JOURNAL OF ENGINEERING RESEARCH
VOLUME -3, ISSUE -5 (May 2015) IF-4.007 ISSN: (2321-1717)
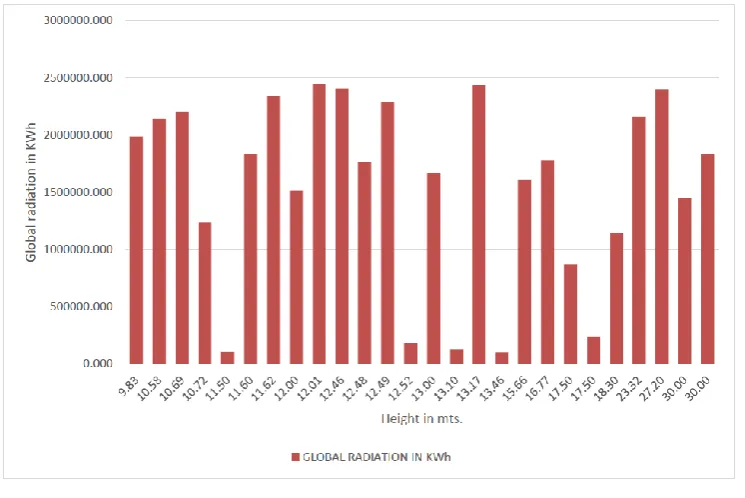
4.4.3 Global Solar Radiation
The global solar radiation values are the sum of the Direct and Diffuse solar radiation and the values are shown in the table 2 . Here the building Mehta jewellery which has a higher diffused radiation compared to Sundara vihar, a building of height 11.5m, has a lesser direct radiation of
29020.788 Wh/m2 as compared to Sundara Vihar. Thus it has an overall lesser global radiation of
98321.163 Wh/m2.The building Mehta jewellery as discussed in section 5.2, is surrounded by a lot of
[image:15.595.115.488.329.578.2]vegetation and other buildings which tends to create a shadow on its rooftop which inhibits the sunshine over the rooftop. Similarly areas with higher solar potential tend to not only have a larger roof area but also have lesser disturbances like building shadows and vegetation cover. Figure 6 shows a variation of global radiation with height of the buildings.
Figure 6 Variation in global solar radiation with respect to building heights.
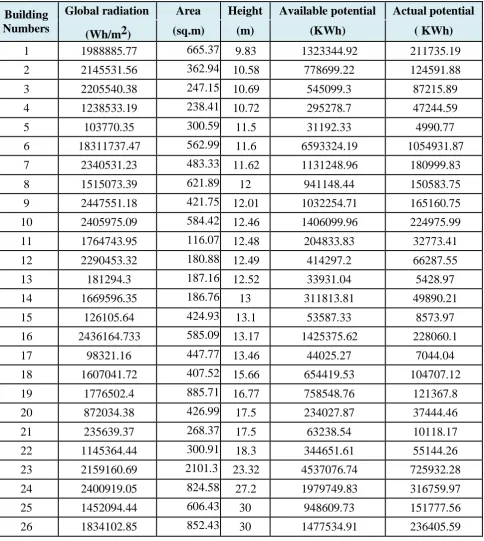
4.5 Actual and Available Solar Potential
GE-INTERNATIONAL JOURNAL OF ENGINEERING RESEARCH
VOLUME -3, ISSUE -5 (May 2015) IF-4.007 ISSN: (2321-1717)
Table 3 Actual and available solar potential of each building.
Building Numbers
Global radiation Area Height Available potential Actual potential (Wh/m2) (sq.m) (m) (KWh) ( KWh)
1 1988885.77 665.37
0
9.83 1323344.92 211735.19
2 2145531.56 362.94
5
10.58 778699.22 124591.88
3 2205540.38 247.15
7
10.69 545099.3 87215.89
4 1238533.19 238.41
1
10.72 295278.7 47244.59
5 103770.35 300.59
4
11.5 31192.33 4990.77
6 18311737.47 562.99
4
11.6 6593324.19 1054931.87
7 2340531.23 483.33
2
11.62 1131248.96 180999.83
8 1515073.39 621.89
3
12 941148.44 150583.75
9 2447551.18 421.75
4
12.01 1032254.71 165160.75
10 2405975.09 584.42
4
12.46 1406099.96 224975.99
11 1764743.95 116.07
2
12.48 204833.83 32773.41
12 2290453.32 180.88
8
12.49 414297.2 66287.55
13 181294.3 187.16
3
12.52 33931.04 5428.97
14 1669596.35 186.76
0
13 311813.81 49890.21
15 126105.64 424.93
9
13.1 53587.33 8573.97
16 2436164.733 585.09
3
13.17 1425375.62 228060.1
17 98321.16 447.77
0
13.46 44025.27 7044.04
18 1607041.72 407.52
0
15.66 654419.53 104707.12
19 1776502.4 885.71
3
16.77 758548.76 121367.8
20 872034.38 426.99
9
17.5 234027.87 37444.46
21 235639.37 268.37
3
17.5 63238.54 10118.17
22 1145364.44 300.91
1
18.3 344651.61 55144.26
23 2159160.69 2101.3
15
23.32 4537076.74 725932.28
24 2400919.05 824.58
2
27.2 1979749.83 316759.97
25 1452094.44 606.43
4
30 948609.73 151777.56
26 1834102.85 852.43
4
GE-INTERNATIONAL JOURNAL OF ENGINEERING RESEARCH
VOLUME -3, ISSUE -5 (May 2015) IF-4.007 ISSN: (2321-1717)
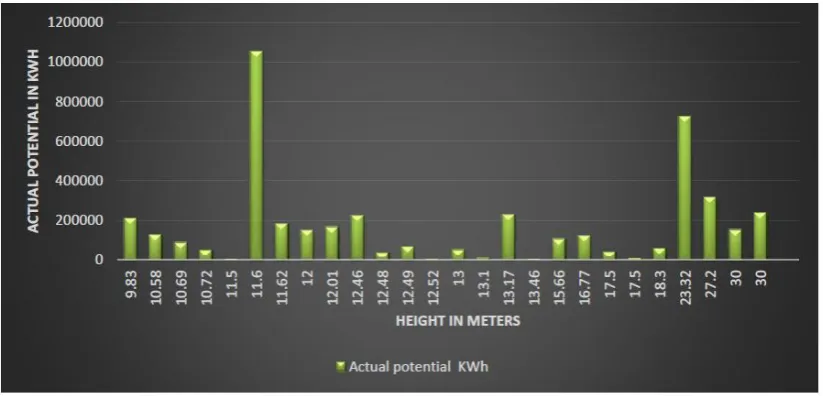
A Monthly Double-Blind Peer Reviewed Refereed Open Access International e-Journal - Included in the International Serial Directories. Variation in solar potential with respect to height and area are shown in the figure 7 and
[image:17.595.96.508.242.440.2]figure 8 respectively. As we know, for every 1000m increase in height there is a 6.5 degree Celsius decrease in temperature. Thus for 20m there is a decrease of 0.13° C , which is negligible for our study area. Here standard temperature values have been taken on a monthly basis. In this case the solar potential is based on area. Hence Park Sheraton and Ramaniyam has more actual potential compare to other buildings in the study area.
[image:17.595.93.508.515.689.2]Figure 7 Variation in actual potential with respect to height
GE-INTERNATIONAL JOURNAL OF ENGINEERING RESEARCH
VOLUME -3, ISSUE -5 (May 2015) IF-4.007 ISSN: (2321-1717)
A Monthly Double-Blind Peer Reviewed Refereed Open Access International e-Journal - Included in the International Serial Directories. GE- International Journal of Engineering Research (GE-IJER)
4.6 Reduction in Carbon Dioxide Emission
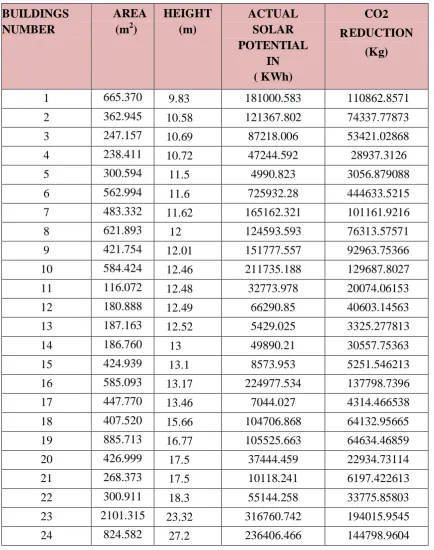
[image:18.595.83.518.188.738.2]The amount of carbon footprint reduction found using the actual potential and reduction value (0.6125g) for all 26 buildings is shown in table 4.
Table 4 Amount of carbon footprint that can be reduced using solar energy
BUILDINGS NUMBER
AREA (m2)
HEIGHT (m) ACTUAL SOLAR POTENTIAL IN ( KWh) CO2 REDUCTION (Kg)
1 665.370 9.83 181000.583 110862.8571
2 362.945 10.58 121367.802 74337.77873
3 247.157 10.69 87218.006 53421.02868
4 238.411 10.72 47244.592 28937.3126
5 300.594 11.5 4990.823 3056.879088
6 562.994 11.6 725932.28 444633.5215
7 483.332 11.62 165162.321 101161.9216
8 621.893 12 124593.593 76313.57571
9 421.754 12.01 151777.557 92963.75366
10 584.424 12.46 211735.188 129687.8027
11 116.072 12.48 32773.978 20074.06153
12 180.888 12.49 66290.85 40603.14563
13 187.163 12.52 5429.025 3325.277813
14 186.760 13 49890.21 30557.75363
15 424.939 13.1 8573.953 5251.546213
16 585.093 13.17 224977.534 137798.7396
17 447.770 13.46 7044.027 4314.466538
18 407.520 15.66 104706.868 64132.95665
19 885.713 16.77 105525.663 64634.46859
20 426.999 17.5 37444.459 22934.73114
21 268.373 17.5 10118.241 6197.422613
22 300.911 18.3 55144.258 33775.85803
23 2101.315 23.32 316760.742 194015.9545
GE-INTERNATIONAL JOURNAL OF ENGINEERING RESEARCH
VOLUME -3, ISSUE -5 (May 2015) IF-4.007 ISSN: (2321-1717)
A Monthly Double-Blind Peer Reviewed Refereed Open Access International e-Journal - Included in the International Serial Directories.
25 606.434 30 150754.166 92336.92668
[image:19.595.97.503.188.468.2]26 852.434 30 228061.269 139687.5273
Figure 9 Variation in CO2 reduction with respect to actual potential.
The average Co2 reduction is 81,531 kg per annum. Evidently, from table. 4 the more the surface
area of rooftops, more is the potential of the building rooftops hence more carbon emissions can be
reduced. Solar energy if even implemented to a marginal extent can greatly reduce CO2 emissions. Here the
building Park Sheraton with a potential of 725932.28 KWh has the highest reduction in CO2. Commercial
buildings like Park Sheraton can invest more on solar energy. The building with least actual potential,
Spencers daily has the least amount of CO2 reduction of 3056.879 kg per annum. Variation in Co2
GE-INTERNATIONAL JOURNAL OF ENGINEERING RESEARCH
VOLUME -3, ISSUE -5 (May 2015) IF-4.007 ISSN: (2321-1717)
5 Conclusion
In this study the heights of the buildings which are measured with an accuracy of 1.5mm using a laser tape and the roof area of the buildings found using Quickbird data are used as analysing parameters. The results analysed reveal that the solar radiation has more dependency on area than height. Buildings which are short and large in area also has good amount of solar radiation.
This study has been carried out to find the solar potential in roof tops of individual buildings. The results reveal that there is a good amount of solar radiation available in the study area. The total amount of solar radiation that can be obtained from 26 buildings are 3460924.454 KWh. The total amount of carbon emission that can be reduced using solar energy in the study area is 2119816.23 kg.
The utility of solar potential is not an issue that is not anymore. It carries the answer to the ills ailing the present world with regards to climate change and depletion of conventional resources. Anyhow, the efficient and economical use of solar energy is essential. Chennai being the capital of Tamil Nadu has immense potential being in the tropical zone too.
References:
1.
Alessandro Marucci, Emanuela Caiaffa, Flavio Borfecchia, Luigi De Cecco,Luigi La Porta1, Maurizio Pollino1 and Sandro Martini1 (2014), “Remote Sensing and GIS in planning photovoltaic potential of urban areas”, European Journal of Remote Sensing , 47: 195-216.
2.
Alstan. J, Christoph F. Reinhart and Jakubiec. 2013. “A Method for PredictingCity-Wide Electricity Gains from Photovoltaic Panels Based on LiDAR and GIS Data Combined with Hourly Daysim Simulations.” Solar Energy, 93: 127–143.
3.
Bareth. G, Kassner. R, Koppe. W, Schüttenberg. T (2005), “analysis of the solarGE-INTERNATIONAL JOURNAL OF ENGINEERING RESEARCH
VOLUME -3, ISSUE -5 (May 2015) IF-4.007 ISSN: (2321-1717)
4.
Ben Ryan, Elisabeth Long, Leslie Libby, Steve Wiese (2010)” Solar RooftopAssessment for Austin”, American Solar Energy Society, published in the SOLAR
2010 Conference Proceedings.
5.
Caiaffa, Flavio Borfecchia, Luigi De Cecco, Luigi La porta, Maurizio, Marucci,Sandro Matini (2014) “RS & GIS in planning photovoltaic potential of urban areas”, European Journal of Remote sensing, volume 47: 195 – 216.
6.
Charith Tammineedi, Choi, Jeffrey Rayl, Jeffrey R.S. Brownson and Yosoon. 2011.“PV Analyst: Coupling ArcGIS with TRNSYS to Assess Distributed Photovoltaic
Potential in Urban Areas.” Solar Energy 85 (11): 2924–2939.
7.
Cranston.G.R and Hammond.(2010), “Egalite, fraternite, sustainable: evaluatingthe significance of regional affluence and population growth on carbon emissions”,
International journal of Global warming, 2(3):
http://www.sciencedaily.com/releases/2010/10/101026141445.htm(21- 03-2015)
8.
Esclapés, J., I. Ferreiro, J. Piera, and J. Teller. 2014. “A Method to Evaluate theAdaptability of Photovoltaic Energy on Urban Façades.” Solar Energy 105 : 414–427.
9.
John Byrne , Job Taminiau a,n, Lado Kurdgelashvili , Kyung Nam Kim (2014), “Areview of the solar city concept and methods to assess rooftop solar electric potential, with an illustrative application to the city of Seoul”, Elsevier volume 41: 830 – 844.
10.
Melius, Margolis and Ong (2013), “Estimating rooftop Suitability forPhotovoltaics : A review of methods, Patents and validation techniques”,
NREL,NREL/TP-6A20-60593. http://www.nrel.gov/publications. (23.1.2015).
11.
Pragya Sharma, Tirumalachetty Harinarayana (2014),” Solar energy generationpotential along national highways”, Sharma and Harinarayana International Journal of Energy and Environmental Engineering, volume 4(16): 1-13
12.
Ramachandra T. V. (2007), “Solar energy potential assessment using GIS”, Energy