© Associated Asia Research Foundation (AARF)
A Monthly Double-Blind Peer Reviewed Refereed Open Access International e-Journal - Included in the International Serial Directories. Page | 9
GE-International Journal of Management Research
ISSN (O): (2321-1709), ISSN (P): (2394-4226) Impact Factor- 5.779, Volume 7, Issue 01, January 2019
Website- www.aarf.asia, Email : [email protected] , [email protected]
DEMOGRAPHIC VARIABLES – DO THEY HAVE AN IMPACT ON
EMOTIONAL INTELLIGENCE
Dr. N Vishnu Priya
Asst. Professor, PG & Research Department of Management Science, PARK’s College (Autonomous), Chinnakkarai, Tirupur 641605, Tamil Nadu, India.
ABSTRACT
This research paper is aimed to understand whether the demographic variables (such
as age, educational qualification, marital status, family size, and type of hospital) of the
individuals have an impact on Emotional Intelligence (EI). The research was conducted
among woman physicians of Tirupur District for which data was collected through a well
structured questionnaire using Census sampling technique. The sample size was 128 among
which 39 were government physicians and 89 were private physicians. The analysis of the
collected data was carried out using Percentage, Mean score analysis and ANOVA. The
results explained that the physicians of private hospitals had slightly better levels of EI than
government physicians. Higher age, better educational qualification and married
respondents showed better EI levels.
Key Words : emotional intelligence, demographic variables, women physicians, Tirupur
Introduction
Individuals persistently look forward to be happy and successful, for which they have
constantly been striving to innovate in different angles of thought in order to achieve it. The
level of one’s perception from various angles and cope up abilities during problems has an
impact on the intensity of happiness and satisfaction in life. EI stands as a key element to
contentment and eventually success. It is the skill of understanding the emotions of oneself
© Associated Asia Research Foundation (AARF)
A Monthly Double-Blind Peer Reviewed Refereed Open Access International e-Journal - Included in the International Serial Directories. Page | 10
other individuals, groups and the society at large. EI was defined by Salovey and Mayer
(1990) as “a form of social intelligence that involves the ability to monitor one’s own and other’s feelings and emotions, to discriminate among them and to use this information to guide one’s thinking and actions.”In simple words, EI can be explained as the combined
effort of the brain and the conscience; where Intelligence is understood as the effort of the
brain while emotions are the outcome of one’s conscience. It is believed that the mind may
go wrong but the conscience will never make a mistake in handling delicate situations. Women play a momentous role in the society, be it in their homes or outside. The
contributions of working women make a significant impact on their confidence levels and
also have a boost in the economy of the nation.
In India, women constituted 51% of the students joining medical colleges, filling up
23,522 seats in 2014-15 compared to 22,934 men (Times of India). However, there is a severe
dearth of female physicians in India. According to a paper titled Human Resources for Health
in India, published in 2011 (the medical journal Lancet), only 17% of all allopathic
physicians and 6% of those in rural areas are women physicians. This means there was less
than one female allopathic doctor per 10,000 people in rural areas (0.5), but, the ratio is 6.5 in
urban areas. Thus this untapped potential of women, when channelised in a proper direction
would pave way for a brilliant economic growth and health of the nation.
Health care profession is a hands-on job in which emergencies and pressures occur
without warning at hospitals. Despite the female physician's decision to reduce her agenda of
work, if she has to be successful, she has to put in extra efforts which may be difficult to deal
with. EI is an attribute that helps these physicians to cope up in shouldering their dual
responsibilities of both work and family.
Demographic attributes of a person such as age, educational qualification, work
experience, marital status, family type, family size and so on may have an impact on the EI
levels of people. This study aims at investigating if certain demographic attributes have an
impact on EI.
Need for the Study
A women physician helps the society in many ways. Women physicians are known to
be more polite and have more patience when compared to most of their male counterparts
[Ferguson, et al., (2002), Kilminster, et al., (2007), Woolf, (2009)]. Women patients feel
more comfortable to talk to lady physicians and children too always seem to enjoy treatment
© Associated Asia Research Foundation (AARF)
A Monthly Double-Blind Peer Reviewed Refereed Open Access International e-Journal - Included in the International Serial Directories. Page | 11
emotions, worries and the patient’s requirements are more successful in giving treatment to
them. Therefore, the interpersonal communication between both, the patient and the
physician, stages a vital role in the patient outcomes. Considering this, Emotionally
Intelligent physicians may be taken as a valuable resource for hospitals. Due to the tedious
nature of the job, there are many women physicians who are unable to cope up with the dual
responsibilities of taking care of their home and their profession as well. This leads to many
of them giving up their profession. There is a serious need for increasing the number of
practising women physicians. They may consider enhancing their EI skills and thus find cope
up solutions to their problems. Through this, there may be a chance of increasing the number
of practicing women physicians which would be extremely helpful for the society and the
nation at large.
Objectives of the Study
1. To study the demographic profile of the respondents
2. To understand the level of Emotional Intelligence of the respondents
3. To examine whether the demographic variables have an impact on Emotional
Intelligence of the respondents
Hypothesis Tested
a. H1 - Emotional Intelligence level in relation to age
b. H2 - Emotional Intelligence in relation to educational qualification
c. H3 - Emotional Intelligence in relation to type of hospital
d. H4 - Emotional Intelligence in relation to marital status
e. H5 - Emotional Intelligence in relation to size of family Limitations of the Study
The study covered woman physicians of the Tirupur district only and the sample
respondents were limited in number and the results of the study cannot be generalized for any
other profession. The EI constructs were around certain key factors only and thus the results
might be indicative in nature.
Methodology
Data for the study was collected with the help of a well structured questionnaire. The
EI questions were set based on Hay Group’s 10 situational based questions. Each question
© Associated Asia Research Foundation (AARF)
A Monthly Double-Blind Peer Reviewed Refereed Open Access International e-Journal - Included in the International Serial Directories. Page | 12
the help of experienced psychologists and psychiatrists. The total marks that each respondent
got for all the 10 answers were taken to indicate their EI level. Sampling Technique and
sample size: Census Sampling technique was used. The study aimed to target all the women
physicians in Tirupur District. List of women physicians were obtained from Indian Medical
Associations, Indian Dental Associations, Tirupur Government Hospital Headquarters and
Directorate of Primary Health Centres, Tirupur. According to the lists obtained the population
(number of women physicians) was 352. Questionnaires were distributed among all these
women physicians either directly or through post, out of which 128 completely filled in
questionnaires fit for analysis were received. Percentage analysis, Average Mean Scores and
ANOVA methods were used to analyse the data.
Literature Review
Mondal, Paul & Bandyopadhyay (2012) analyzed the nature and extent of EI among
secondary level schools teachers and revealed that few demographic factors positively
impacted on the level of the teacher’s EI.
Singh and Srivastava (2012) investigated age of managers and their effect on EI. He
proved that age affected EI in groups of up to 30 and 50-60 years old people.
Gaitniece-Putane (2006) used the MANOVA test and found that age, gender and its interaction together
influenced EI, specifically in dimensions of empathy and social responsibility.
Martimes, Fernandez and Salovey (2006) surveyed Spanish students and found that
females showed higher EI than males with aging, and that EI increased as well for both.
Cumming (2005)explored the relation of EI with demographic factors and concluded that
there existed no relation between demographic factors such as gender, age occupational
groups, education and EI.
Wong (2002) attempted to study the relationship of EI with age and experience. The
results showed that EI was significantly and positively related to demographic factors such as
© Associated Asia Research Foundation (AARF)
A Monthly Double-Blind Peer Reviewed Refereed Open Access International e-Journal - Included in the International Serial Directories. Page | 13 Analysis and Discussion
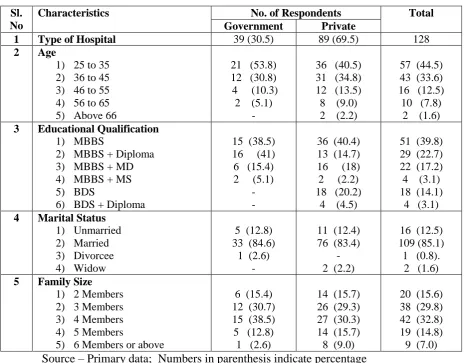
[image:5.595.66.533.123.486.2]1. Demographic Profile of the Respondents
Table 1
Demographic profile of the respondents Sl.
No
Characteristics No. of Respondents Total
Government Private
1 Type of Hospital 39 (30.5) 89 (69.5) 128
2 Age
1) 25 to 35 2) 36 to 45 3) 46 to 55 4) 56 to 65 5) Above 66
21 (53.8) 12 (30.8) 4 (10.3) 2 (5.1)
-
36 (40.5) 31 (34.8) 12 (13.5) 8 (9.0) 2 (2.2)
57 (44.5) 43 (33.6) 16 (12.5) 10 (7.8)
2 (1.6) 3 Educational Qualification
1) MBBS
2) MBBS + Diploma 3) MBBS + MD 4) MBBS + MS 5) BDS
6) BDS + Diploma
15 (38.5) 16 (41) 6 (15.4) 2 (5.1)
- -
36 (40.4) 13 (14.7) 16 (18) 2 (2.2) 18 (20.2)
4 (4.5)
51 (39.8) 29 (22.7) 22 (17.2) 4 (3.1) 18 (14.1)
4 (3.1) 4 Marital Status
1) Unmarried 2) Married 3) Divorcee 4) Widow
5 (12.8) 33 (84.6)
1 (2.6) -
11 (12.4) 76 (83.4)
- 2 (2.2)
16 (12.5) 109 (85.1) 1 (0.8).
2 (1.6) 5 Family Size
1) 2 Members 2) 3 Members 3) 4 Members 4) 5 Members
5) 6 Members or above
6 (15.4) 12 (30.7) 15 (38.5) 5 (12.8) 1 (2.6)
14 (15.7) 26 (29.3) 27 (30.3) 14 (15.7) 8 (9.0)
20 (15.6) 38 (29.8) 42 (32.8) 19 (14.8) 9 (7.0)
Source – Primary data; Numbers in parenthesis indicate percentage
Demographic Profile of the respondents can be explained from Table 1. 69.5% of the
total respondents worked in private hospitals. 44.5 % of the respondents were between 25 to
35 years. 39.8% of them were MBBS graduates. 85.1%of them were married and 32.8% of
the total respondents lived among a member family.
2. Analysing the Level of Emotional Intelligence
The EI construct consisted of situation based questions. Each question was framed so
as to understand the level of one factor of EI. Each question was followed by 5 responses
which were rated with scores of 1 to 5 and were listed randomly (5 points was given to the
best Emotionally Intelligent answer and 1 to the least). The scores were not marked on the
© Associated Asia Research Foundation (AARF)
A Monthly Double-Blind Peer Reviewed Refereed Open Access International e-Journal - Included in the International Serial Directories. Page | 14
situation and choose one among the five given answers that would best suit their reaction.
The chosen responses were then used to analyse the EI levels of the respondents as below.
2.1 Total Emotional Intelligence Level of the Respondents - Percentage
The total EI score of the respondents was calculated by summing up the scores of all
the ten statements put together. Based on the total score the respondents were divided into
three categories, i.e., low, moderate and high. Total scores from 5 to 20 were marked as low
EI, scores between 21 and 35 were marked as moderate EI and 36 to 50 were marked as high
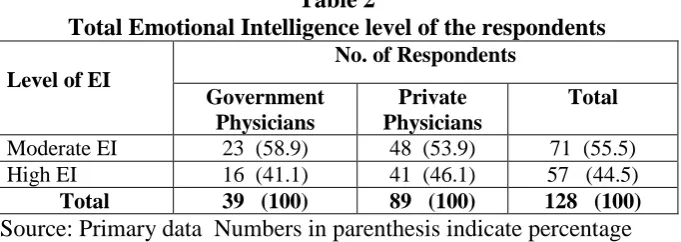
[image:6.595.129.470.233.354.2]EI which are represented in the table 2.
Table 2
Total Emotional Intelligence level of the respondents
Level of EI
No. of Respondents
Government Physicians
Private Physicians
Total
Moderate EI 23 (58.9) 48 (53.9) 71 (55.5) High EI 16 (41.1) 41 (46.1) 57 (44.5) Total 39 (100) 89 (100) 128 (100)
Source: Primary data Numbers in parenthesis indicate percentage
Among the respondents 55.5 percent of the sample physicians showed a moderate
level of EI and 44.5 percent of them were observed with a high level of EI. The findings are
in slight contrast with the results of Manoharan (2015).None of the respondents fell in the
low EI category.
2.2 Mean Score Analysis – Emotional Intelligence Factors
Mean scores were derived for the EI factors and ranks were assigned based on the
average mean score of all the statements for each EI factor individually which are as
© Associated Asia Research Foundation (AARF)
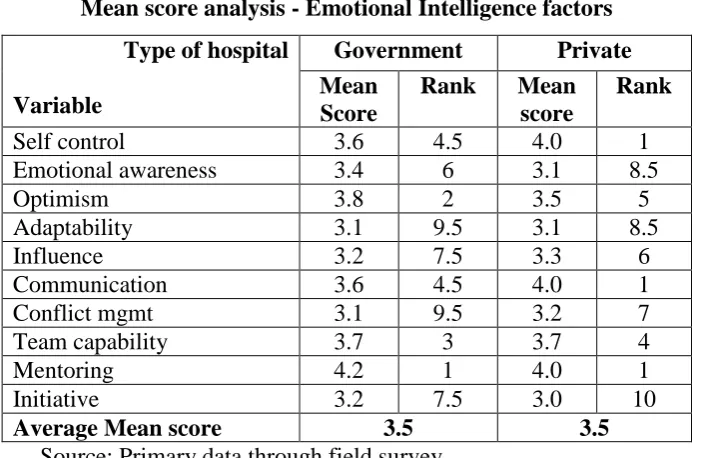
[image:7.595.124.475.60.289.2]A Monthly Double-Blind Peer Reviewed Refereed Open Access International e-Journal - Included in the International Serial Directories. Page | 15 Table 3
Mean score analysis - Emotional Intelligence factors Type of hospital
Variable
Government Private
Mean Score
Rank Mean score
Rank
Self control 3.6 4.5 4.0 1 Emotional awareness 3.4 6 3.1 8.5
Optimism 3.8 2 3.5 5
Adaptability 3.1 9.5 3.1 8.5 Influence 3.2 7.5 3.3 6 Communication 3.6 4.5 4.0 1 Conflict mgmt 3.1 9.5 3.2 7 Team capability 3.7 3 3.7 4
Mentoring 4.2 1 4.0 1
Initiative 3.2 7.5 3.0 10
Average Mean score 3.5 3.5
Source: Primary data through field survey
The average mean score for the EI factors among government physicians as well as
private physicians was calculated to be 3.5
Based on the average mean score, the government physicians were strong in
mentoring as its mean score was 4.2 which was high above the average mean score. Next
came optimism with 3.8 as its mean score, Team capability had a mean score of 3.7, self
control and communication had 3.6 proving that the government physicians were good in
these factors also. They had to improve slightly in Emotional awareness which scored 3.4.
Factors like influence and initiative were calculated to be 3.2 whereas adaptability and
conflict management were 3.1 showing that these qualities were not strong among the
government physicians as the scores for these items were less than the average means score
of 3.5.
On the basis of the calculated average mean score (3.5), it could be understood that
the private physicians were strong in self control, communication, and mentoring (as their
mean score was calculated to be 4). They had good skills of team capability with 3.7 as its
mean score and optimism (3.5) which was exactly the same as the average mean score.
Influence and conflict management abilities came next with a score of 3.3 and 3.2
respectively, while, emotional awareness and adaptability had mean scores of 3.1. Initiative
had the least score of 3 showing lower abilities of it. This indicates that the private physicians
were lacking in Influencing skills, conflict management, emotional awareness, initiative and
© Associated Asia Research Foundation (AARF)
A Monthly Double-Blind Peer Reviewed Refereed Open Access International e-Journal - Included in the International Serial Directories. Page | 16
3. Impact of Demographic Variables on Emotional Intelligence - ANOVA
(i) H1 - Emotional Intelligence level in relation to age
About 78 percent of respondents were concentrated among ages of less than 35 years
(44.5%) and 36 & 45 years (33.6%). Therefore these categories of ages were chosen to judge
as to whether there was a difference in EI levels. The results are explained in table 4.
H0 : There is no positive relation between level of Emotional Intelligence and age group of
the respondents
Table 4
Means, SD and F-ratio of subscales and Mean Scores of Emotional Intelligence in relation to Age
Age Group Percentage of respondents
Means Standard Deviation
F- statisti
cs
Degrees of Freedom
Inference
Below 35 years 44.5 3.411 0.38158 7.633 1 Reject H0*
36 to 45 years 33.6 3.610 0.31298 H0 – Null Hypothesis ; *Significant at 5% level
Table 4 shows the mean scores (< 35 years = 3.411 and 36 to 45 years = 3.610) of the
levels of EI of the respondents clearly shows an increase in the mean scores as it goes higher
to the next level, which indicates that EI improves with increase in age of a person. This
proves that, as a person grows older, his life experience that he gains would be richer, which
in turn would help him handle situations better.
It was observed that the p value (0.007) was less than 0.05, and hence the null
hypothesis proposed is rejected and hence proven that there is a positive relationship between
EI with an increase in the age of the respondents. The results are in tune with that of the
studies conducted by Hassan et al., (2011), Pooja et al., (2016), Jeya et al., (2012)
(ii) H2 -Emotional Intelligence in relation to Educational Qualification
The study categorised the respondents into two – the ones with Post Graduate
degree/diploma and the other with an Under Graduate degree.
To judge whether the respondents with a with Post Graduate degree/diploma such as
MD, MS or Diploma, along with the MBBS/BDS had a difference in EI level when compared
with the respondents who possessed an Under Graduate degree in medicine, ANOVA was
© Associated Asia Research Foundation (AARF)
A Monthly Double-Blind Peer Reviewed Refereed Open Access International e-Journal - Included in the International Serial Directories. Page | 17
H0 : There is no difference in the means of Emotional Intelligence levels across Post
Graduate and Under Graduate physician groups
Table 5
Means, SDs and f-ratio of subscales and Mean Scores of Emotional Intelligence in relation to educational qualification
Educational qualification
Percentage of respondents
Means Standard Deviation
F- statistics
Degrees of Freedom
Inference
MBBS/BDS 53.9 3.413 0.354 5.111 1 Reject H0*
MBBS/BDS with MD/MS/Diploma
46.1 3.555 0.365
H0 – Null Hypothesis ; *Significant at 5% level
The table 5 explains that the mean value of EI of the Post Graduate physicians (3.555)
was higher than that of the Under Graduate physicians (3.413). This explains that better
educational qualifications lead to enhanced EI.
The p value (0.025) was less than 0.05, so the proposed Null hypothesis was rejected
which proves that there is a significant increase in EI level among better qualified sample
physicians. The results were similar to that of the studies conducted by Hassan et al., (2011)
Pooja et al., (2016), Jeya et al., (2012).
(iii) H3 - Emotional Intelligence in relation to type of hospital
Physicians working in Indian Government Hospitals would be facing patients who
generally belonged to the lower economic strata, out of which some of them may be
illiterates. These physicians may need to handle the problems of the patients in a totally
different way when compared to others for which EI would be helpful.
To assess whether there was difference in the levels of EI among practitioners of the
two different types of hospitals ANOVA was applied. The results are explained in table 6.
H0: There is no significant difference in the mean values of Emotional Intelligence among
© Associated Asia Research Foundation (AARF)
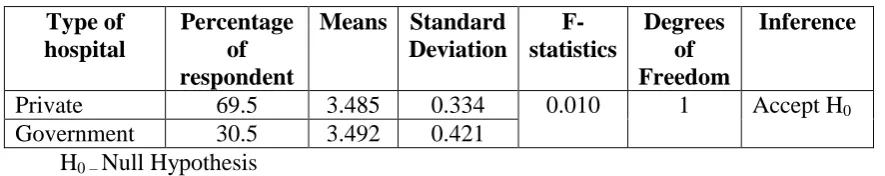
[image:10.595.78.521.95.183.2]A Monthly Double-Blind Peer Reviewed Refereed Open Access International e-Journal - Included in the International Serial Directories. Page | 18 Table 6
Means, SDs and f-ratio of subscales and mean scores of Emotional Intelligence in relation to type of hospital
Type of hospital
Percentage of respondent
Means Standard Deviation
F- statistics
Degrees of Freedom
Inference
Private 69.5 3.485 0.334 0.010 1 Accept H0
Government 30.5 3.492 0.421 H0 – Null Hypothesis
Table 6 explains that the mean values among the physicians across the Private (3.485)
and Government Hospitals (3.492) were almost same and hence it is insignificant. The p
value was 0.921. Therefore it can be understood that the type of hospital has no effect on the
EI level of the respondents and thus the proposed null hypothesis was accepted. This explains
that there was no significant difference in the level of EI among the respondents of the two
different types of hospitals. The results were in tune with the studies of Shavita (2015) and
Deeksha Sharma (2014) but were seen to be in contrast with the findings of Makkar (2015).
Rekha Tomar’s (2016) findings reported better EI levels among private physicians when
compared to their government counterparts.
(iv) H4 - Emotional Intelligence in relation to marital status
Married working women tend to have more responsibilities when compared to single
working women. They have the necessity of shouldering the dual roles of both their homes
and work places, the experiences of which should enable them to handle life situations in a
better way. With this context, the researcher wanted to analyse whether married respondents
had better levels of EI when compared to respondents living as singles. To judge the same
ANOVA test was applied. The results are explained in table 7.
H0 : The mean of Emotional Intelligence is not greater for married women physicians than
© Associated Asia Research Foundation (AARF)
[image:11.595.82.519.97.180.2]A Monthly Double-Blind Peer Reviewed Refereed Open Access International e-Journal - Included in the International Serial Directories. Page | 19 Table 7
Means, SDs and f-ratio of subscales and mean scores of Emotional Intelligence in relation to marital status
Marital Status
Percentage of respondents
Means Standard Deviation
F- statistics
Degrees of Freedom
Inference
Married 85.1 3.525 0.349 8.281 1 Reject H0*
Single 14.9 3.274 0.365 H0 – Null Hypothesis ; *Significant at 1% level
Table 7 depicts that there is significant variation in the levels of Means among the
married respondents (3.525) and the solitary respondents (3.274). The p value (0.005) was
less than 0.01 which proves that the proposed Null hypothesis could be rejected and hence the
respondents who were married showed better levels of EI when compared to those who lived
as singles. The results were in tune with the results of Mohammad et al., (2013.
(v) H5 Emotional Intelligence in relation to size of family
People have varied natures. Even siblings of the same parents vary in their
behaviours. When there are more number of people in a family, each member needs to have
confrontations with more people with varied natures inside the family itself. This may lead to
enhance the skills of understanding the behaviours of people to a better extent.
To judge whether there was difference in EI among respondents with the family size
of less than 3 members and those living in families with more than 4 members, ANOVA was
applied. The results are explained in table 8.
H0 : There is no positive relation between the family size and Emotional Intelligence level of
[image:11.595.78.520.584.689.2]the respondents
Table 8
Means, SDs and f-ratio of subscales and mean scores of Emotional Intelligence in relation to size of family
Size of family
Percentage of respondents
Means Standard Deviation
F- statistics
Degrees of Freedom
Inference
3 or lesser members
45.4 3.441 0.405 1.162 2 Accept H0
4 or more members
54.6 3.521 0.318
© Associated Asia Research Foundation (AARF)
A Monthly Double-Blind Peer Reviewed Refereed Open Access International e-Journal - Included in the International Serial Directories. Page | 20
The mean score (3.521) of EI of the respondents (table 8) whose family size was 4 or
greater showed a small increase when compared to those living among a family size of 3 or
lesser members (3.441). The p value (0.316) which is greater than 0.05, explains that the null
hypothesis can be accepted and hence it can be understood that EI levels did not differ among
respondents who lived in a bigger family. But as a little higher value was found in the means
of the larger family group it could be understood that people living in larger families could
have better EI. More elaborate studies in this area is suggested The findings were in contrast
with that of Moranda (1999).
Findings of the Study
Percentage analysis
69.1% of the total respondents worked in private hospitals. 44.5 % of them belonged
to the age between 25 and 35 years. 39.8% of them were MBBS graduates. 85.1% of
them were married and 32.8% of the total respondents lived among a family
consisting of 4 members.
44.5 percent of the total respondents showed high level of EI
Average Mean Scores
The government physicians were strong in mentoring, optimism, team capability, self
control and communication. The private physicians were strong in self control,
communication, mentoring, team capability and optimism (in the order of their
average mean scores)
ANOVA Results
EI was found to increase with the age of the respondents
A significant increase in EI level was found among better qualified sample physicians
The type of hospital had no effect on the EI level of the respondents
Married respondents showed better levels of EI when compared to those who lived as
singles
EI levels did not differ among respondents who lived in different family sizes.
Conclusion
From the study among 128 woman physicians, it was understood that the levels of EI
varied to some extent between the respondents of the two different types of hospitals. EI
increased with age and better qualifications. EI was also found to be better among married
© Associated Asia Research Foundation (AARF)
A Monthly Double-Blind Peer Reviewed Refereed Open Access International e-Journal - Included in the International Serial Directories. Page | 21 References
Cumming, E. A. (2005). An Investigation into the Relationship between Emotional
Intelligence and Workplace Performance: An Exploratory Study, Unpublished Master’s
Thesis Lincoln University, Pennsylvania.
Deeksha Sharma, Indiwar Mishra, Vaibhav Sharma, (2014). Emotional Intelligence among
employees of government and public sectors, International Journal of Social Sciences,
Vol. III (3)
Ferguson E, James D, Madeley L. (2002). Factors associated with success in medical
school: systematic review of the literature, BMJ, 324:952-7.
Gaitniece-Putane, A. (2006). Gender and age differences in Emotional Intelligence,
stoicism and aggression. Baltic Journal of Psychology, 7(2), 26-42.
Hassan Jorfi, Hashim Fauzy Bin Yaccob, Ishak Mad Shah, (2011). The Relationship
Between Demographics Variables, Emotional Intelligence, Communication Effectiveness,
Motivation, And Job Satisfaction, International Journal of Academic Research in Business
and Social Sciences, April 2011, Vol. 1, No. 1.
Jeya Amantha Kumar, Balakrishnan Muniandy, (2012). The Influence of Demographic
Profiles on Emotional Intelligence: A Study on Polytechnic Lecturers in Malaysia,
International Online Journal of Educational Sciences, 4(1), 62-70
Kilminster S, Downes J, Gough B, Murdoch-Eaton D, Roberts T. (2007). Women in
medicine-is there a problem? A literature review of the changing gender composition,
structures and occupational cultures in medicine, Medical Education, 41:39-49.
Makkar, Simarjeet, (2015). Impact of Emotional Intelligence on employees workplace
behaviour: a study in private and public sector banks, http://hdl.handle.net/10603/148386
Manoharan, M. N. (2015), Impact of Emotional Intelligence on interpersonal skills of
managers, PhD Thesis submitted to the University of Mysore in partial fulfillment of the
requirements for the award of the Degree of Doctor of Philosophy in Commerce.
Martines, D., Fernandez, B., & Extremera, N. (2006). Ethnic group differences in
perceived Emotional Intelligence within the United States and Mexico. Ansiedad y Estres,
12(2-3), 317-327
Mohammad Ebrahim Madahia, Nasirudin javidib, Mona Samadzadehb, (2013). The
relationship between Emotional Intelligence and marital status in sample of college
© Associated Asia Research Foundation (AARF)
A Monthly Double-Blind Peer Reviewed Refereed Open Access International e-Journal - Included in the International Serial Directories. Page | 22
Mondal, N.K., Paul, P.K and Bandyopadhyay.A (2012). A study of Emotional Intelligence
level between secondary school teachers: A study in Burdwan District in West Bengal,
International Journal of Social Science Tomorrow, Vol.1. No.4. pg 1-6 ISSB: 2277-6168
Morand DA, (1999), Family size and intelligence revisited: the role of Emotional
Intelligence, Psychol Rep. Apr, 84(2), 643-9.
Pooja and Pranab Kumar, (2016), Demographic Variables and Its Effect on Emotional
Intelligence: A Study on Indian Service Sector Employees, Annals of Neurosciences,
March 23(1) pp 18-24
Rekha Tomar, (2016). A Study of Emotional Intelligence among Doctors, International
Journal of Innovative Research & Development, Vol 5 Issue 6
Salovey, P. & Mayer, J. D. (1990). Emotional Intelligence, Imagination, Cognition and
Personality, 9, 185-211.
Shavita Deshwal, (2015). A Comparison of Emotional Intelligence between Government
and Private Sector Employees, International Journal of Applied Research, 1(4): 177-178
Singh, L. K., & Srivastava, R. (2012). Influence of age and gender on the Emotional
Intelligence of managers. Business Review, 7(1), 128-141.
Times of India:
https://timesofindia.indiatimes.com/india/More-women-study-medicine-but-few-practise/articleshow/50525799.cms
Wong, C.S. and Law, K.S. (2002). The effects of leader and follower Emotional
Intelligence on performance and attitude: an exploratory study. The Leadership Quarterly,
13(3), 243-74
Woolf K. (2009). The academic underperformance of medical students from ethnic