Evaluation of the UniCel
TM
DxI 800 Immunoassay Analyzer
in Measuring Five Tumor Markers
Younhee Park,
1Yongjung Park,
2Jungyong Park,
2and Hyon-Suk Kim
21Department of Laboratory Medicine, Kwandong University College of Medicine, Goyang;
2Department of Laboratory Medicine, Yonsei University College of Medicine, Seoul, Korea.
Received: July 21, 2011 Revised: September 5, 2011 Accepted: September 21, 2011 Corresponding author: Dr. Hyon-Suk Kim, Department of Laboratory Medicine, Yonsei University College of Medicine, 50 Yonsei-ro, Seodaemun-gu, Seoul 120-752, Korea.
Tel: 82-2-2228-2443, Fax: 82-2-364-1583 E-mail: [email protected]
∙ The authors have no financial conflicts of interest.
© Copyright:
Yonsei University College of Medicine 2012
This is an Open Access article distributed under the terms of the Creative Commons Attribution Non-Commercial License (http://creativecommons.org/ licenses/by-nc/3.0) which permits unrestricted non-commercial use, distribution, and reproduction in any medium, provided the original work is properly cited.
Purpose: Tumor marker concentrations in a given specimen measured by different
analyzers vary according to assay methods, epitopes for antibodies used, and re-agent specificities. Although great effort in quality assessment has been instituted, discrepancies among results from different analyzers are still present. We evaluated the assay performance of the UniCelTM DxI 800 automated analyzer in measuring the alpha-fetoprotein (AFP), carcinoembryonic antigen (CEA), carbohydrate anti-gen (CA) 125, CA 15-3 and CA 19-9 tumor markers. Materials and Methods:
The linearity and precision performance of the five tumor marker assays were evaluated, and concentrations of the respective markers as measured by DxI were compared to those measured by other conventional analyzers (ADVIA CentaurTM and VitrosTM ECi) using 200 specimens collected from 100 healthy persons and 100 patients with respective cancers. Results: The linear fits for all five tumor markers were statistically acceptable (F=4648 for AFP, F=15846 for CEA, F=6445 for CA 125, F=2285 for CA 15-3, F=7459 for CA 19-9; p<0.0001 for all). The im-precision of each tumor marker assay was less than 5% coefficient of variation, ex-cept for low and high concentrations of AFP. The results from UniCelTM DxI 800 were highly correlated with those from other analyzers. Conclusion: Our results demonstrate that UniCelTM DxI 800 has good linearity and precision performance for the tumor markers assayed in this study. However, there were discrepancies be-tween assaying methods. Efforts to standardize tumor marker assays should be un-dertaken, and the redetermination of cut-off levels is necessary when developing methods of analyzing tumor markers.
Key Words: Alpha-fetoprotein (AFP), CA 125, CA 15-3, CA 19-9,
carcinoem-bryonic antigen (CEA), tumor markers
INTRODUCTION
the use of nonisotopic immunoassays and the institution of quality assessment efforts, discrepancies still arise among results from different analyzers. Accordingly, standardized reagents for tumor marker assays are needed to ensure the reliability of the results from different assays, and the stan-dardization thereof is also important for commutability among results from different assays in order to deal with in-creased patient mobility between hospitals.
With the increased incidence and prevalence of cancers, the workload on tumor marker assays in clinical laborato-ries has also increased. The UniCelTM DxI 800 Access Im-munoassay System (DxI) is an automated instrument that can handle a large volume of various test items with high throughput, and only a few studies have tested the perfor-mance characteristics of this analyzer so far.14-16 In this study, we aimed to evaluate the analytical performance of this im-munoassay analyzer in measuring five tumor markers (AFP, CEA, CA 15-3, CA 125, and CA 19-9).
MATERIALS AND METHODS
Linearity and precision performance of the UniCelTM DxI 800 Access Immunoassay System (Beckman Coulter Inc., Brea, CA, USA) in measuring the five aforementioned tumor markers were evaluated. The results of the respective tumor marker levels as measured by DxI were compared with AFP, CEA, and CA 125 levels measured by the ADVIA CentaurTM XP Immunoassay System (Centaur) (Siemens Healthcare Diagnostics Inc., Deerfield, IL, USA) and with CA 15-3 and CA 19-9 concentrations measured by the VitrosTM ECi Im-munodiagnostic System (ECi) (Ortho Clinical Diagnostics Ltd., Auckland, New Zealand). All assays were performed according to the manufacturers’ instructions.
Precision performance evaluation
Imprecision of the assays by DxI was assessed based on guidelines from the Clinical and Laboratory Standards In-stitute (CLSI) document EP4-A2, using commercially available quality control materials of three levels (MAS T-Marker; Medical Analysis Systems, Camarillo, CA, USA) and pooled sera for the respective markers. Two daily runs of duplicate testing were conducted per day for 20 days, with a minimum of 2 hours between runs.
Linearity of the assays
Tests for validating the linearity of the assays were per-plays an important role in clinical research and diagnosis.
Currently, tumor markers are widely used during therapy in order to perceive an indication of response to therapy and to distinguish between remission and progression. Tumor markers also provide important information towards recog-nizing recurrences and metastases at an early point in dis-ease progression.2-7
Carcinoembryonic antigen (CEA) is a highly glycosylat-ed cell surface glycoprotein with a molecular weight of 150-300 kDa, which can be detected at high levels in colon epithelial cells during embryonic development. Levels of CEA are significantly lower in adult colon tissue, but be-come elevated when inflammation or tumors arise in any endodermal tissue, including that of the gastrointestinal tract, respiratory tract, pancreas, and breast.1,8-11 Alpha-feto-protein (AFP) is a glycoAlpha-feto-protein with a molecular mass of 70 kDa, which is synthesized in large quantities during em-bryonic development of the fetal yolk sac and liver, and it can be used as a marker for hepatocellular or germ cell (nonseminoma) carcinoma, except in pregnant individu-als.1,7 Carbohydrate antigen 15-3 (CA 15-3) was initially detected by the murine monoclonal antibody (MAb) DF3, prepared against the human breast carcinoma cell line MCF-7. The circulating DF3-reactive antigen is a heteroge-nous molecule with a molecular mass of 300 to 450 kDa. In previous studies, CA 15-3 was useful in monitoring therapy and predicting the progression of metastatic breast can-cer.1,2,12 The carbohydrate antigen 125 (CA 125) is a glyco-protein with about a 200 kDa molecular weight which is recognized by the monoclonal antibody OC 125, and mea-surement of the CA 125 antigen can aid in the management of patients diagnosed with ovarian cancer.1,13 Carbohydrate antigen 19-9 (CA 19-9) is a marker for both colorectal and pancreatic carcinoma, and is used in monitoring patients with these cancers during palliative chemotherapy in con-junction with imaging tests.1,4,10
yse-it Software Ltd., Leeds, UK). Comparisons between as-says were estimated with regression equations calculated by Passing and Bablok regression analysis and with the mean-difference plots of Bland and Altman.17-19
RESULTS
Precision performances
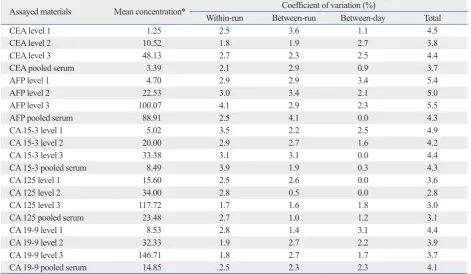
The within-run, between-run, between-day, and total preci-sion performances of five tumor markers are summarized in Table 1. Within-run imprecision ranged from 1.7% to 4.1% coefficient of variation (CV), and between-run and between-day imprecision was between 0.5% and 3.6% CV and between 0.0% and 3.4% CV, respectively. Total impre-cision ranged from 2.8% to 5.5% CV for all assessed levels of tumor markers.
Linearity of the assays
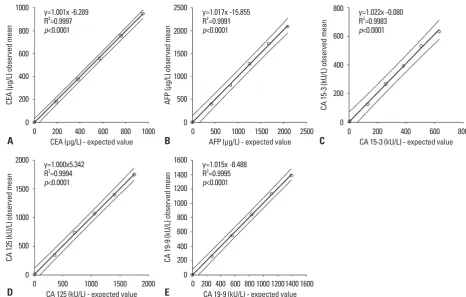
Linearity of the five tumor marker assays (CEA, AFP, CA 15-3, CA 125, and CA 19-9) were evaluated with 6 levels of serum samples prepared from mixing high and low pooled sera, of which the concentrations ranged from 951.41 to 0.80 μg/L for CEA, from 2092.91 to 1.86 μg/L for AFP, from formed based on the CLSI document EP6-A. Pooled serum
samples with high and low concentrations were mixed to make six equally spaced samples for their respective tumor markers. Four intermediate concentration pools were mixed as follows: 0.8 Low (L)+0.2 High (H), 0.6 L+0.4 H, 0.4 L+0.6 H, and 0.2 L+0.8 H. All pools were assayed in qua-druplicate for their respective markers, and the mean was compared with the expected values.
Method comparison
Correlation between the levels of tumor markers as mea-sured by DxI and Centaur or ECi were evaluated in 200 specimens for respective tumor markers (total 2000 tests with 1000 samples). All sera, which were requested for tu-mor marker testing, were collected and assayed for the re-spective tumor markers with DxI and other comparative in-struments on the same day. The samples with measured concentrations over the analytical measurement range were re-tested after dilution according to the manufacturers’ in-structions.
Statistical analysis
All statistical analyses were performed using the Analyse-it Method Evaluation Edition version 2.22 software
(Anal-Table 1. Precision Performances of UniCelTM DxI 800 in Measuring Five Tumor Markers
Assayed materials Mean concentration* Within-run Between-runCoefficient of variation (%)Between-day Total
CEA level 1 1.25 2.5 3.6 1.1 4.5
CEA level 2 10.52 1.8 1.9 2.7 3.8
CEA level 3 48.13 2.7 2.3 2.5 4.4
CEA pooled serum 3.39 2.1 2.9 0.9 3.7
AFP level 1 4.70 2.9 2.9 3.4 5.4
AFP level 2 22.53 3.0 3.4 2.1 5.0
AFP level 3 100.07 4.1 2.9 2.3 5.5
AFP pooled serum 88.91 2.5 4.1 0.0 4.3
CA 15-3 level 1 5.02 3.5 2.2 2.5 4.9
CA 15-3 level 2 20.00 2.9 2.7 1.6 4.2
CA 15-3 level 3 33.38 3.1 3.1 0.0 4.4
CA 15-3 pooled serum 8.49 3.9 1.9 0.3 4.3
CA 125 level 1 15.60 2.5 2.6 0.0 3.6
CA 125 level 2 34.00 2.8 0.5 0.0 2.8
CA 125 level 3 117.72 1.7 1.6 1.8 3.0
CA 125 pooled serum 23.48 2.7 1.0 1.2 3.1
CA 19-9 level 1 8.53 2.8 1.4 3.1 4.4
CA 19-9 level 2 32.33 1.9 2.7 2.2 3.9
CA 19-9 level 3 146.71 1.8 2.7 1.7 3.7
CA 19-9 pooled serum 14.85 2.5 2.3 2.3 4.1
[image:3.595.70.542.435.709.2]Comparison between the assays
Comparison of the assays performed by DxI and Centaur or ECi demonstrated varying agreement, with slopes ranging from 0.507 to 1.118, intercepts ranging from -1.689 to 1.512, and correlation coefficients (r) ranging from 0.806 to 0.995 (Table 2). The results from the CEA measured by DxI showed the highest degree of agreement with those mea-sured by Centaur (slope=0.910, r=0.995). CA 15-3 levels were poorly agreed upon between DxI and ECi, with a slope of 0.507 and correlation coefficients of 0.806. The re-sults of the samples for all five assays were classified as normal or elevated, and the analytic concordance for each 633.45 to 5.55 kU/L for CA 15-3, from 1752.53 to 7.68 kU/L
for CA 125, and from 1389.73 to 0.80 kU/L for CA 19-9. The results from DxI showed excellent linear responses in measuring the concentrations of the five tumor markers (Fig. 1). The linear fits for all five tumor markers tested were ac-cepted statistically at the level of p<0.05 (where x is expect-ed values and y is observexpect-ed means, y=1.017x-15.855, R2=0.9991, F=4648 for AFP; y=1.001x+6.289, R2=0.9997, F=15846 for CEA; y=1.000x+5.342, R2=0.9994, F=6445 for CA 125; y=1.022x-0.080, R2=0.9983, F=2285 for CA 15-3; y=1.015x-8.488, R2=0.9995, F=7459 for CA 19-9;
[image:4.595.53.520.258.555.2]p<0.001 for all).
Fig. 1. Linearity of the five tumor marker assays performed by UniCelTM DxI 800. The observed mean tumor marker levels showed excellent linear responses
to the expected values (p<0.001). (A) The linearity range of the CEA assay was from 0.80 to 951.41 μg/L (R2=0.9997). (B) The AFP assay was linear in the range
between 1.86 and 2092.91 μg/L (R2=0.9991). (C) The CA 15-3 assay showed linear responses to the expected concentrations in the range of 5.55 to 633.45 kU/L
(R2=0.9983). (D) The CA 125 assay was verified to be linear at the concentrations between 7.68 and 1752.53 kU/L (R2=0.9994). (E) Linearity of the CA 19-9 assay
was validated in the range of 0.80 to 1389.73 kU/L (R2=0.9995). CEA, carcinoembryonic antigen; AFP, alpha-fetoprotein; CA, carbohydrate antigen.
Table 2. Parameters of Passing and Bablok Regression between UniCelTM DxI 800 and the Other Systems
Markers* Comparative system Slope (95% CI) Intercept (95% CI)* Correlation coefficient (r) CEA Advia CentaurTM 0.910 (0.883 to 0.947) -0.240 (-0.362 to -0.171) 0.995
AFP Advia CentaurTM 0.766 (0.745 to 0.780) -0.624 (-0.784 to -0.493) 0.994
CA 15-3 VitrosTM ECi 0.507 (0.474 to 0.545) 1.052 (0.591 to 1.458) 0.806
CA 125 Advia CentaurTM 1.118 (1.091 to 1.164) -1.689 (-2.394 to -1.331) 0.986
CA 19-9 VitrosTM ECi 0.606 (0.569 to 0.645) 1.512 (0.930 to 2.093) 0.971
CI, confidence interval; CEA, carcinoembryonic antigen; AFP, alpha-fetoprotein; CA, carbohydrate antigen. *Units are µg/L for CEA and AFP, and kU/L for CA 15-3, CA 125, and CA 19-9.
0 0 0 0 0 200 500 500 200 200 400 1000 1000 600 400 400 600 1500 1500 1000 800 600 800 2000 1400 1200 800 1000 2000 2500 1600 CE A (µ g/ L) o bs er ve d m ea n CA 12 5 ( kU /L ) o bs er ve d m ea n AF P (µ g/ L) o bs er ve d m ea n CA 19 -9 (k U/ L) o bs er ve d m ea n CA 15 -3 (k U/ L) o bs er ve d m ea n 0 0 0 0 0 200 500 500 200 200 400 1000 1000 400 400 600 1500 1500 600 600 800 2000
800 1000 12001400
800 1000 2000 2500 1600 y=1.001x -6.289
R2=0.9997
p<0.0001
y=1.000x5.342 R2=0.9994
p<0.0001
y=1.017x -15.855 R2=0.9991
p<0.0001
y=1.015x -8.488 R2=0.9995
p<0.0001
y=1.022x -0.080 R2=0.9983
p<0.0001
CEA (µg/L) - expected value
CA 125 (kU/L) - expected value
AFP (µg/L) - expected value
CA 19-9 (kU/L) - expected value
CA 15-3 (kU/L) - expected value
A
D
B
E
[image:4.595.55.530.631.710.2]tice, tumor markers are useful in evaluating the progression of disease status after surgical or cytotoxic therapies have been undertaken and in monitoring subsequent treatment modalities.1-7,20 Therefore, precise and accurate assays for tumor markers are important in the management of patients with cancer.
In this study, we assessed the analytical performances of the UniCelTM DxI 800 Access Immunoassay System in mea-suring tumor marker concentrations. The results on the lin-earity and imprecision of the assays by DxI were highly ac-ceptable and in accordance with previous reports.12,14-16,21-23 In addition, we compared the results from DxI for CEA, AFP, and CA 125 with those measured by Centaur, and for CA 15-3 and CA 19-9 with those measured by ECi, as our laboratory currently uses Centaur and ECi, which were in-tended to be replaced with DxI, for assaying these respec-tive tumor markers. The extensive differences between ana-lyzer systems, which are shown in Fig. 2, could be caused by different antibodies utilized by the assaying systems or by unique circumstances of the samples.2,12,24 In the case of CA 15-3, the respective assays utilize different CA 15-3 MAbs as the Ma552 antibody targeted epitope in the GVT-SAPDTRAPP region on the MUC1 glycoprotein core, and the DF3M antibody targeted epitope Ma695 on a carbohy-tumor marker was assessed using the cut-offs
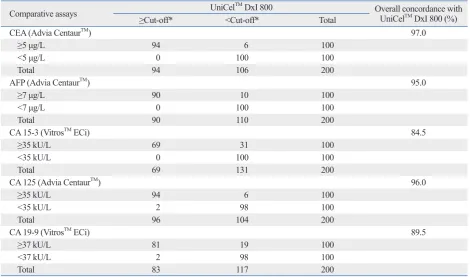
recommend-ed by the manufacturers (Table 3). The overall concordance rates between DxI and Centaur or ECi ranged from 84.5% to 97.0%.
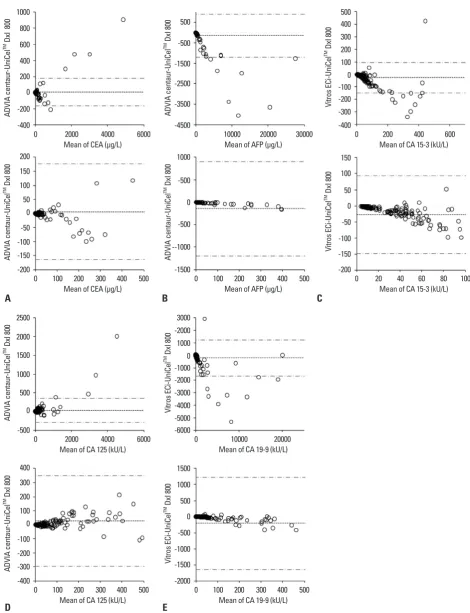
When the results for each marker were analyzed using difference plots (Fig. 2), CEA and CA 125 concentrations showed mean differences of 30 or less between DxI and Centaur, and CA 15-3 levels demonstrated a mean differ-ence of -27.59 kU/L between DxI and ECi. The results of CA 19-9 measured by ECi and AFP measured by Centaur exhibited large mean differences of -209.59 kU/L and -145.39 μg/L, respectively, from those measured by DxI.
DISCUSSION
For many malignancies, serum tumor markers play impor-tant roles in patient management. Tumor markers are the biochemical or immunological indicators of differentiating clinical status in patients with malignancies. Many well-known markers can be elevated in noncancerous conditions, and although the presence of tumor markers is not diagnos-tic of cancer, it is thought that blood levels of tumor markers reflect tumor activity and the size of a mass. In clinical
prac-Table 3. Analytic Concordance between UniCelTM DxI 800 and the Other Analyzers
Comparative assays UniCelTM DxI 800 Overall concordance with UniCelTM DxI 800 (%)
≥Cut-off* <Cut-off* Total
CEA (Advia CentaurTM) 97.0
≥5 μg/L 94 6 100
<5 μg/L 0 100 100
Total 94 106 200
AFP (Advia CentaurTM) 95.0
≥7 μg/L 90 10 100
<7 μg/L 0 100 100
Total 90 110 200
CA 15-3 (VitrosTM ECi) 84.5
≥35 kU/L 69 31 100
<35 kU/L 0 100 100
Total 69 131 200
CA 125 (Advia CentaurTM) 96.0
≥35 kU/L 94 6 100
<35 kU/L 2 98 100
Total 96 104 200
CA 19-9 (VitrosTM ECi) 89.5
≥37 kU/L 81 19 100
<37 kU/L 2 98 100
Total 83 117 200
[image:5.595.70.541.80.357.2]Fig. 2. Comparison of the results of five tumor markers measured by the UniCelTM DxI 800 with those measured by other instruments using Bland and Altman
difference plots. The solid line indicates the mean difference between the methods, and the dashed lines indicate the upper and lower 95% confidence lim-its of the difference between the methods. (A) The mean difference of CEA was 5.62 μg/L [95% confidence interval (CI), -6.53 to 17.77 μg/L]. (B) The mean dif-ference of AFP was -145.39 μg/L (95% CI, -220.47 to -70.32 μg/L). (C) The mean difdif-ference of CA 15-3 was -27.59 kU/L (95% CI, -36.24 to -18.94 kU/L). (D) The mean difference of CA 125 was 26.73 kU/L (95% CI, 3.72 to 49.74 kU/L). (E) The mean difference of CA 19-9 was -209.59 kU/L (95% CI, -312.58 to -106.60 kU/L). CEA, carcinoembryonic antigen; AFP, alpha-fetoprotein; CA, carbohydrate antigen.
A B C
D E -400 -500 -200 -400 -4500 -6000 -1500 -2000 -400 -200 200 1000 0 0 0 500 -50 -100 -2500 -3000 -2000 -500 -500 -100 0 -50 -200 -100 -200 0 -150 -300 -100 -200 -3500 -4000 -5000 --1000 -1000 -1500 -300 -150 400 50 100 -1500 0 -1000 0 0 100 0 600 1500 100 200 -500 -2000 1000 -500 500 1000 200 50 800 2000 150 300 500 3000 1000 1500 400 100 300 500 150 1000 2500 200 400 AD VI A ce nt au r-U ni Ce l
TM D
xI 8 00 AD VI A ce nt au r-U ni Ce l
TM D
xI 80 0 AD VI A ce nt au r-U ni Ce l
TM D
xI 80 0 AD VI A ce nt au r-U ni Ce l
TM D
xI 80 0 AD VI A ce nt au r-U ni Ce l
TM D
xI 80 0 Vi tro s E Ci -U ni Ce l
TM D
xI 80 0 AD VI A ce nt au r-U ni Ce l
TM D
xI 80 0 Vi tro s E Ci -U ni Ce l
TM D
xI 80 0 V itr os E Ci -U ni Ce l
TM D
xI 80 0 V itr os E Ci -U ni Ce l
TM D
xI 80 0 0 0 0 0 0 0 0 0 0 0 2000 2000 100 100 200 200 10000 10000 100 100 200 200 200 20 4000 4000 300 300 400 400 20000 20000 300 300 400 400 400 60 40 6000 6000 500 500 30000 500 500 600 80 100
Mean of CEA (µg/L)
Mean of CA 125 (kU/L) Mean of CEA (µg/L)
Mean of CA 125 (kU/L)
Mean of AFP (µg/L)
Mean of CA 19-9 (kU/L) Mean of AFP (µg/L)
Mean of CA 19-9 (kU/L)
Mean of CA 15-3 (kU/L)
veloped by different manufacturers, discrepant results main among analytical methods. These differences may re-sult from the application of different antibodies by different assays and suppliers. Additional efforts to standardize tu-mor marker assays are greatly necessitated, and the estab-lishment of reliable reference materials and methods are also needed. The substantial differences between methods also indicate that the redetermination of baselines and cut-off levels is necessary when replacing analyzers and meth-ods for measuring tumor marker assays.
REFERENCES
1. Burtis CA, Ashwood ER, Bruns DE. Tietz textbook of clinical chemistry and molecular diagnostics. 4th ed. St. Louis: Elsevier saunders; 2006.
2. Duffy MJ. Serum tumor markers in breast cancer: are they of clin-ical value? Clin Chem 2006;52:345-51.
3. Cheli CD, Morris DL, Neaman IE, Dai J, Allard WJ, Yeung KK. Measurement of four tumor marker antigens in the sera of preg-nant women. J Clin Lab Anal 1999;13:35-9.
4. Connor S, Bosonnet L, Alexakis N, Raraty M, Ghaneh P, Sutton R, et al. Serum CA19-9 measurement increases the effectiveness of staging laparoscopy in patients with suspected pancreatic malig-nancy. Dig Surg 2005;22:80-5.
5. Bendardaf R, Lamlum H, Pyrhönen S. Prognostic and predictive molecular markers in colorectal carcinoma. Anticancer Res 2004;24:2519-30.
6. Ishigami S, Natsugoe S, Nakashima H, Tokuda K, Nakajo A, Okumura H, et al. Biological aggressiveness of alpha-fetoprotein (AFP)-positive gastric cancer. Hepatogastroenterology 2006;53: 338-41.
7. Toyoda H, Kumada T, Kiriyama S, Sone Y, Tanikawa M, Hisana-ga Y, et al. Prognostic significance of simultaneous measurement of three tumor markers in patients with hepatocellular carcinoma. Clin Gastroenterol Hepatol 2006;4:111-7.
8. Delwiche R, Zamcheck N, Marcon N. Carcinoembryonic antigen in pancreatitis. Cancer 1973;31:328-30.
9. Loewenstein MS, Zamcheck N. Carcinoembryonic antigen (CEA) levels in benign gastrointestinal disease states. Cancer 1978;42(3 Suppl):1412-8.
10. Gebauer G, Müller-Ruchholtz W. Carcinoembryonic antigen and CA19-9: implications of quantitative marker measurement in tis-sues for prognosis of colorectal cancer. Cancer Detect Prev 2001; 25:344-51.
11. Dungchai W, Siangproh W, Lin JM, Chailapakul O, Lin S, Ying X. Development of a sensitive micro-magnetic chemiluminescence enzyme immunoassay for the determination of carcinoembryonic antigen. Anal Bioanal Chem 2007;387:1965-71.
12. Slev PR, Rawlins ML, Roberts WL. Performance characteristics of seven automated CA 15-3 assays. Am J Clin Pathol 2006;125: 752-7.
13. Crombach G, Zippel HH, Würz H. Clinical significance of cancer antigen 125 (CA 125) in ovarian cancer. Cancer Detect Prev 1985;8:135-9.
drate. Different antibodies recognize different parts of the molecule, and heterogeneity or conformational alteration of the antigens may explain inter-method differences, in part. Although the results of AFP and CA 19-9 measured by DxI and the other systems were well correlated according to their correlation coefficients, they showed relatively large mean differences (Fig. 2). Samples tested for these two markers were considered to have higher antigen levels than the other markers, and the mean differences between higher values were generally larger. Therefore, the large mean dif-ferences between the results of AFP and CA 19-9 measured by DxI and the other systems seem to be due to the high an-tigen levels of the samples tested in our study.
In addition, CA 15-3 and CA 19-9 measured by DxI and ECi in this study showed relatively lower concordance rates and correlation coefficients among the results between the two analyzers, and the results for CEA, AFP, and CA 125 measured by DxI were more comparable to those by Centaur. The concordance between assay systems can vary according to the evaluated tumor markers and researchers.12,15,16,21,22 Therefore, even though the results, on average, agreed fair-ly well across the assays, when replacing tumor marker as-says for clinical use, parallel tests by old and new methods are recommended to establish a new baseline in the man-agement of patients.
These days, the incidence and prevalence of tumors are increasing due to advances in the technology of cancer de-tection and longer average life expectancies. Accordingly, the number of specimens for tumor marker testing has in-creased, and in the case of our laboratory, more than 18000 tumor marker tests are performed monthly. Because of this assay workload, one instrument cannot sufficiently analyze all five tumor markers, presently, and we have adopted the use of more than four immunoassay analyzers in our lab, including those compared in this study. From sample aspi-ration to results, the incubation times are 20 minutes for AFP and CEA and 50 minutes for CA 125 with the Centaur system, and 45 minutes for CA 19-9 and 50 minutes for CA 15-3 with the ECi system on average. Compared with those two analyzers, DxI has similar incubation times as follows: 20 minutes for AFP and CEA, 45 minutes for CA 19-9, and 50 minutes in CA 125 and CA 15-3. However, quicker re-sults may be derived using the DxI system, which can ana-lyze all five tumor markers and load 120 samples at once.
de-19. Bland JM, Altman DG. Comparing methods of measurement: why plotting difference against standard method is misleading. Lancet 1995;346:1085-7.
20. Nicolini A, Carpi A, Michelassi C, Spinelli C, Conte M, Miccoli P, et al. “Tumour marker guided” salvage treatment prolongs surviv-al of breast cancer patients: finsurviv-al report of a 7-year study. Biomed Pharmacother 2003;57:452-9.
21. Mongia SK, Rawlins ML, Owen WE, Roberts WL. Performance characteristics of seven automated CA 125 assays. Am J Clin Pathol 2006;125:921-7.
22. Stern P, Friedecky B, Bartos V, Bezdickova D, Vavrova J, Uhrova J, et al. Comparison of different immunoassays for CA 19-9. Clin Chem Lab Med 2001;39:1278-82.
23. Ognibene A, Drake CJ, Jeng KY, Pascucci TE, Hsu S, Luceri F, et al. A new modular chemiluminescence immunoassay analyser evaluated. Clin Chem Lab Med 2000;38:251-60.
24. Liew M, Groll MC, Thompson JE, Call SL, Moser JE, Hoopes JD, et al. Validating a custom multiplex ELISA against individual commercial immunoassays using clinical samples. Biotechniques 2007;42:327-8, 330-3.
14. Yagmur E, Driesch R, Gressner AM, Kiefer P. Technical evalua-tion of the Beckman Coulter OV-Monitor (CA 125 antigen) im-munoassay. Clin Chem Lab Med 2006;44:420-2.
15. Deinzer M, Faissner R, Metzger T, Kaminski WE, Löhr M, Neu-maier M, et al. Comparison of two different methods for CA19-9 antigen determination. Clin Lab 2010;56:319-25.
16. Lee JH, Park Y, Suh B, Song SM, Kwon OH, Kim JH. Perfor-mance characteristics of the UniCel DxI 800 immunoassay for the maternal serum quadruple test, including median values for each week of gestation, in Korean women. Korean J Lab Med 2010;30: 126-32.
17. Passing H, Bablok. A new biometrical procedure for testing the equality of measurements from two different analytical methods. Application of linear regression procedures for method compari-son studies in clinical chemistry, Part I. J Clin Chem Clin Bio-chem 1983;21:709-20.