IMPACT OF POLITICAL EVENTS (INAUGURATION OF CABINET AND CABINET RESHUFFLES) ON INDUSTRIAL SECTORS IN
INDONESIA STOCK EXCHANGE
(Undergraduate Thesis)
By
ALBERT ANDIKA PRASETIA
FACULTY OF ECONOMICS AND BUSINESS UNIVERSITY OF LAMPUNG
ABSTRACT
IMPACT OF POLITICAL EVENTS (INAUGURATION OF CABINET AND CABINET RESHUFFLES) ON INDUSTRIAL SECTORS IN
INDONESIA STOCK EXCHANGE
By
ALBERT ANDIKA PRASETIA
The purpose of this research is to analyze Indonesian capital market’s reaction to cabinet formation and cabinet reshuffles, which is indicated by a change in abnormal return and trading volume activity. Event Study method was used to analyze the market reaction and Paired-Sample T-Test and Wilcoxon-Signed Rank Test to analyze abnormal returns and Trading Volume Activity differences before and after the events for 90 companies listed in Indonesia Stock Exchange selected using purposive sampling method. The overall results showed that three political events observed do not contain enough information to trigger market reactions. The only difference occurred only on Trade, Service and Investment during before and after cabinet reshuffle volume I (abnormal return) and cabinet reshuffle volume II (Trading Volume Activity).
ABSTRAK
Dampak Peristiwa-Persitwia Politik (Pelantikan Kabinet dan Reshuffle
Kabinet) pada Sektor Industri di Bursa Efek Indonesia
Oleh
ALBERT ANDIKA PRASETIA
Tujuan dari penelitian ini adalah untuk menganalisis reaksi pasar modal Indonesia terhadap penyusunan kabinet dan reshuffle kabinet, yang diindikasikan oleh perubahan pada abnormal return dan trading volume activity. Studi peristiwa digunakan untuk menganalisis reaksi pasar dan Paired Sample T-Test dan
Wilcoxon-Signed Rank Test digunakan untuk menguji perbedaan abnormal return
dan trading volume activity sebelum dan setelah peristiwa untuk 90 perusahaan yag terdaftar pada Bursa Efek Indonesia yang dipilih menggunakan purposive sampling. Secara keseluruhan, tiga peristiwa politik yang diamati tidak mengandung cukup informasi untuk memicu reaksi pasar. Perbedaan hanya terjadi pada sektor Perdagangan, Jasam dan Investasi saat sebelum dan setelah Reshuffle Kabinet jilid I (abnormal return) dan Reshuffle Kabinet jilid II (trading volume activity).
IMPACT OF POLITICAL EVENTS (INAUGURATION OF CABINET AND CABINET RESHUFFLES) ON INDUSTRIAL SECTORS IN
INDONESIA STOCK EXCHANGE
By
ALBERT ANDIKA PRASETIA
An Undergraduate Thesis
Submitted for partial fulfilment for the Bachelor Degree in Economics
in
ACCOUNTING DEPARTMENT
Faculty of Economics and Business, University of Lampung
FACULTY OF ECONOMICS AND BUSINESS UNIVERSITY OF LAMPUNG
AUTHOR BIOGRAPHY
Albert Andika Prasetia was born in Tegal on 24th April 1990 to Sagiman Aries Triady and Eka Purwaty. He spent a large portion of his early life in Tegal, where he received his education. He went to SMA Negeri 1 Slawi. After finishing high school in 2008, The author continued his education in Indonesian State College of Accountancy (Indonesian: Sekolah
Tinggi Akuntansi Negara—STAN) to pursue an Associate’s degree in order to be
eligible to work as a civil servant for Indonesian Ministry of Finance or other government financial oversight bodies.
Don’t. Postpone. Joy.
ACKNOWLEDGEMENTS
This thesis, titled “Impact of Political Events (Inauguration of Cabinet
and Cabinet Reshuffles) On Industrial Sectors in Indonesia Stock Exchange”, is submitted for partial fulfilment for the Bachelor Degree in Economics in the Accounting Department of Faculty of Business and Economics, University of Lampung. This would not have been possible without support from individuals and parties. The author would like to extend his sincerest gratitude to:
1. Prof Dr H. Satria Bangsawan, S.E., M.Si., the Dean of Faculty of Economics and Business, University of Lampung.
2. Dr Farichah, S.E., M.Si., Akt., the Head of Accounting Department of the Faculty of Economics and Business, University of Lampung.
3. Dr Fajar Gustiawaty Dewi, S.E., M.Si, Akt., author’s academic advisor. 4. Dr Susi Sarumpaet, S.E. MBA, Ph.D., Akt., and Ms Dewi Sukmasari, S.E.,
MSA, Akt., Supervisors of this thesis. Words cannot express my profound gratitude for your guidance, directions, and encouragements.
5. Prof Dr Lindrianasari, S.E., the Assessor of this thesis. I am immensely thankful for your guidance and constructive criticisms to improve this thesis.
7. My father, Sagiman Aries Triady; my mother, Eka Purwaty; and my sister, Whindy Ayu Rachmawaty. I would not have made it this far without your constant prayers and encouragements.
8. Ma dame du destine, Anandita Septyarini, who tirelessly whippped me out
of my laziness. You, of all people, know me this well and I love you for that.
9. My fellow Pro Evolution Soccer and Electronic Arts’ FIFA rivals; A. Permadi, Y. Gumilar, A.R. Tampubolon, M.S. Rozali, G. Kusuma, and R. Helmawan.. Without you guys, I could have finished this thesis sooner. 10.All colleagues from STAR BPKP Batch 2 University of Lampung,
especially R. Hakiki, A.R Saputra, M.B. Gurning, U. Kuncoro, W.A. Siahaan, J.A. Indrajaya, A. Rachman, A. Wijaya.
11.Our Lord Darth Vader, who always keep the peace among galaxies and maintain the balance of the Force.
12.All individuals and parties that contributed to the writing of this thesis. The author would also like to offer apologies for the limitations of this thesis, and invites constructive criticisms in order to maximize its benefits to the readers and to the society in general.
Bandar Lampung, 4 October 2017 Author,
CONTENTS
Page
ABSTRACT ... ii
APPROVAL SHEET ... vi
ADMISSION ... vii
STATEMENT OF ORIGINALITY ... viii
AUTHOR BIOGRAPHY ... ix
QUOTES ... xi
ACKNOWLEDGEMENTS ... xii
CONTENTS ... xv
LIST OF TABLES ... xviii
LIST OF FIGURES ... xix
LIST OF APPENDICES ... xx
I. INTRODUCTION ... 1
1.1. Background ... 1
1.2. Problem Statement ... 7
1.3. Purpose of Study ... 7
1.4. Significance of Study ... 7
1.5. Paradigm of Study ... 9
II. THEORETICAL BASE AND LITERATURE REVIEW ... 10
2.1. Theoretical Base ... 10
2.1.1 Signalling Theory ... 10
2.1.2 Efficient Market Hypothesis ... 10
2.1.3 Capital Market ... 12
2.1.4 Jakarta Stock Industrial Classification (JASICA) ... 13
2.1.6 Return ... 14
2.1.7 Actual Return ... 14
2.1.8 Expected Return ... 14
2.1.9 Abnormal Return ... 16
2.1.10 Trading Volume Activity ... 17
2.1.11 Event Study ... 18
2.2 Previous studies ... 19
2.3 Framework ... 22
2.3 Hypothesis ... 23
III. RESEARCH METHODOLOGY ... 28
3.1 Type of research ... 28
3.2 Variable Operational Definition ... 29
3.2.1 Actual Return ... 30
3.2.2 Expected Return ... 30
3.2.3 Abnormal Return ... 31
3.2.4 Trading Volume Activity ... 31
3.3 Population and sample ... 32
3.4 Data collection methods ... 33
3.5 Data analysis methods ... 33
IV. RESULTS ... 37
4.1 Study Object Description ... 38
4.2 Descriptive Statistics ... 39
4.3 Normality Test ... 45
4.4 One Sample T-Test ... 48
4.5 Paired Sample T-Test ... 51
4.6 Wilcoxon-Signed Rank Test ... 52
4.7 Hypothesis Test ... 53
4.7.1 First Hypothesis ... 53
4.7.2 Second Hypothesis ... 54
4.7.4 Fourth Hypothesis ... 56
4.7.5 Fifth Hypothesis ... 57
4.7.6 Sixth Hypothesis ... 58
4.6 Interpretations ... 59
V. CONCLUSION AND DISCUSSION ... 64
5.1 Conclusion ... 64
5.2 Limitations ... 66
5.2 Suggestions ... 67
LIST OF TABLES
Table ... Pages
3.1 Object of Events and Event Period ... 28
4.1 Study Samples Taken ... 37
4.2 Descriptive Statistics Test Result on Abnormal Return ... 38
4.3 Descriptive Statistics Test Result on TVA ... 41
4.4 Summary of One-Sample Kolmogorov-Smirnov on Average Abnormal Return ... 45
4.5 Summary of One-Sample Kolmogorov-Smirnov on Average TVA... 46
4.6 Summary of One-Sample T-Test on Average Abnormal Return ... 48
4.7 Summary of One-Sample T-Test on Average TVA ... 49
4.8 Summary of Paired-Sample T-Test on Average Abnormal Return ... 50
4.9 Summary of Paired-Sample T-Test on Average TVA ... 50
4.10 Summary of Wilcoxon-Signed Rank Test on Average TVA ... 51
4.11 Result of average Abnormal Return test using Paired-Sample T-Test in Inauguration of Cabinet ... 52
4.12 Result of average TVA test using Paired-Sample T-Test in Inauguration of Cabinet ... 53
4.13 Result of average Abnormal Return test using Paired-Sample T-Test in Cabinet Reshuffle volume I ... 54
4.14 Result of average TVA test using Paired-Sample T-Test and Wilcoxon-Signed Rank Test in Cabinet Reshuffle volume I ... 55
4.15 Result of average Abnormal Return test using Paired-Sample T-Test in Cabinet Reshuffle volume II ... 56
LIST OF FIGURES
LIST OF APPENDICES
Appendix:
1. Jakarta Stock Industrial Classification (JASICA) 2. Research Samples
3. Summary of Average Abnormal Return in Inauguration of Cabinet 4. Summary of Average Abnormal Return in Cabinet Reshuffle volume I 5. Summary of Average Abnormal Return in Cabinet Reshuffle volume II 6. Descriptive Statistics Test on Abnormal Return
7. Summary of Average Trading Volume Activity in Inauguration of Cabinet 8. Summary of Average Trading Volume Activity in Cabinet Reshuffle volume I 9. Summary of Average Trading Volume Activity in Cabinet Reshuffle volume
II
10.Descriptive Statistics Test on Trading Volume Activity 11.Kolmogorov-Smirnov Test on Abnormal Return
12.Kolmogorov-Smirnov Test on Trading Volume Activity 13.One-Sample T-Test on Abnormal Return
14.One-Sample T-Test on Trading Volume Activity 15.Paired-Sample T-Test on Abnormal Return
CHAPTER I INTRODUCTION
1.1. Background
Capital market as a place of stock trading is a facility that brings investors, as the parties who own the funds, and companies, as parties who need funds. Investors entrust their funds to the company with the expectation of getting rewarded. Companies, where investors entrust their funds, will get an increase in available funds to be used to support the company's operating activities without having to wait for the results of the company's operations. The tradeoffs between investors and companies are expected to have a positive impact on both sides.
Many factors determine the success of the capital market in Indonesia. Husnan (2008) in Pratama et al. (2014) states that the determinants of capital market success in Indonesia are determined by the availability of securities, demand for securities, legal and regulatory issues, the existence of institutions that regulate and supervise capital market activities, the existence of institutions that enable efficient transactions, and the economic and political conditions of a country.
2
capital market players will evaluate every announcement issued by the company or government policy, so that it will cause some changes in stock trading transactions, for example with changes in trading volume of stocks, changes in stock price, bid/ask spread, proportion of ownership, etc.
The capital market is not directly intervened by political events that occur, but the event itself is an information that will be absorbed by the capital market participants. The information is used by capital market participants to decide investment actions and expect for profit in the future.1 Such information will affect investors' decision making, and eventually the market will react to that information to achieve a new equilibrium.
Political events occurring within the country occur because of a change in the institutional structure of a country. Such changes may take the form of changes that have taken place in the legislative and executive institutions of the country. Changes in the executive institutions are more particularly so in the event of presidential elections, the assembly of the presidential cabinet, and the cabinet reshuffle. This study focuses on the inauguration of cabinet and cabinet reshuffle that occurred during the reign of President Jokowi.
The first political event that became the object of this study is the inauguration of the presidential cabinet. In October 27, 2014 the President of Republic of Indonesia, Jokowi, inaugurated the cabinet. This cabinet consists of 42 people, made of 34 ministers, 8 ministerial level officials, and 3 deputy ministers. Choosing the right person in the cabinet becomes something vital,
1
3
because as an extension of the president, ministers and institutional leaders will work as policy makers.
Another political event that took place during the reign of Jokowi was the reshuffle of Kabinet Kerja. There have been two reshuffles in the first two years of Jokowi's term. The first reshuffle occurred on August 12, 2015. In the first volume of Kabinet Kerja reshuffle, Jokowi replaced five ministers and one cabinet secretary. One, which is expected to affect the economy and capital market in Indonesia, is the replacement of the minister of economic coordinator. Darmin Nasution is appointed by President Jokowi to occupy that position, replacing Sofyan Djalil. Darmin Nasution, who once served as Governor of Bank Indonesia, is considered able to provide a better fit in order to achieve economic stability during as minister of economic.2
One year has passed since the first reshuffle, Jokowi made another cabinet change on July 27, 2016. In the second volume of reshuffle, Jokowi inaugurated nine new figures replacing the previous ministers. One of the highlights of the cabinet reshuffle was Sri Mulyani Indrawati's inauguration as Finance Minister who had previously served as the same position during the reign of President Susilo Bambang Yudhoyono (SBY) before resigning to become the Managing Director of the World Bank. In her post as minister of finance during the administration of SBY, Sri Mulyani is considered able to carry out the task well
2
“Darmin dan Chatib Layak Jadi Menteri Keuangan”. Tempo.
4
so that with her re-entry into the cabinet is expected to be able to provide fresh air on the economic situation in Indonesia .3
The three political events that occur will give effect to the Indonesian capital market. Study on the effect of an event on trading activity in capital market is done using event study. Event study is conducted to test the content of information of an event. If the event contains information, then market may react to it.
The market reaction is measured using an event study by observing the movement of stock prices in the capital market when an event occurs and examining whether there are any unusual returns received by investors as a result of the event. This unusual return is called abnormal return. If an event does not contain information then there will be no abnormal return as a result of reaction to an event (Jogianto, 2010).
The reactions that arise in the market are influenced by the level of market sensitivity itself in responding to information. Each industry sector has a different character from one to the other. This difference is the result of variations in the type of business, the size of the company, the amount of competition in the industry, as well as the benefits an industry has for the implementation of a government policy. This difference causes a variation in the reaction generated by a capital market sector to an event. Manurung and Kusumawati (2007) stated that
3
5
each industry sector with its own characteristics has its own sensitivity to macro change.
Many earlier studies have looked at abnormal returns and trading volume activities that provide an overview of market reaction in general and do not focus the reaction on each sector in the market. This study is intended to provide an overview of the reactions that occur within each sector. The division of each sector refers to the Jakarta Stock Industrial Classification (JASICA) index. These sectors are:
1. Agriculture; 2. Mining;
3. Basic Industry and Chemicals; 4. Miscellaneous Industry; 5. Consumer Goods Industry;
6. Property, Real Estate and Building Construction; 7. Infrastructure, Utility and Transportation;
8. Finance; and
9. Trade, Service and Investment.
6
Several studies on capital market reaction have been done using abnormal return parameters. The results obtained from several earlier studies are quite diverse. The study of Sihotang and Mekel (2015) who investigated the same event, the Presidential Election in 2014, showed no significant difference in abnormal returns between before and after the event. Similar results are also shown by Mahaputra and Purbawangsa (2015) who investigated the event of Legislative Election in 2014.
Different results were generated by study conducted by Femianita, Nasir, and Nurhaeni. The study of Femianita (2014) which investigated the oil price rise shows that there is abnormal return generated as a form of reaction to the event. Similar results were also provided from a study conducted by
Nurhaeni (2009) who examined the Legislative Election 2009. Nasir's (2014) study, which used 20 political events occurring in Pakistan in the period of 1999 to 2011, explained that only 7 out of 20 events investigated which resulted in the difference of abnormal return on before and after event date.
7
The inconsistency of the results given by earlier study indicates the need for more similar study. Based on the explanation and background above, the authors are interested in making study titled “Impact of Political Events
(Inauguration of Cabinet and Cabinet Reshuffles) on Industrial Sectors in
Indonesia Stock Exchange‖.
1.2. Problem Statement
Based on the background that has been described above, the formulation of the problem to be tested further in this study are:
1. Is there any abnormal return differences that occurred before and after the political events within the industrial sector of Indonesia Stock Exchange? 2. Is there any trading volume activity (TVA) differences that occurred
before and after the political events within the industrial sector of Indonesia Stock Exchange?
1.3. Purpose of Study
This research attempts to address the above questions; that is to say, this research aims to:
1. Find out whether there are differences in abnormal returns that occurred before and after the political events within the industrial sector of Indonesia Stock Exchange; and
8
1.4. Significance of Study
This study is expected to provide benefits to the parties directly or indirectly related to this study, including:
1. Theoretical significance
This study is conducted to contribute to science and business concerning capital market especially regarding market reaction to a political event that occured Practical significance
2. Practical Benefits a. For Investor
This study was conducted to provide additional information to investors related to the resulting abnormal return and trading volume activity as a reaction to a political event.
b. For the Community
This study was conducted to provide additional information to the community about how capital market reacts to a certain political event.
c. For Author
1) This study can be used as a medium for author in applying the theoretical knowledge that has been obtained during the lecture. 2) Enriched insights and knowledge about abnormal return and
9
d. For Further Study
The results of this study are expected to add references to further study in broad and in-depth relating to the measurement of capital market reaction to information contained in a political event
1.5. Paradigm of Study
CHAPTER II
THEORETICAL BASE AND LITERATURE REVIEW
2.1. Theoretical Base
2.1.1. Signalling Theory
Information is a key factor that investors use in making investment decisions. Information, published as an announcement, will give a signal to investors and will be used as an analytical tool in investment decision making (Jogiyanto, 2010). Information needed as a basis for decision-making has to be a complete, relevant and accurate information. Good information should be able to present an explanation or description of the past, present and future circumstances of a company. The market is expected to react when a positive information announced.
The information circulating that may influence investors' decision to invest does not have to be information published by the company. Non-economic information, as long as it is still related to the condition of the company or the market, will give a signal to investors that will influence their investment decision.
2.1.2. Efficient Market Hypothesis
11
Witt (1979) also assert that any new or surprising information will quickly penetrate into stock prices. Husnan (2008) states that an efficient capital market is a market where securities prices have reflected relevant information. It means, the more efficient the market, the faster the market reflects new information indicated by stock prices.
When a new information emerges, the market will seek a new equilibrium point. Jogianto (2010) states a new market equilibrium occurs in efficient markets where it has fully reflected all available information, including recently announced information. EMH assumes the market initially overreacts and will subsequently correct itself (Obi and Sil, 1996). This correction is made in order to find a new equilibrium after the announcement of new information. Based on this, investors will not be able to obtain abnormal return consistently because the market price will always adjust to reflect all available information.
Fama (1970) in Godfrey et al. (2010), based on the concept of efficiency and ideal conditions of efficient markets, classifies efficient market models into three form:
a. Weak Form Efficiency
The market has a weak efficiency if the stock prices at any particular time fully reflects the information contained in its sequences of past. This market form corresponds to Random Walk Theory.
12
The market has a semi-strong efficiency if the stock prices reflect all published information, in addition to past prices. This includes past price data, profit forecasts, and company financial reports.
c. Strong Form Efficiency
The market has a strong form efficiency if the stock prices reflect all available information, whether published or unpublished (private information).
2.1.3. Capital Market
Kasmir (2015) defines the capital market as the meeting place of sellers and buyers to conduct transactions to obtain capital. Nurhaeni (2009) defines the capital market as the market of a number of long-term financial instruments that can be traded in the form of debt and equity, whether issued by the government or private companies.
The capital market plays an important role in the economy, particularly in relation to the allocation of public funds. Na'im (1997) in Nurhaeni (2009) states that capital markets provide to those who have surplus funds in society (savers or investors) a higher levels of liquidity, and also allocate those who need funds (companies) to obtain the necessary funds In investment.
13
Indonesia Stock Exchange (IDX) is a place where the sale of securities in Indonesia. According to its website, IDX established since 1912 by the Dutch Government had experienced a trade vacuum in 1956 to 1977 because of political problems. The stock exchange was then reopened in 1977 by President Soeharto under the name of Jakarta Stock Exchange. In 2007, there was a merger between the Jakarta and Surabaya Stock Exchanges and named as the Indonesia Stock Exchange to date.
2.1.4. Jakarta Stock Industrial Classification (JASICA)
Jakarta Stock Industrial Classification (JASICA) is a classification system used to categorize shares of companies listed on the Indonesia Stock Exchange. The division of the industrial sector at JASICA is based on the Indonesian Business Classification published by the Central Bureau of Statistics (BPS) with reference to the International Standard Industrial Classification (ISIC). In detail, the business classification according to JASICA is presented in Appendix I. Business segmentation through JASICA serves a purpose:
a. To provide capital market participants with basic knowledge of companies listed on IDX;
b. To standardize the industrial classification to ease the comparison among companies listed on IDX; and
14
2.1.5. Jakarta Composite Index (JCI/IHSG)
Jakarta Composite Index (JCI/IHSG) is an index consisting of all shares listed in IDX. According to the IDX website, JCI was first introduced in 1983. JCI uses date base of August 10, 1982, with a base index value of 100, of which there are only 13 listed companies. JCI is often used in study because it includes all companies listed on IDX. This study also uses JCI as market index to determine market returns.
2.1.6. Return
Any investor who puts his funds into a company's stock expects a kind of reciprocity. Stock return is the level of profit enjoyed by investors on an investment that has been done (Ang, 1997). Stock Return can be an Actual Return, a return that has realized, or Expected Return, that is a return which has not happened yet but has been expected happened in the future. Actual return is measured using total return, relative return, cumulative return, and adjusted return.
2.1.7. Actual Return
Actual Return is a realized return. Actual return at a time (t) is calculated by subtracting the current stock price (t) by the previous period stock price (t-1) divided by the previous period's stock price (t-1). The calculation of actual return in this study using historical data of daily stock price.
2.1.8. Expected Return
15
investors in the future. Expected return is important for investors in making investment decisions. Brown and Warner (1985) in Jogiyanto (2005) explain that the expected return can be calculated using three models:
a. Mean-adjusted Model
The mean-adjusted model assumes that the expected return is constant. The expected return value equals the average actual return during the estimation period.
E[Ri,t]
=
∑
Explanation:
E[Ri,t] = Expected return of i stock in t period
Ri,j = Actual Return of i stock in j period (estimation period) T = Length of estimation period, t1 to t2
The estimation period usually takes time before the event period. The estimation period is used to determine the realized return under normal circumstances. The event period is estimated several days before to after the event date.
b. Market Model
16
Ri,j =
α
i + βi * RMj +ε
i,jExplanation:
Ri,j = Actual Return of i stock in j period (estimation period)
α
i = Intercept of i stockβi = Slope Coefisien, Beta of i stock
RMj = Market Index Return in j period (estimation period)
ε
i,j = Residual Error of i stock in j period (estimation period)c. Market-adjusted Model
The market-adjusted model assumes that the best way to estimate the return of a stock is by using the market's return index at that time. This model does not require estimation period as the expected return is assumed to be the equal to the market index return. This study, in the calculation of expected return, uses the Market-adjusted Model, so the author does not need to determine the estimation period.
E [Ri,j] = RM,i,t Explanation:
E [Ri,j] = Expected return of i stock in t period RM,i,t = Market Return of i stock in t period
2.1.9. Abnormal Return
17
Abnormal return can be generated due to economic events and non-economic events. Economic events that can cause abnormal return include stock split announcements and initial public offerings (IPOs). Non-economic events such as sociopolitical events occurring in society can also result in abnormal returns to part or all of the stock circulated in the market.
An event study is used to analyze the abnormal return generated as the impact of the occurrence of an event. Jogianto (2000) in Nurhaeni (2009) formulates abnormal return as the difference between Actual Return and Expected Return.
RTNI,t = Ri,t – E [Ri.t] Explanation:
RTNI,t = Abnormal return of i stock in t period Ri,t = Actual Return of i stock in t period E [Ri.t] = Expected Return of i stock in t period
2.1.10.Trading Volume Activity
18
Hanafi et al. (1997) in Istanti (2009) TVA can be defined as the comparison between the volume of shares traded with the number of outstanding shares at a certain period.
2.1.11.Event Study
Event study is a kind of study that can be used to observe capital market reaction to an event whose information is published as an announcement. Bodie, Kane and Marcus (2005) in Manurung et al. (2007) explains that event study describes a technique of empirical financial study that analyzes the impact of a particular event on a firm's stock price. MacKinley (1997) further describes event studies:
The usefulness of such a given fact that, given the rationality in the marketplace, the effect of an event will be reflected immediately in security price. Thus a measure of the event's economic impacts can be observed over a relatively short time period.
The market reacts when an announcement of information is received by the market or investor. The reaction is indicated by the change in the price of securities that is measured using abnormal return, so it can be said that the announcement that has information content will give abnormal return to the market and vice versa. The abnormal return earned by shareholders is measured to determine whether the market reacts to an announcement or event, economic or non-economic event.
19
1) to test the initial hypothesis that the market efficiently combines all available information and 2) to examine the impact of an event related to shareholder welfare.
Jogianto (2010) describes three main reasons for using the study event for study. First, event study is used to analyze the impact of an event on the value of the company. The value of a company is measured using only accounting profit. However, management often manipulates accounting earnings, so that real company value is difficult to determine. The second reason, because the event study measures the impact of an event on the stock price at the time the event occurred directly. The last reason, event study has the ease in terms of data collection. The required data are only daily stock price data and market indices as the event take place.
2.2. Previous studies
There are several earlier studyes which examined the capital market reaction to the non-economic events underlying this study:
20
return and average trading volume activity before and after the announcement of fuel price increase. This shows that the market reacts to the announcement of fuel price increases.
b. Mian Sajid Nasir (2014) who observed the relationship between political uncertainty and the Pakistani capital market from May 1999 to December 2011. The study was conducted by looking at the difference of abnormal return generated by 20 political events that lasted from 1999 to 2011. The event study was chosen as Study methods with five-day event window (t-2 to t+2). This study concludes only 7 out of 20 events show significant abnormal return differences before and after the event date..
c. Eva Maria Sihotang and Peggy Adeline Mekel (2015) conducted a study aiming to find out whether there is a significant difference in abnormal return and trading volume activity before and after the Presidential Election on 9 July 2014 at the Construction, Infrastructure and Utilities Company registered in IDX. The sampling technique used is saturated sampling, with a sample size of 21 firms. This study uses paired sample T-test. The results showed that there was no significant difference in the abnormal return before and after the Presidential Election. Whereas, significant differences in trading volume activity are indicated.
21
election event. The expectation return using the market model is adjusted. The analysis of paired samples t-test shows that there is no significant difference of abnormal return before and after event.
e. Nunung Nurhaeni (2009) conducted a study on differences in average abnormal return and trading volume activity on LQ-45 stock before and after the legislative elections in 2009. Event study used in this study where observations were made on average abnormal return and average Trading volume activity for 3 days before, event date, and 3 days after the election (t-3 to t + (t-3). Return of expectation is calculated by market-adjusted-model. The sample of study is stocks listed in LQ-45 index in Indonesia Stock Exchange. The results of this studyconclude: (1). Based on the statistical test of the average abnormal return of stock during the period of the event, there is a significant difference in average abnormal return before and after the event. (2). From the average TVA test results before and after the event, a significant difference to the average TVA was shown..
f. Indra Saputra (2016) examines the difference in average trading activity volumes before and after the 2014 presidential election. The Event Study was conducted on shares listed on the LQ-45 index on the Indonesia Stock Exchange meeting the sample selection criteria. The method of data analysis of this study using paired sample t-test method. This study concludes statistically that there is no difference in stock trading volume activity before and after the event.
22
abnormal return and trading volume activity to measure the existing reactions. The difference of this study lies in the observations made on the shares of each industry sector that are classified according to JASICA. It is expected that this study can give an idea of which market sector will show a significant reaction to the political events that occurred.
2.3. Framework
Political events that took place in Indonesia had an impact on the capital market in Indonesia. The influence can be reflected from the price of shares in the Indonesia Stock Exchange. Measurement of capital market reaction to an event can be reflected from several indicators and one of the indicators is by analyzing the absence of abnormal return around the time the event occurred. Trading volume activity is also an indicator that can be used for existing reactions. Each sector has its own sensitivity in reacting to events that occur, so it needs to be analyzed whichever sector directly reacts to the occurrence of an event.4
4 Manurung, Adler Haymans dan Cahyanti Ira Kusumawati. 2007. Pengaruh Peristiwa Politik
23
Figure 2.1 Framework
2.4. Hypothesis
Political changes occured in a country will affect investor behavior as a reaction to the change. If the change is believed to have a positive impact then more investors will be channeling their funds in the capital market. On the other hand, if the change is believed to be a more negative impact then investors will attract funds and choose to invest in other forms. This kind of behavior will have an impact as reflected in the irregular increase or decrease in the stock price and will result in an abnormal return.
Trading volume activity also experienced upheaval as a result of buying and selling actions conducted by investors with reference to information changes that occur. Sihotang and Mekel (2015) define TVA as one of the indicators used in technical analysis on stock price valuation and an instrument that can be used to see the capital market reaction to information through the movement of stock trading volume activity in the market. TVA has advantages compared with the
24
abnormal return, ie in terms of ease of calculation. TVA only compares the number of shares traded with the number of outstanding shares at a certain time.
The reaction can be measured by observing the changes of TVA and abnormal return occured before and after the event.
2.3.1 The formation of a Cabinet of new President
A change of structure, dismissing the old cabinet and appointing a new one, is a president's right. A president will change the composition of the cabinet with a new cabinet that he believes will boost performance in his tenure.
The change of cabinet arrangement, as an extension of a President's hand, will determine the success of a country's development. Ministers and institutional leaders are the roles that will be directly involved in the implementation of regulations and policies in accordance with the president's vision. The success rate of the president will be reflected in the performance of the ministers and leaders of the selected institutions.
Selection of figures that will fill the posts will affect the capital market. Selection of the right figure and is believed to provide many benefits investors will make investors react by buying stocks and vice versa. The reactions that occur can be reflected on TVA and stock prices, and ultimately result in abnormal returns. Based on these explanations the study hypotheses can be developed as follows:
Ha1: There are differences in abnormal returns generated before
25
Ha2: There are differences in Trading Volume Activity before and
after the inauguration of the Cabinet.
2.3.2 Change of structure of the Cabinet
Only a few successes can be achieved in one trial. The same thing applies to the cabinet structure in government. In the term of office of a president, usually, the change of cabinet arrangement is done up to two to three times. This change of structure is intended to accelerate the achievement of the president's vision. The President will replace ministers and heads of agencies whose performance is perceived as lacking and replace it with a new figure that is expected to perform well. During President Jokowi's administration, until 2016, there have been two cabinet changes:
a. Cabinet Reshuffle volume I
26
Ha3: There are differences in abnormal returns generated before
and after the Cabinet Reshuffle volume I.
Ha4: There are differences in Trading Volume Activity before and
after the Cabinet Reshuffle volume I.
b. Cabinet Reshuffle volume II
Three hundred and fifty days have passed since President Jokowi conducted Cabinet Reshuffle Volume I, the president still felt the need to improve the performance of his cabinet. On July 27, 2016, President Jokowi made a second cabinet reshuffle. This time, President Jokowi replace twelve ministers in his cabinet.
There are two things that should be observed in this reshuffle. First, the emergence of the name of Sri Mulyani Indrawati who is mandated to be Minister of Finance. Sri Mulyani had held the same position during the reign of President Susilo Bambang Yudhoyono before finally resigned to become Managing Director of World Bank. Regardless of the polemic at the end of her previous service, Sri Mulyani still regarded as a figure capable of carrying out the task well.
27
newly appointed minister is considered to have benefits for investors, they will react by buying shares, and vice versa.
The reaction that occurs in the capital market can be reflected from TVA and the resulting abnormal return. Based on these explanations, the hypotheses can be developed as follows:
Ha5: There are differences in abnormal returns generated before
and after the Cabinet Reshuffle volume II.
Ha6: There are differences in Trading Volume Activity before and
CHAPTER III
RESEARCH METHODOLOGY
3.1 Type of research
This study uses event study, a study technique that allows author to measure the impact of political events on the stock price of listed companies in the capital market. Author do not include other factors that can affect stock prices such as bank interest rates, government regulations and policies and other macro factors. This study uses a quantitative approach and then using statistical analysis to process the data.
29
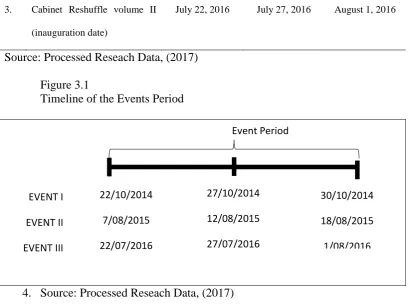
[image:46.595.113.519.177.351.2]not be affected by other events adjacent to the event period. Events and Period Events took by the author are presented in Table 3.1 and Figure 3.1 as follows:
Table 3.1
Object of Events and Events Period
No Event Event Period
T-3 T0 T+3
1. Inauguration of the Cabinet October 22, 2014 October 27, 2014 October 30, 2014
2. Cabinet Reshuffle volume I
(inauguration date)
August 7, 2015 August 12, 2015 August 18, 2015
3. Cabinet Reshuffle volume II
(inauguration date)
July 22, 2016 July 27, 2016 August 1, 2016
Source: Processed Reseach Data, (2017) Figure 3.1
Timeline of the Events Period
4. Source: Processed Reseach Data, (2017)
3.2 Variable Operational Definition
The following will explain the operational definition of variables to be used in study on the impact of political events on abnormal returns and trading volume activity on IDX. Identification of variables and operational definition of variables will be presented in detail as follows:
[image:46.595.109.520.294.600.2]30
3.2.1 Actual Return
Actual return is a realized return and is calculated based on historical data. Actual return on a stock (i) at a time (t) is calculated by subtracting the current stock price (t) by the previous period of stock price (t-1). Actual return is
formulated as follows (Hanafi et al., 2014):
Ri,t =
... (1)
Explanation:
Ri,t = Return of i stock in t period Pi,t = Price of i stock in t period Pi,t-1 = Price of i stock in t-1 period 3.2.2 Expected Return
Expected Return is the unrealized return and is expected to be realized in the future by the investor for the investment that has been done before. This study uses a market-adjusted model by assuming that the best way to estimate the return of a securities is to use a market return index. Using this model, this study does not require an estimation period because the expected return of a securities is considered equal to the market index return. Expected Return is calculated using the following formula (Jogianto, 2010):
E [Ri,j] = RM,i,t ... (2) Explanation:
E [Ri,j] = Expected return of i stock in t period
RM,i,t = Market Return of i stock in t period
This study uses the Jakarta Composite Index (JCI / IHSG) as the market index used to calculate market returns. The market return is calculated by
i,t i,t-1
31
subtracting the JCI in the period of the t-event with the JCI in the period of the t-1 event and divided by the JCI in the period of the t-1 event. The market return is formulated as follows (Jogianto, 2010):
RM,i,t =
... (3)
Explanation:
RM,i,t = Market Return of i stock in t period MIi,t = Market Index (JCI) in t period MIi,t-1 = Market Index (JCI) in t-1 period 3.2.3 Abnormal Return
Abnormal return as the return earned by investors outside the estimation of the expected return (Nurhaeni, 2009). Several factors can affect the resulting abnormal return. This study focuses only on one factor, political events, which will impact the stock price resulting in an abnormal return. Abnormal return is calculated by subtracting actual return with expected return. Abnormal return is formulated as follows (Jogianto, 2010):
ARI,t = Ri,t – E [Ri.t] ... (4) Dimana
ARI,t = Abnormal Return of i stock in t period Ri,t = Actual Return of i stock in t period E [Ri.t] = Expected Return of i stock in t period
3.2.4 Trading Volume Activity (TVA)
Nurhaeni (2009) states Trading Volume Activity is one of many instrument that can be used to analyze capital market reaction to information by taking a close look at the movement of stock trading volume activity in market.
i,t i,t-1
32
TVA is calculated by comparing the number of shares traded with the number of outstanding shares. TVA is formulated as follows (Hanafi, 1997):
TVAi,t =
∑ ∑
... .
(5)
3.3 Population and sample
The population in this study are all listed companies in Indonesia Stock Exchange (IDX). Purposive sampling is used by taking 10 stock samples from each sector, with some some criteria as follows:
a. All samples taken are stocks listed on the Indonesia Stock Exchange in the period of the event;
b. The samples taken have trading volume in the event period;
c. No Corporate Action takes place on samples taken during the event period; d. The samples taken are not announcing Warrant / Rights in the event period; e. No GMS (RUPS) takes place on samples taken during the event period; and f. No Public Exposure takes place on samples taken during the event period.
The purposive sample selection is intended to obtain samples that are not being affected by other events that may affect stock prices and stock trading volumes. The author does this with the assumption that if a stock is detached from such events, then the price and volume of trade are only influenced by the political events examined.
33
navigates to the event periods, taking note all stocks which conducting these activities during the event period and removing them from potential samples.
The study sample is divided into 9 Sectors according to Jakarta Stock Industrial Classification (JASICA). The stocks sampled in this study are presented in detail in Table 3.2 (Appendix II).
3.4 Data collection methods
This study uses one kind of data that is secondary data. Secondary data is primary data that has been further processed and presented either by the collector of primary data or by other parties and presented among others in the form of tables or diagrams (Umar, 2002). Data collecting uses documentation method that is collecting secondary data in daily stock price, daily trading volume and JCI through official website of Indonesia Stock Exchange (www.idx.co.id) and Yahoo Finance (finance.yahoo.co.id). The collected data must meet the sample criteria. Filtering is done by referring to the stock calendar which can be found on the website www.ipotnews.com.
3.5 Data analysis methods
In analyzing the study data and testing the hypothesis using descriptive statistics, normality test, and T-Test is done with the help of Statistical Product and Service Solution (SPSS) program. Each of the analytical techniques related to the intended use, steps, and interpretation of the results will be described in the next section below.
34
Descriptive statistics are statistics used to analyze data by describing or delineating collected data as they are without intending to make conclusions that apply to the public or generalizations. In this study, descriptive statistics are needed to know the description of a data seen from the mean, median, standard deviation, the maximum value of abnormal return movement and the volume of stock trading during the study period.
3.5.2 Normality Test
Normality tests are needed to determine whether the population data is normally distributed or not. If the sample being tested has a normal distribution, further analysis using parametric methods. If it does not have a normal distribution, the next analysis uses a non-parametric method. Normality test in this study using Kolmogorov-Smirnov test with the help of SPSS program using a significance level of 0.05. Determination of data normality is described further as follows:
a. If the probability shown (Sig) <0,005 then the data is not normally distributed;
b. If the probability shown (Sig) >0,005 then the data is normally distributed. 3.5.3 One Sample T-Test
35
a. If the probability shown (Sig) <0,005 then there is significant reactions occurred;
b. If the probability shown (Sig) >0,005 then there is no significant reaction occurred.
3.5.4 Hypothesis test
Hypothesis test in this study is determined by normality test results, based on it can be determined the appropriate test equipment for hypothesis testing. If the data is normally distributed, hypothesis test is done by parametric method, that is using Paired Sample T-Test. Meanwhile, if the data is not proven to be normal, then the hypothesis test is done by parametric method, that is using Wilcoxon Signed Rank Test test.
a. Paired Sample T-Test
Paired Sample T-Test is a method that can be used to test the difference between two paired samples. Paired samples have the same subject but are subjected to different treatments in situations before and after the occurrence of a process or event. Paired Sample T-Test requires the tested data to have a normal distribution. Decision-making accepts or rejects the hypothesis reflected by test results performed with a significance level of 5% or 0.05. If the probability shown (Sig) is less than 0.05 then Ho is rejected and Ha is accepted. If the probability shown (Sig) is more than 0.05 then Ho is accepted and Ha is rejected.
b. Wilcoxon Signed Rank Test
36
CHAPTER V
CONCLUSION AND SUGGESTION
5.1 Conclusion
Overall, the Indonesian Capital Market did not react to political events that occurred as there are no signifcant changes in almost every sectors in the Indonesia Capital Market related to these events. This indicates that the change of cabinet is not seen as an event that can affect the company owned by investors.
The only significant difference is only shown by Trade, Service, and Investment. This is related to the selection of figures who are considered to be able to give positive changes to the sector. The selection of the right figure, who has had a good reputation in investment, gives investors expectation for developments in the sector so that it is believed will have a positive impact on the company that they has in the future. This expectation is believed to bring a reaction to the sector.
This is supported by the results of Paired-Sample T-Test and Wilcoxon-Signed Rank Test of these variables as follows:
65
Based on the statistical test of the average abnormal return it is found that there is no significant difference of average abnormal return on all sectors of Indonesian Capital Market industry during the period before and after the inauguration of the cabinet.
2. The Indonesian capital market does not react to the inauguration of the cabinet in terms of TVA.
Based on statistical tests of the average TVA it was found that there was no significant difference in TVA in all sectors of the Indonesian Capital Market industry during the period before and after the cabinet's inauguration.
3. Trade, Service, and Investment reacts to the cabinet reshuffle volume I in terms of abnormal return.
Based on the statistical test on the average abnormal return it is found that the significant difference of abnormal return on before and after cabinet reshuffle volume I is only found in Trade, Service, and Investment. Thus, it can be concluded that the sector reacts to the cabinet reshuffle volume I. As for other sectors, there is no similar reaction shown.
4. The Indonesian capital market does not react to the cabinet reshuffle volume I in terms of TVA.
Based on the statistical test of the average TVA it is found that there is no significant difference in TVA in all sectors of Indonesian Capital Market industry during the period before and after cabinet reshuffle volume I. 5. The Indonesian capital market does not react to the cabinet reshuffle
66
Based on the statistical test of the average abnormal return it is found that there is no significant difference of average abnormal return on all sectors of Indonesia Capital Market industry during the period before and after cabinet reshuffle volume II.
6. Trade, Service, and Investment reacts to the cabinet reshuffle volume I in terms of TVA.
Based on the statistical test on the average abnormal return it is found that the significant difference of TVA on before and after cabinet reshuffle volume II is only found in Trade, Service, and Investment. Thus, it can be concluded that the sector reacts to the cabinet reshuffle volume II. As for other sectors, there is no similar reaction shown.
7. Overall, the Indonesian Capital Market did not react to political events that occurred.
The results of this study indicate that the political events that occurred (the inauguration of President Jokowi, the inauguration of the cabinet, and cabinet reshuffle volume I and II) did not affect changes in the Indonesia Capital Market. This is reflected from the difference in average abnormal returns generated between before and after the events only in, at most, one of nine sectors. In terms of TVA the similar result is shown.
Some things can lead to the absence of market reactions that occur: information leakage, lack of information contained in the event, and investor conservatism
5.2 Limitations
67
1. The sample of this study is still relatively small. This study takes only 90 stocks from a total of 539 stocks listed on the Indonesia Stock Exchange. 2. The abnormal return calculation uses a market adjusted model, where the
expected return on the observation period in each industry sector is assumed to be the same as the market return (Jakarta Composite Index, JCI) during the period of observation.
The variables used to measure capital market reaction are only two, Abnormal Return and Trading Volume Activity
5.3 Suggestions
Based on the limitations of the study that has been disclosed before it can be given some suggestions as follows:
1. In taking investment actions when a political event takes place, investors should more carefully consider which sectors will experience changes in reaction to the event because not all sectors in the Indonesian capital market react to it.
2. Further study can add more study samples so that the results will be better and accurate in explaining the reaction that occurs in each industry sector in Indonesia Stock Exchange.
3. Further study is expected to use the mean-adjusted model or market model so that the consistency of the results of this study can be seen.
BIBLIOGRAPHY
Ang, Robert. 1997. Buku Pintar Pasar Modal Indonesia. Jakarta: Media Staff Indonesia.
Audriene, Dinda and Safyra Primadhyta. ―Sri Mulyani dan Harapan 'Angin Segar'
Ekonomi‖. CNN Indonesia.
https://www.cnnindonesia.com/ekonomi/20160727135037-78-147379/sri-mulyani-dan-harapan-angin-segar-ekonomi/ . Accessed in August 31,2017 Binder, John J. 1998. The Event Study Methodology Since 1969. Review of
Quantitative Finance and Accounting. Vol. 11 No. 1
Bodie, Zvi; Alex Kane and Alan J Marcus. 2005. Investment. 6th Edition. New York: McGraw-Hill
Brown, Stephen dan Jerold B. Warner.1985. Using daily stock returns: The case of event studies. Journal of Financial Economics. vol.14, No.1
Bursa Efek Indonesia. 2016. IDX FactBook
―Darmin dan Chatib Layak Jadi Menteri Keuangan‖. Tempo. https://m.tempo.co/read/news/2013/03/27/087469670/darmin-dan-chatib-layak-jadi-menteri-keuangan . Accessed in August 31, 2017
Dobbins, Richard and Stephen F. Witt, 1979. Some Implications of the Efficient Market Hypothesis. Managerial Finance. Vol. 5, No. 1
Fama, Eugene. 1970. Efficient Capital Markets – A Review of Theory and Empirical Work. Journal of Finance. Vol. 25, No. 2
Femianita, Riskhy Tia and Nadia Asandimitra. 2014. Reaksi Pasar Sebelum Dan Sesudah Kenaikan Harga BBM Pada Perusahaan Yang Listing di Bursa Efek Indonesia (BEI). Jurnal Ilmu Manajemen. Vol. 2, No. 3
Finance.yahoo.co.id
Godfrey, Jayne; Allan Hodgson; Ann Tarca; Jane Hamilton and Scott Holmes. 2010. Accounting Theory. 7th Edition. New York: John Wiley & Sons, Inc. Harahap, Sofyan Syafri. 2013. Analisis Kritis atas Laporan Keuangan. 11th
Edition. Jakarta: Rajawali Pers
69
Hanafi, Mamduh., 1997. Informasi Laporan Keuangan: Studi Kasus Pada Emiten BEJ. Kelola. Vol. VI, No.16
Husnan, Suad. 2008. Manajemen Keuangan: Teori dan Penerapan. Book 1. 4th Edition. Yogyakarta: BPFE
Istanti, Lulu Nurul. 2009. Pengaruh Harga Saham, Trading Volume Activity dan Risiko Saham Terhadap Bid-Ask Spread (Studi pada Perusahaan LQ-45 di Bursa Efek Jakarta). Modernisasi. Vol.5, No. 3
Jogianto, Hartono. 2010. Teori Portofolio dan Analisis Investasi. 7th Edition. Yogyakarta: BPFE-UGM
Jogianto, Hartono. 2000. Teori Portofolio dan Analisis Investasi. 2nd Edition. Yogyakarta: BPFE-UGM
Kasmir. 2015. Bank dan Lembaga Keuangan Lainnya. 16th Edition. Jakarta: Rajawali Pers
MacKinlay, A. Craig. 1997. Event Studies in Economic and Finance. Journal of Economic Literature. Vol 35, No. 1
Mahaputra, I Made Dwi and Ida Bagus Anom Purbawangsa. 2015. Pengaruh Peristiwa Pemilu Legislatif 2014 Terhadap Perolehan Abnormal Return Saham LQ-45 Di Bursa Efek Indonesia. Jurnal Manajemen Universitas Udayana. Vol. 4, No. 5
Manurung, Adler Haymans and Cahyanti Ira Kusumawati. 2007. Pengaruh Peristiwa Politik (Pengumuman Hasil Pemilu Legislatif, Pengumuman Hasil Pemilihan Presiden, Pengumuman Susunan Kabinet, Reshuffle Kabinet) Terhadap Sektor-Sektor Industri Di Bursa Efek Jakarta. Jurnal Bisnis dan Manajemen. Vol 7, No.2
Miftahudin, Husen. ―Sepak Terjang Thomas Trikasih Lembong dari Mendag Jadi
Kepala BKPM‖. MetroTV News.
http://ekonomi.metrotvnews.com/read/2016/07/27/560951/sepak-terjang-thomas-trikasih-lembong-dari-mendag-jadi-kepala-bkpm. Accessed in August 31, 2017
Na’im, Ainun. 1997. Peran Pasar Modal Dalam Pembangunan Ekonomi Indonesia. Kelola. Vol. 4, No.14
70
Nurhaeni, Nunung. 2009. Thesis. Dampak Pemilihan Umum Legislatif Tahun 2009 Terhadap Abnormal Return dan Aktivitas Volume Perdagangan Saham BEI (Uji Kasus pada Saham yang Terdaftar pada Kelompok Perusahaan LQ45)
Obi, C. Pat and Shomir Sil. 1996. Efficient Market Hypothesis and the Contrarian Trading Paradox. Management Research News. Vol. 19, No. 11
Pratama, I Gede Bhakti; Ni Kadek Sinarwati; and Nyoman Ari Surya Dharmawan. 2014. Reaksi Pasar Modal Indonesia Terhadap Peristiwa Politik (Event Study pada Peristiwa Pelantikan Joko Widodo Sebagai Presiden Republik Indonesia Ke-7). Jurnal Universitas Pendidikan Ganesha. Vol.3, No.1
Republik Indonesia. 1995. Undang-Undang No. 8 Tahun 1995 Tentang Pasar Modal. Lembaran Negara Nomor 64. Tambahan Lembaran Negara RI Nomor 3608
Saputra, Indra. 2016. Analisis Perbedaan Rata-Rata Trading Volume Activity Saham Sebelum Dan Sesudah Pemilu Presiden Dan Wakil Presiden Tahun 2014 (Event Study Pada Saham Lq-45 Di Bursa Efek Indonesia Periode 29 Juni - 19 Juli 2014). Jurnal Ekonomi dan Bisnis. Vol. 9, No. 1
Sihotang, Eva Maria and Peggy Adeline Mekel. 2015. Reaksi Pasar Modal Terhadap Pemilihan Umum Presiden Tanggal 9 Juli 2014 Di Indonesia. Jurnal Ekonomi, Manajemen, Bisnis, dan Akuntansi. Vol 3, No. 1
―Tinggalkan 'Suite' Eksekutif, Thomas Lembong Jadi Menteri Perdagangan RI‖. VOA Indonesia. https://www.voaindonesia.com/a/menteri-perdagangan-ri-yang-baru-tinggalkan-suite-eksekutif/2916101.html . Accessed in August 31, 2017
Umar, Husein. 2002. Metode Penelitian dan Aplikasi dalam Pemasaran. Jakarta: PT Gramedia Pustaka Utama
www.idx.co.id/id-id/beranda/tentangbei/sejarah.aspx. Accessed in May 14, 2017 www.idx.co.id/Portals/0/StaticData/Publication/FactBook/FileDownload/2016102
5_FB-2016.pdf. Accessed in May 14, 2017 www.ipotnews.com