Application of Linear Programming in Modeling the
Allocation of Buses to Routes in a Transport
Service Authority
Ngutor Nyor
1,*, Omolehin J.O.
2, Rauf K.
31Department of Mathematics/Statistics, Federal University of Technology Minna, Minna, Nigeria 2Department of Mathematics, Federal University Lokoja, Kogi State, Nigeria
3Department of Mathematics, University of Ilorin, Ilorin, Nigeria
*Corresponding Author: [email protected]
Copyright © 2014 Horizon Research Publishing All rights reserved.
Abstract
The objective of the study was to allocate the available buses of the transport authority to the authority’s service intra and inter states routes in a manner that will yield optimum profit, taking all the constraints into consideration. The problem was modeled using Linear Programming (LP) and the TORA - computer software result yielded a maximum objective value of N897, 214 per day after 20 iterations, which is a better result compared to the current intuitive schedule by the authority that yields N766, 046 per day.Keywords
NSTA, TORA, Linear Programming,Transport Service, Bus(Es), Route(S), Objective Value
1. Introduction
Niger State Transport Authority (NSTA) is a state-own transport service operator in Minner, Niger state, Nigeria with the following seven commuting services
i. Inter State services ii. Intra State services
iii. City service within Minna municipal, Bida and Kontagora towns
iv. Towing, Haulage and Hire services to all parts of Nigeria
v. Ferry services from Rofia across to Zamare in Kebbi State and from Shiroro across to Lakpama, in Niger State
vi. Passenger Boat service from kofa to kabo in Suleja area council
vii. Civil servants and students Bus services within Minna municipal (NSTA, n.d)
However, this study was limited to the first two services – inter and intra state services due to interest and inadequate finance. These routes are as follows:
Inter States Routes
MINNA-ILORIN MINNA-LAGOS MINNA-KADUNA
MINNA-KANO MINNA-MAKURDI
MINNA-JOS MINNA-BAUCHI MINNA-SOKOTO MINNA-ZAMFARA
MINNA-KATSINA
Intra State Routes
MINNA-BIDA MINNA-MOKWA MINNA-NEW BUSA
MINNA-KTAGORA MINNA-KAGARA MINNA-WUSHISHI
MINNA-SULEJA MINNA-SERKI PAWA
MINNA-LAPAI MINNA-AGAI
2. Objective
The objective of the study was to apply linear programming model to optimally allocate the available buses of the Transport Authority to the service routes.
Niger State transport Authority (NSTA) operates ten intra and ten inter States routes transport service (see section 1.0). The authority has 80, fourteen sitter buses (Fifty Hiace and thirty King Long Buses); from which six of the Hiace buses are usually on stand-by for emergency hire purposes. Twenty-five of the buses are used for city service, Civil servants and students Bus services within Minna municipal, Bida and Kontogora towns of the state. Forty-Nine are used for commuting the intra and inter states routes. According to findings, daily, the buses incur costs in four ways: fuel, percentage parking levy, routine service and maintenance (repair). Buses going to New-Busa, Mokwa, Ilorin and Lagos incur thrice the cost of repair (maintenance) due to bad road. The authority might want to turn from intuition and consider mathematically, an optimized way of allocating buses to routes in order to obtain daily optimal gain though there are seasonal variations in terms of passenger patronage
during Christmas and Salla periods.
4. Brief History of NSTA
According to NSTA (n.d.), Niger State Transport Authority was established by the then Military Governor Col. Lawal Gwadabe on the 11th August, 1988 under edict No. 11
of 1988 enacted by the State Government. A task force was immediately constituted, headed by a military administrator to oversee the affairs of the organization. Since inception, as argued by NSTA (n.d), the authority has become a household name and has lived up to expectation been the only viable transport venture in the state and one of the best in the country vis-à-vis its contemporaries.
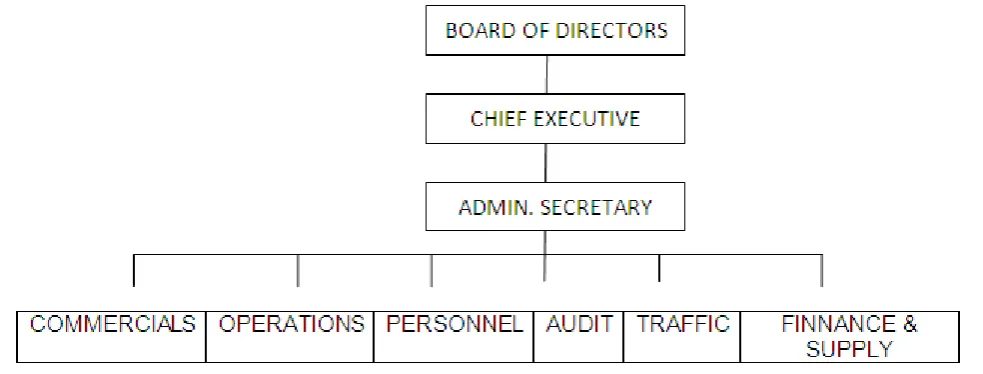
NSTA has the following organizational chart:
[image:2.595.62.554.293.480.2]The staff strength of NSTA currently stands at 206 under the Chief Executive/General Manager and Admin secretary being Alh. Umar Usman Nagogo and Alh. Ibrahim Barje Bawa respectively.
According to NSTA (n.d), Passengers are to note the following adherences:
i. The authority does not accept liability for loss of goods. Passengers are therefore advised to take good care of their goods/properties while waiting to board our vehicles and while on transit
ii. Preaching is strictly prohibited in our vehicles iii. The habit of smoking in our vehicles is strictly
prohibited
iv. You can only enter our vehicle when you have paid correct money and obtained a ticket for the journey v. Tickets should be in passengers’ possession until the
end of the journey
vi. Ticket can only be issued to prospective commuters when they maintain a single queue
vii. Heavy loads, bags and boxes are paid for and tickets obtained before they are loaded in our vehicles viii. Commuters are expected to present their tickets on
demand to our traffic inspectors during the course of the journey when asked to do so
ix. Intentional damage to our vehicle seats, glasses etc. will not be accepted
x. Female passengers are seated at the back of the vehicle while male are seated at the front
xi. Hawking of goods inside our vehicles is strictly prohibited
xii. Passengers are to help us so that we can serve them better
5. Brief Literature Review on Linear
Programming
Linear Programming (LP) is an optimal decision making tool in which the objective is a linear function and the constraints on the decision problem are linear equalities and/or inequalities. It is the most commonly applied form of constrained optimization. The four main elements of any constrained optimization are decision variables, objective function, constraints and variable bounds. In LP, all the mathematical expressions for the objective function and constraints are linear. One might imagine that the restriction to linear models severely limits the ability to model real-world problems; but this is not so. An amazing range of problems can be modeled using LP from airline scheduling to least cost petroleum processing and distribution (Chinneck, 2001; Ramsey, 2012)
The popular Simplex method of solving LP problems obtains the optimum solution by moving along edges of the solution space from one extreme point to another.
Linear programming problems have the property that the constraints and the objective function are all linear functions
of the input variables. The existence of a polynomial time algorithm for solving linear programs and the multitude of optimization problems that they can encode makes them particularly useful in practice.
Generally, linear programming problem can be stated as follows:
Maximize the objective function
Z = c1x1+ c2x2+ c3x3+…………..+ cnxn
Subject to the constraints
a11x1+a12x2+ ……….+ a1nxn1
a21x1+a22x2+………..+ a2nxn2
a31x1+ a32x2+………+ a3nxn3
. . . . . .
. . .
am1x1+ am2x2+………..+ amnxnm
x1≥0; x2≥ 0 ….. xn≥0
We can write the problem in abbreviated form called the standard form or canonical form as follows:
Minimize CTx
Subjectto Ax ≤b and x≥b
Here, x is a vector of real-valued variables (sometimes assumed to be non-negative), C and b are vectors of real constants, and A is a matrix of real constants.
5.1. Definition of LP Terms
1. Objective Function: The linear compilation of variables that must be minimized or maximized is called the objective function. It is a part of linear programming model that express what needs to be optimized depending on the objectives of the problem. 2. Decision Variables: They represent activity which is in competition with other variables for limited resources. 3. Constraints: These are different kinds of limitation to which the objective function is subjected. It is expressed in the form of linear inequalities or equalities depending on the sign used.
4. Slack Variables: They are the variables which are added to an inequality constraint to transform it to an equality constraints depending on the sign used. Slack variables cannot take on negative values.
5. Surplus Variables: They are variables which can be added to linear constraints. Consider inequality constraints of the sign “≥” i.e.
∑𝑛𝑛𝑖𝑖 =1𝑎𝑎𝑖𝑖𝑖𝑖 𝑥𝑥𝑖𝑖= 𝑏𝑏𝑖𝑖; I = 1,2,…,m
Solution: - Any set xj which satisfies the constraints on the linear programming problem.
7. Feasible Solution: A feasible solution to the linear programming problem is a vector.
8. Basic Feasible Solution: The basic feasible solution for a set of ‘m’ linear equation in n variable is the solution in which the value of all variables is non-negative i.e. a basic solution which satisfies the non-negativity condition
9. Optimal Solution: An optimal solution is a feasible solution which optimizes the objective function or any point in the feasible region which gives the optimum value.
10. Optimal Value: This is the minimum or maximum value of an objective function to be calculated in a linear programming problem.
11. Feasible Region: The set of all possible solution. 12. Feasible Solution: Any point within and on the
boundary of the feasible region are called feasible solution.
13. Non Degenerate Basic Feasible Solution: This is a basic feasible solution which has exactly m positive xi
i.e. all basic variables are positive.
14. An Augmented solution: Is a solution for a problem that was originally in inequality form that has been augmented by the corresponding values of the slack or surplus variables to change the problem into equality form (Hillier and Lieberman, 1986).
5.2. Advantages of LP
1. Linear programming helps in dealing with the problem of allocation of limited resources among different competitive activities in the most optimal manner.
2. It is concerned with determining the optimal allocation of scarce resources to meet certain objectives.
3. It provides practical and better quality of decision that reflects very precisely the limitations of the system. I.e. various restrictions under which the system must operate for the solution to be optimal.
4. Linear programming is an adaptive and flexible
mathematical technique and hence can be used in analyzing a variety of multi-dimensional problem quite successfully.
5. The minimization of a function is equal to the maximization of the negative of that same function. i.e.
Pmin= 0 = -Pmax
6. The techniques help to make the best possible use of available productive resources.
7. Linear programming is applicable to transportation problem, diet problem, product mix problems, investment planning problem, marketing and distribution management etc.
8. According to Adler et al (1995), linear programs are expressed in an inequality form, which allows for the inexact computation of the algorithms direction of improvement, resulting in a significant computational advantage.
5.3. Disadvantages of LP
1. Linear programming is applicable only to problem where the constraints and the objective functions are linear.
2. Factors such as uncertainty, weather conditions etc. are not taken into consideration.
3. There is restriction to linear objective function. 4. Reducing problems to a set of linear equation is
usually very difficult.
6. Raw Data Collected
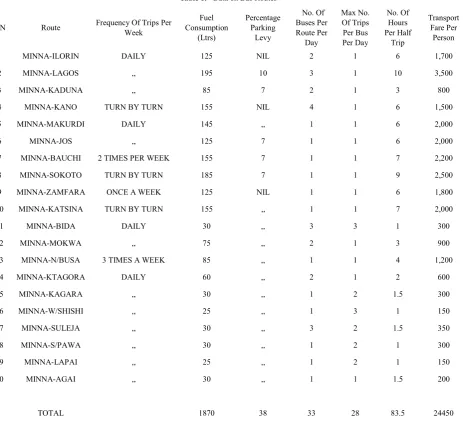
Table 1. Data on Bus Routes
S/N Route Frequency Of Trips Per Week Consumption Fuel (Ltrs)
Percentage Parking
Levy
No. Of Buses Per Route Per
Day
Max No. Of Trips Per Bus Per Day
No. Of Hours Per Half
Trip
Transport Fare Per
Person
1 MINNA-ILORIN DAILY 125 NIL 2 1 6 1,700
2 MINNA-LAGOS ,, 195 10 3 1 10 3,500
3 MINNA-KADUNA ,, 85 7 2 1 3 800
4 MINNA-KANO TURN BY TURN 155 NIL 4 1 6 1,500
5 MINNA-MAKURDI DAILY 145 ,, 1 1 6 2,000
6 MINNA-JOS ,, 125 7 1 1 6 2,000
7 MINNA-BAUCHI 2 TIMES PER WEEK 155 7 1 1 7 2,200
8 MINNA-SOKOTO TURN BY TURN 185 7 1 1 9 2,500
9 MINNA-ZAMFARA ONCE A WEEK 125 NIL 1 1 6 1,800
10 MINNA-KATSINA TURN BY TURN 155 ,, 1 1 7 2,000
11 MINNA-BIDA DAILY 30 ,, 3 3 1 300
12 MINNA-MOKWA ,, 75 ,, 2 1 3 900
13 MINNA-N/BUSA 3 TIMES A WEEK 85 ,, 1 1 4 1,200
14 MINNA-KTAGORA DAILY 60 ,, 2 1 2 600
15 MINNA-KAGARA ,, 30 ,, 1 2 1.5 300
16 MINNA-W/SHISHI ,, 25 ,, 1 3 1 150
17 MINNA-SULEJA ,, 30 ,, 3 2 1.5 350
18 MINNA-S/PAWA ,, 30 ,, 1 2 1 300
19 MINNA-LAPAI ,, 25 ,, 1 2 1 150
20 MINNA-AGAI ,, 30 ,, 1 1 1.5 200
TOTAL 1870 38 33 28 83.5 24450
Explaining Table 1:
Route: This column shows all the ten (10) inter and ten (10) intra States routes that NSTA buses ply.
Frequency of Trips per Week: This is the number of times a bus ply a particular route in a week. Note that, a trip means to and fro the destination. For example, Minna-Ilorin trip means the bus has gone from Minna to Ilorin and back. A bus that has gone from Minna to Ilorin only has made half trip. Fuel Consumption in Liters: This is the number of liters of fuel consumed by one bus per trip. The fuel is given to bus drivers for a whole trip fiscally.
Percentage Parking Levy: This is a levy paid by NSTA for parking space to authorities of garages in towns where NSTA does not have its own facility or staff. The levy is an agreed percentage of the bus capacity per night.
Number of Buses per Route per Day: This is the number of
buses that NSTA currently allocates to ply a particular route per day
Maximum Number of Trips per Bus per Day: This is the maximum number of times that a bus can possibly make a ‘to-and-fro’ journey in a day. For example, one bus can make two or more trips from Minna to Bida in a day. Note that, a bus that unavoidably makes only half trip from Minna to a destination, say Lagos, in a day is completed by another bus from that same destination (Lagos) back to Minna
Number of Hours per Half Trip: This is the number of hours a bus spends on the road under normal conditions from Minna.
Table 2. Data on Bus Service
S/N Required Service Items Amount (N)
1 Oil filter 500
2 5-litre Engine oil 2800
3 Oil treatment 400
Total 3700
Note: Buses in NSTA are serviced twice a month, which is after 15 days. Table 3. Data on Bus Repair/Maintenance
S/N Repair/Maintenance Items Cost (N) Duration it lasts
1 Tyre 25000 3 months
2 Front bearing 5000 6 months
3 Break disk 12000 2 years
4 Break pad 1000 2 weeks
5 Break lining 2400 1 month
6 Car battery 11000 2 years
7 Shocks filling 1000 4 months
8 Sparking plugs 4000 2 years
9 Fuel pump 5000 2 years
10 Release bearing 2000 2 years
Total 68400
Note: Buses going to New-Busa, Mokwa, Ilorin and Lagos incur thrice the cost of repair/maintenance due to bad road.
[image:6.595.185.424.190.370.2]7. Data Analysis
Table 4. Daily cost of Bus Service
S/N Required Service Items Per 15 Days (N) Amount Per month (N) Amount cost per bus (N) Daily service
1 Oil filter 500 1000 1000÷30=33.3
2 5-litre Engine oil 2800 5600 5600÷30=186.7
3 Oil treatment 400 800 800÷30=26.7
Total 3700 7400 ͌247
Note: Buses in NSTA are serviced twice a month, which is after 15 days. This means that a bus in NSTA consumes N7400 in a month (Amount per 15 Days × 2). Dividing service amount per month by 30 days gives us N247 as the cost of servicing a bus in a day.
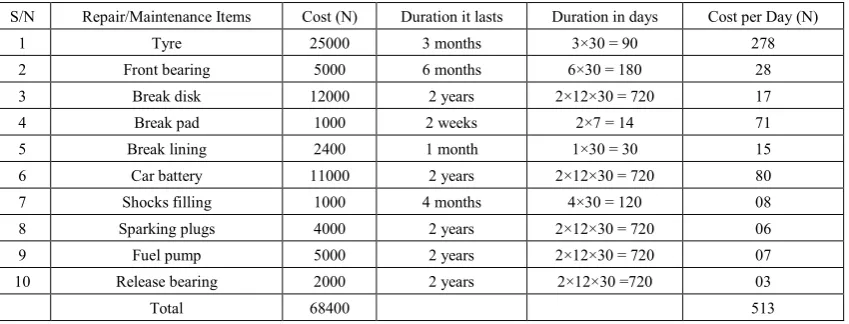
Table 5. Daily Cost of Bus Repair/Maintenance
S/N Repair/Maintenance Items Cost (N) Duration it lasts Duration in days Cost per Day (N)
1 Tyre 25000 3 months 3×30 = 90 278
2 Front bearing 5000 6 months 6×30 = 180 28
3 Break disk 12000 2 years 2×12×30 = 720 17
4 Break pad 1000 2 weeks 2×7 = 14 71
5 Break lining 2400 1 month 1×30 = 30 15
6 Car battery 11000 2 years 2×12×30 = 720 80
7 Shocks filling 1000 4 months 4×30 = 120 08
8 Sparking plugs 4000 2 years 2×12×30 = 720 06
9 Fuel pump 5000 2 years 2×12×30 = 720 07
10 Release bearing 2000 2 years 2×12×30 =720 03
Total 68400 513
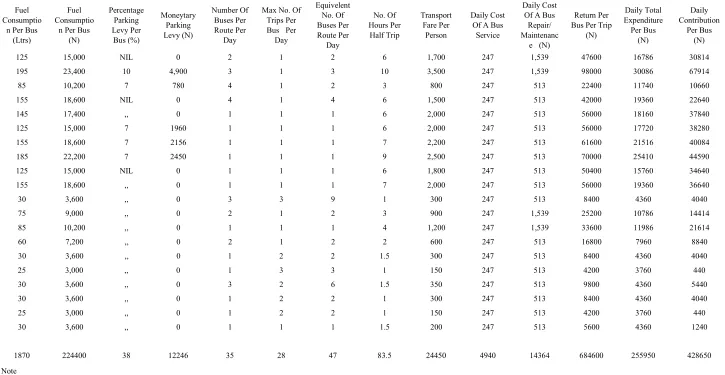
[image:6.595.95.520.574.736.2]Table 6. Daily Contribution per Bus
Fuel Consumptio
n Per Bus (Ltrs)
Fuel Consumptio
n Per Bus (N)
Percentage Parking Levy Per
Bus (%)
Moneytary Parking Levy (N)
Number Of Buses Per Route Per
Day
Max No. Of Trips Per Bus Per Day
Equivelent No. Of Buses Per Route Per
Day
No. Of Hours Per
Half Trip
Transport Fare Per
Person
Daily Cost Of A Bus
Service
Daily Cost Of A Bus
Repair/ Maintenanc
e (N)
Return Per
Bus Per Trip (N)
Daily Total Expenditure
Per Bus (N)
Daily Contribution
Per Bus (N)
125 15,000 NIL 0 2 1 2 6 1,700 247 1,539 47600 16786 30814
195 23,400 10 4,900 3 1 3 10 3,500 247 1,539 98000 30086 67914
85 10,200 7 780 4 1 2 3 800 247 513 22400 11740 10660
155 18,600 NIL 0 4 1 4 6 1,500 247 513 42000 19360 22640
145 17,400 ,, 0 1 1 1 6 2,000 247 513 56000 18160 37840
125 15,000 7 1960 1 1 1 6 2,000 247 513 56000 17720 38280
155 18,600 7 2156 1 1 1 7 2,200 247 513 61600 21516 40084
185 22,200 7 2450 1 1 1 9 2,500 247 513 70000 25410 44590
125 15,000 NIL 0 1 1 1 6 1,800 247 513 50400 15760 34640
155 18,600 ,, 0 1 1 1 7 2,000 247 513 56000 19360 36640
30 3,600 ,, 0 3 3 9 1 300 247 513 8400 4360 4040
75 9,000 ,, 0 2 1 2 3 900 247 1,539 25200 10786 14414
85 10,200 ,, 0 1 1 1 4 1,200 247 1,539 33600 11986 21614
60 7,200 ,, 0 2 1 2 2 600 247 513 16800 7960 8840
30 3,600 ,, 0 1 2 2 1.5 300 247 513 8400 4360 4040
25 3,000 ,, 0 1 3 3 1 150 247 513 4200 3760 440
30 3,600 ,, 0 3 2 6 1.5 350 247 513 9800 4360 5440
30 3,600 ,, 0 1 2 2 1 300 247 513 8400 4360 4040
25 3,000 ,, 0 1 2 2 1 150 247 513 4200 3760 440
30 3,600 ,, 0 1 1 1 1.5 200 247 513 5600 4360 1240
1870 224400 38 12246 35 28 47 83.5 24450 4940 14364 684600 255950 428650
Note
‘Daily cost of service per bus’ and ‘daily cost of repair/maintenance per bus’ are obtained in tables 4 and 5 respectively.
‘Equivalent number of buses per route’ is obtained by multiplying ‘Number of buses per route’ by ‘number of trips per day’. Remember, a trip means to and fro minna. ‘Return per bus per trip’ is obtained by multiplying ‘transport fare’ per passenger by 2 (since a trip means to and fro) and 14 (number of passengers in a bus)
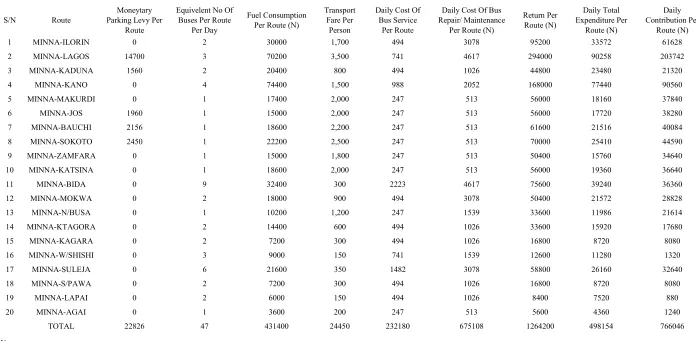
Table 7. Daily Contribution per Route
S/N Route Parking Levy Per Moneytary Route
Equivelent No Of Buses Per Route
Per Day
Fuel Consumption Per Route (N)
Transport Fare Per
Person
Daily Cost Of Bus Service
Per Route
Daily Cost Of Bus Repair/ Maintenance
Per Route (N)
Return Per Route (N)
Daily Total Expenditure Per
Route (N)
Daily Contribution Per
Route (N)
1 MINNA-ILORIN 0 2 30000 1,700 494 3078 95200 33572 61628
2 MINNA-LAGOS 14700 3 70200 3,500 741 4617 294000 90258 203742
3 MINNA-KADUNA 1560 2 20400 800 494 1026 44800 23480 21320
4 MINNA-KANO 0 4 74400 1,500 988 2052 168000 77440 90560
5 MINNA-MAKURDI 0 1 17400 2,000 247 513 56000 18160 37840
6 MINNA-JOS 1960 1 15000 2,000 247 513 56000 17720 38280
7 MINNA-BAUCHI 2156 1 18600 2,200 247 513 61600 21516 40084
8 MINNA-SOKOTO 2450 1 22200 2,500 247 513 70000 25410 44590
9 MINNA-ZAMFARA 0 1 15000 1,800 247 513 50400 15760 34640
10 MINNA-KATSINA 0 1 18600 2,000 247 513 56000 19360 36640
11 MINNA-BIDA 0 9 32400 300 2223 4617 75600 39240 36360
12 MINNA-MOKWA 0 2 18000 900 494 3078 50400 21572 28828
13 MINNA-N/BUSA 0 1 10200 1,200 247 1539 33600 11986 21614
14 MINNA-KTAGORA 0 2 14400 600 494 1026 33600 15920 17680
15 MINNA-KAGARA 0 2 7200 300 494 1026 16800 8720 8080
16 MINNA-W/SHISHI 0 3 9000 150 741 1539 12600 11280 1320
17 MINNA-SULEJA 0 6 21600 350 1482 3078 58800 26160 32640
18 MINNA-S/PAWA 0 2 7200 300 494 1026 16800 8720 8080
19 MINNA-LAPAI 0 2 6000 150 494 1026 8400 7520 880
20 MINNA-AGAI 0 1 3600 200 247 513 5600 4360 1240
TOTAL 22826 47 431400 24450 232180 675108 1264200 498154 766046
Note
‘Monetary parking levy per route’ is obtained by multiplying ‘Monetary parking levy per bus’ by ‘Equivalent number of buses per route’ ‘Fuel consumption per route’ is obtained by multiplying ‘Fuel consumption per bus’ by ‘Equivalent number of buses per route’ ‘Daily cost of service per route’ is obtained by multiplying ‘Daily cost of service per bus’ by ‘Equivalent number of buses per route’
‘Daily cost of repair/maintenance per route; is obtained by multiplying ‘Daily cost of repair/maintenance per bus’ and ‘Equivalent number of buses per route’ ‘Return per route’ is obtained by multiplying ‘Return per bus’ and ‘Equivalent number of buses per route’
8. NSTA Problem Formulation
The Problem Formulation is based on the information under the Problem Situation and Table 6. The problem is formulated under the assumption that all the 49 buses that commute intra and inter states routes are working daily.
Based on the interview with NSTA, availability of passengers and the number of other transport services plying the same routes, among other factors, determine the number of buses that NSTA can assign to these routes. The following shows the possible number of buses that can be scheduled to routes:
Inter States Routes Possible No of Buses
MINNA-ILORIN 2-3
MINNA-LAGOS 3-4
MINNA-KADUNA 2-4
MINNA-KANO 3-5
MINNA-MAKURDI 1
MINNA-JOS 1
MINNA-BAUCHI 1
MINNA-SOKOTO 1
MINNA-ZAMFARA 1
MINNA-KATSINA 1
Intra State Routes Possible No of Buses
MINNA-BIDA 9
MINNA-MOKWA 1-2
MINNA-NEW BUSA 1-2
MINNA-KTAGORA 2-3
MINNA-KAGARA 2-4
MINNA-WUSHISHI 1-2
MINNA-SULEJA 6
MINNA-SERKI PAWA 1-2
MINNA-LAPAI 0 -1
MINNA-AGAI 0 -1
It must be strongly noted that our allocation must not exceed 49 buses available for intra and inter states services
Below is our problem formulation:
67914X2 + 10660X3 + 22640X4 + 37840X5 + 38280X6 + 40084X7 + 44590X8 + 34640X9 +36640X10 +4040X11 +14414X12 +21614X13 +8840X14 + 4040X15 + 440X16 + 5440X17 + 4040X18 + 440X19 + 1240X20
<= 3 <= 4
1X3 <= 4
1X4 <= 4
1X5 <= 1
1X6 <= 1
1X7 <= 1
1X8 <= 1
1X9 <= 1
1X10 <= 1
1X11 <= 9
1X12 <= 2
1X13 <= 1
1X14 <= 3
1X15 <= 3
1X16 <= 3
1X17 <= 6
1X18 <= 2
1X19 <= 2
1X20 <= 1
X3 + X4 + X5 + X6 + X7 + X8 + X9 + X10 + X11 + X12 + X13 + X14 + X15 + X16 + X17 + X18 + X19 + X20 <= 49
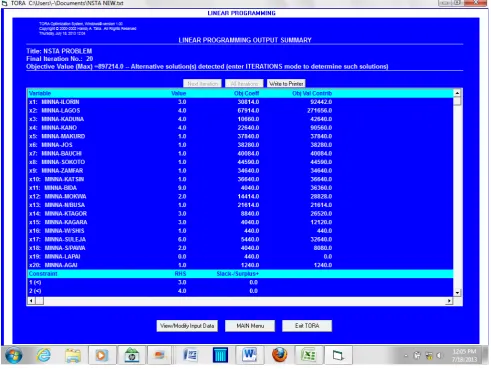
9. Result of the Problem Formulation
The formulated problem was solved using TORA – computer software used in solving Linear Programming which has been developed by Hamdy Taha (2002 edition). The 20th iteration reached the optimal solution and the objective value of 897,
Figure 2. Linear Programming Output Summary Explanation
10. Recommendation
Table 8 below shows the summary of our recommendation which is based on the result of our study:
Table 8. Recommended Schedule
S/No Route NSTA Current Schedule Recommended Schedule
1 MINNA-ILORIN 2 3
2 MINNA-LAGOS 3 4
3 MINNA-KADUNA 2 4
4 MINNA-KANO 4 4
5 MINNA-MAKURDI 1 1
6 MINNA-JOS 1 1
7 MINNA-BAUCHI 1 1
8 MINNA-SOKOTO 1 1
9 MINNA-ZAMFARA 1 1
10 MINNA-KATSINA 1 1
11 MINNA-BIDA 9 9
12 MINNA-MOKWA 2 2
13 MINNA-N/BUSA 1 1
14 MINNA-KTAGORA 2 3
15 MINNA-KAGARA 2 3
16 MINNA-W/SHISHI 3 1
17 MINNA-SULEJA 6 6
18 MINNA-S/PAWA 2 2
19 MINNA-LAPAI 2 0
20 MINNA-AGAI 1 1
Note: From S/NO 1 in Table 8 above, the current NSTA bus schedule from Minna to Ilorin is 2 buses per day, while our model recommends 3 buses from Minna to Ilorin per day. This is the same procedure down to S/NO 20.
11. Conclusion
The current NSTA schedule seen in Table 8 yields a daily contribution of N766, 046 (see Table7). Our recommended schedule will yield N897, 214 when implemented. This means that our model is better by yielding additional N131, 168 to the organization.
REFERENCES
[1] Adler I., Karmarkar N, Mauricio G.C. and Veiga G.(1995), An Implementation of Karmarkar’s Algorithm for Linear Programming.Retrieved from http://citeseerx.ist.psu.edu/vie wdoc/download?doi =10:1:1:48:8163rep = rep1type = pdf [2] Chinnech J.W. (2001), Practical Optimization; A Gentle
Introduction. Retrieved from http://www.sce.carleton.ca/facu lty/Chinneck/po.html
[3] Hillier F.S and Lieberman G.J (1986), Introduction to operations research. Holden-day, Inc. USA
[4] NSTA (n.d), Niger State Transport Authority at a Glance, Yan Ju Prints, Minna, Nigeria
[5] Ramsey D. (2012), Operations Research I. Retrieved from [6] http://www3.ul.ie/ramsey/Lectures/OperationsResearch1=or
1slides3:pdf