Comparison of Queuing Performance Using Queuing
Theory Model and Fuzzy Queuing Model at
Check-in Counter in Airport
Noor Hidayah Mohd Zaki*, Aqilah Nadirah Saliman, Nur Atikah Abdullah, Nur Su Ain Abu Hussain, Norani Amit
Faculty Computer and Mathematical Sciences, Universiti Teknologi MARA Negeri Sembilan, Malaysia
Received July 1, 2019; Revised August 28, 2019; Accepted September 20, 2019
Copyright©2019 by authors, all rights reserved. Authors agree that this article remains permanently open access under the terms of the Creative Commons Attribution License 4.0 International License
Abstract
A queuing system is a process to measure the efficiency of a model by underlying the concepts of queue models: arrival and service time distributions, queue disciplines and queue behaviour. The main aim of this study is to compare the behaviour of a queuing system at check-in counters using the Queuing Theory Model and Fuzzy Queuing Model. The Queuing Theory Model gives performance measures of a single value while the Fuzzy Queuing Model has a range of values. The Dong, Shah and Wong (DSW) algorithm is used to define the membership function of performance measures in the Fuzzy Queuing Model. Based on the observation, the problem often occurs when customers are required to wait in the queue for a long time, thus indicating that the service systems are inefficient. Data including the variables were collected, such as arrival time in the queue (server) and service time. Results show that the performance measures of the Queuing Theory Model lie in the range of the computed performance measures of the Fuzzy Queuing Model. Hence, the results obtained from the Fuzzy Queuing Model are consistent to measure the queuing performance of an airline company in order to solve the problem in waiting line and will improve the quality of services provided by airline company.Keywords
Queuing Theory Model, Fuzzy Queuing Model, Dong, Shah and Wong (DSW) Algorithm1. Introduction
Queues happen at any place such as airport terminal, hospital, grocery store and even petrol station. Customers queue while getting service either at counters or machines before they are served. Long queuing lines can be seen at an airport check-in counter especially during the arrival
and departure of planes. The long queues may happen due to an insufficient service system and low service quality, thus increasing the waiting time. Reducing waiting time and providing quick service are very important in service-related operations [1]. Service-related companies place importance on reducing the waiting time of customers in order to increase customer satisfaction through improving their service quality. The queuing theory can be measured using the quantitative analysis technique to predict the characteristics of a waiting line [2]. The queuing theory is used to translate the customer’s arrival time as well as analyze the queuing behaviour mathematically from the amount of time that a customer needs to wait in the system based on a real queuing situation [3].
Fuzzy queuing can be defined as a new technique which is often seen in a real world situation. According to [4], the existence of fuzzy numbers can help the manager to facilitate the service time with uncertainty and at the same time maximize the profit. In addition, fuzzy queuing also can be applied into the fuzzy possibilistic-queuing model where the main objectives are to minimize total cost and cost for transportation [5]. Furthermore, the fuzzy set theory is easily adaptable compared to other theories [6]. The fuzzy set theory is also done as an assessment for sensitive stochastic delay of flights [7]. In relation to the airport system, the fuzzy theory is also used to define the arrival and service times in airports [8] [9].
(DSW) algorithm is used for the fuzzy queuing model for an α-cut method. The DSW algorithm is used to define a membership function of the performance measures in a multi-server fuzzy queuing model [10]. Both models are compared based on the results of the average number of customers in the queue (Lq), average number of customers
in the system (L), average waiting time of a customer in the queue (Wq), and average waiting time of a customer in the
system (W).
2. Methods
2.1. Queuing Theory Model
The queuing theory was first introduced by A.K. Erlang in 1909. In this study, Lq, Ls, Wq and Ws are computed for
the multi-server channel single phase (M/M/s) [11]. The average server utilization,
(1) Probability of zero customers in the system,
(2)
The average number of customers in the waiting line,
(3)
The average number of customers waiting in the system,
(4) The average time a customer waits for service,
(5) The average time a customer is in the system,
(6)
2.2. Fuzzy Queuing Theory Model
Zadeh [12] invented the idea of a fuzzy set in the queuing theory and transformed the idea into fuzzy queue models, as implemented by [13], [14] and others. Shanmugasundaram [15] also stated that the fuzzy queuing theory seems to be more practical to be implemented in a real queuing situation rather than the queuing theory model.
2.2.1. Preliminaries
The following are preliminaries to compute the performance measures of the fuzzy queuing theory. Interval Analysis Arithmetic
Thamotharan [16] has provided the interval analysis arithmetic to constitute the output interval for membership functions for the - cut levels that are selected.
Consider the interval and where and
Addition
(7) Subtraction
(8) Multiplication
(9) Division
[ ] [ ] [ ]
[ ]
provided that
,
,
÷ ×
∉
1 1
0
e, f x, y = e, f , y x
x y
(10)
From max and min, the range values will be computed as below:
[ ] [
[
]
]
for for < 0,
α = α α α α α >
α
0
e f e, f
f, e (11)
Strong and Weak - cut
According to [17], for a fuzzy set of A, it is defined on x for any . The - cut will be shown according to the following crisp set.
Strong - cut, Aα
( )
{
x∈X |µA x > α}
(12) ρ=
s
λ ρ
µ
0
P
0 1
0
1
1 1 1
! ! 1
− =
=
+
−
∑
n s
s
n P
n s
λ λ
µ µ ρ
Lq
(
)
2! 1 =
−
s
q
L s
λ ρ
µ ρ
s
L
= +
s q
L L λ
µ
Wq
= q q
L W
λ
Ws
= s
s
L W
λ
α
[ ]
e, f[ ]
x, y e≤ f≤
x y
[ ] [ ] [
e, f + x, y = e + x, f + y]
[ ] [ ] [
e, f − x, y = e−x , f − y]
[ ] [ ]
e, f × x, y =min(
ex,ey, fx, fy)
,max(
ef,ey, fx, fy)
α
[ ]
α = 0,1 α
Weak α-cut, Aα
( )
{
x∈X |µA x ≥α}
(13) Trapezoidal Fuzzy Number [18](14)
(15) (16)
Let be the family of h-trapezoidal fuzzy numbers, that is;
( )
(
, , ;)
, < ≤ = ≤ ≤ ≤ = 1 2 0 1 : TN3, 4 1 2 3 4
F h
h
A a a a a h a a a a
(17) The - cut interval for Trapezoidal Fuzzy Number [18]
(18)
(19)
By using equation (18) and (19), equation (20) is obtained
(
)
(
)
4 4 3 2 1 1,
for 0 1
− − ≤ ≤ − +
≤ ≤
ha a a hx a a ha
h
α α
(20) Therefore, the equation (21) for the range of Trapezoidal Fuzzy Number is obtained
(21) 2.2.2. DSW Algorithm
The fuzzy queuing theory model is more realistic and produces a more refined result [19]. In this study, the DSW algorithm is used to describe a membership function of the multi-server fuzzy queuing model’s performance measures [10]. The α-cut shows the possibility of the fuzzy queuing
performance measure in the related range. At the range of α = 0, it shows that the performance measures could appear, while α = 1 shows the performance measures that are likely to be [20]. There are four steps to follow [21]:
Step 1 Select α cut value where 0 ≤ α ≤ 1.
Step 2 Find the intervals in the arrival rate and service rate membership functions that correspond to this α.
Step 3 Using standard binary interval operations, compute the interval for membership function for the selected α-cut levels.
Step 4 Repeat steps 1 to 3 for different values of α to complete an α-cut representation of the solution.
2.2.3. Lq, Ls, Wq and Ws
After completing the calculations in the DSW algorithm, we need to compute the performance measures for the fuzzy queuing theory model. The different values of α will be substituted into the following formula of performance measures. Below are the lists of formulas derived from [16] to form the trapezoidal fuzzy queuing model.
The utilization factor, ρ
(22) The probability that there are zero customers in the system, :
(23)
The average number of customers in the system (waiting in queue and being served), Lq :
(24)
The average number of customers in the system, (25) The average time a customer waits for service,
(26) The average time a customer is in the system,
(27) Where
[
]
[
]
[
]
[
]
, : Arrival rate, , , , , : Service rate, , , ,
= + − =
= + − =
x b e b c d e
y f i f g h i
α α λ
α α µ (28)
( )
(
)
(
)
(
)
(
)
≤ ≤ ≤ ≤ ≤ ≤ x - a1
h ,a1 x a2
a - a2 1
h ,a1 x a 2 A x =
a - x4
h ,a3 x a4
a - a4 3
0 ,otherwise
( )
TN F h α(
)
(
)
(
)
(
)
for≥
≥ α ≥ α
≥ α + ≤ ≤
1
0 1
1
2 1
1 2 1
1 2 1
2 1 1
x - a h
a - a
h x - a a - a
hx - ha a - a
hx a - a ha h
(
)
(
)
(
)
(
)
(
)
for 44 3
4 4 3
4 4 3
4 3 4
4 4 3
a - x h
a - a
h a - x a - a
ha hx a - a
-hx a - a ha
hx ha a - a h
≥
≥ α
− ≥ α
≥ α −
≤ − α ≤ ≤
1
0 1
( )
{
4(
4 3) (
, 2 1)
1}
TNF h = ha −α a −a α a −a +ha
= x sy ρ 0 P 0 1 0 1
1 1 1
! ! 1
− = = + −
∑
n s s n P x xn y s y ρ
Both arrival and service rates are represented as trapezoidal fuzzy numbers. The trapezoidal fuzzy numbers are represented as and
respectively. The minimum and maximum for arrival rate, are represented by [b,e], whereas for service rate the minimum and maximum are represented by [f,i].
3. Results
The data were collected from the check-in counter of a local airline in Malaysia. As decided, these data were collected manually every Saturday in a month for two hours from 2 p.m. until 4 p.m. Below is the summary of our data collection for four weeks.
Table 1. Data collection at check-in counter Week Number of
customers
Average number of customers
Service rate Week 1
(11/8/2018) 111 23
0.74 minutes Week 2
(18/08/2018) 100 20
0.99 minutes Week 3
(25/08/2018) 100 20
0.85 minutes Week 4
(8/09/2018) 118 23.6
0.85 minutes
Total 429 86.60 3.43 minutes
The data obtained are analyzed to get the input parameters, which are the arrival rate and service rate. These parameters are used to measure the multi-servers performance using the queuing theory model and fuzzy queuing model.
The result of this study is divided into three sections. The first is the queuing theory model’s performance measure. Second, the DSW algorithm fuzzy queuing model’s performance measure and the third is the comparison of both fuzzy queuing models.
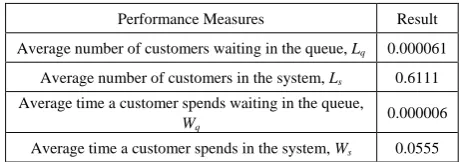
Table 2. Performance measures of Queuing Theory Model Performance Measures Result
Average number of customers waiting in the queue, Lq 0.000061
Average number of customers in the system, Ls 0.6111
Average time a customer spends waiting in the queue, Wq
0.000006
Average time a customer spends in the system, Ws 0.0555
The performance measures for the queuing theory model are computed using QM for Windows version 3.1. The Lq,
the average number of customers waiting in the queue in an hour is 0.000061, which is less than 1 person per hour as shown in Table 2. For Ls, the average number of customers
in the system is 0.6111, which is less than 1 customer every hour. For Wq, the average time a customer spends waiting
in the queue is 0.000006 hour, which equals to 0.00036 minutes taken for each customer to wait in line. Lastly for Ws, the average time a customer spends in the system is
0.0555 hour or 3.33 minutes per person. This means that it takes about 3 minutes for a customer to complete the process in the system.
[image:4.595.305.535.91.172.2]Microsoft Excel is used to compute the α-cut of λ and µ at multiple α-cut levels. The levels are 0, 0.1, 0.2, 0.3, 0.4, 0.5, 0.6, 0.7, 0.8, 0.9 and 1. The performance measures for , , and are as tabulated in Table 3. If α=0, it has the possibility of the performance measures to be shown. But if α=1, it is sure for the performance measures to be shown. α=1 is the core of the fuzzy system for the performance measures, while α=0 is the support of the fuzzy system for the performance measures to appear. The calculations for level α=0.1 until α=0.9 show that the value of the performance is in the range [0,1]. In the study, the average mean of the performance measures lies between the range of α=1 to α=0, which means it never falls outside of the range α=0.
Table 3. Performance measures for Fuzzy Queuing Theory Model
α (customer) (customer) (hour) (hour)
0 [0.0000019,0.01514] [0.3333,1.6818] [0.00000019,0.00076] [0.0333,0.0841]
0.1 [0.0000025,0.00953] [0.3507,1.5375] [0.00000025,0.00050] [0.0347,0.0805]
0.2 [0.0000034,0.00596] [0.3696,1.4060] [0.00000034,0.00033] [0.0362,0.0773]
0.3 [0.0000047,0.00370] [0.3902,1.2852] [0.00000045,0.00021] [0.0379,0.0743]
0.4 [0.0000065,0.00228] [0.4127,1.1737] [0.00000062,0.00014] [0.0397,0.0716]
0.5 [0.0000091,0.00138] [0.4375,1.0703] [0.00000086,0.00009] [0.0417,0.0691]
0.6 [0.0000129,0.00083] [0.4649,0.9742] [0.00000012,0.00006] [0.0439,0.0667]
0.7 [0.0000185,0.00048] [0.4954,0.8844] [0.00000017,0.00004] [0.0463,0.0646]
0.8 [0.0000270,0.00028] [0.5294,0.8003] [0.00000025,0.00002] [0.0490,0.0625]
0.9 [0.0000402,0.00016] [0.5677,0.7214] [0.00000037,0.00001] [0.0521,0.0606]
1 [0.0000611,0.00008] [0.6112,0.6471] [0.00000056,0.00001] [0.0556,0.0588] q
L Ls Wq Ws
q
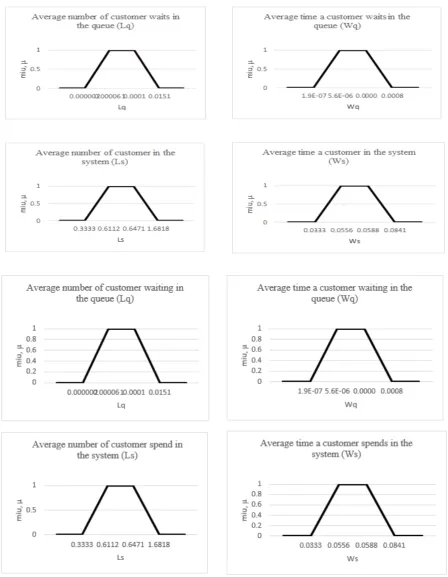
[image:4.595.71.527.550.732.2]The graphs of membership function of , , and for the fuzzy queuing model with trapezoidal fuzzy number is shown in Figure 1. The performance measures fall between range of α=1 and never falls outside the range of α=0. The range for the average number of customers waiting in the queue is between 0.000002 and 0.0151. At α=0, it will lie between 0.0000002 and 0.0151 while for α=1, the range is between 0.000061 and 0.0001. Hence, it shows that the number of customers waiting in the queue is less than 1 per hour. The range for the average number of customers in the system is between 0.3333 and 1.6818. At α=0, it will lie between 0.3333 and 1.6818 while for α=1, the range is between 0.6112 and 0.6471. Hence, the value of α-cut values is less than 1 which shows that the number of customers in the system is more than 1 customer per hour. The range for the average time a customer waits in the system is between 0.00000019 and 0.00076 hour. At α=0, it will lie between 0.00000019 and 0.00076 while for α=1, the range is between 0.00000056 and 0.00001. Hence, it shows that the time a customer waits in the queue is less than 1 minute per customer. The range for the average time a customer spends in the system is between 0.3333 and 0.0841 hour. At α=0, it will lie between 0.3333 and 0.0841 while for α=1, the range is between 0.0556 and 0.0588. Hence, it shows that the time a customer spends in the system is more than 1 minute per customer.
4. Discussion
Table 4. Comparison performance measures between the Queuing Theory Model and Fuzzy Queuing Model
Performance
Measures Queuing Theory Model Fuzzy Queuing, α = 1
0.000061 [0.0000611,0.00008]
0.6111 [0.6112,06471]
0.000006 hour
(0.00036 minutes) [0.00000056,0.00001] 0.0555 hour (3.33
minutes) [0.0556,0.0588]
Based on the table above, the performance measures for the queuing theory model is compatible with the fuzzy queuing model. The queuing theory model and fuzzy queuing model show that Lq is approximately less than 1
customer queuing in the waiting line, Ls is approximately
less than 1 customer queuing in the system, Wq is the
customer waiting less than 1 minute in the waiting line, and Ws is the customer waiting more than 1 minute in the
system. The values of Lq, Ls, Wq and Ws for the queuing
theory model lie in the fuzzy queuing model range value for α=1. Hence, the results of performance measures for the queuing theory model and fuzzy queuing model show both
models are equivalent. Since the value of queuing theory model obtained are lay in the range of performance measures of fuzzy queuing model. Therefore, it shows the result obtained is consistent.
5. Conclusions
In this study, the result shows that the performance measures Lq, Ls, Wq and Ws for both Queuing Theory
Model and Fuzzy Queuing Model were computed and compared. Based on the result, the Fuzzy Queuing Model is much more effective and efficient to measure the performance of multi-server in a queuing system since the Fuzzy set theory is more easily adaptable compared to other theories [6]. Garai and Garg (2019) stated that the vagueness or uncertainty situation can be solve using fuzzy model [22]. Applying the Fuzzy queuing model provides broader information, which will be very useful in defining a queuing system. Thus, this study concludes that fuzzy queuing is one of the alternative ways to compute the performance measures since the information obtained from the application is much easier to understand and interpret. Therefore, the Fuzzy Queuing Model is an alternative way to measure the performance of multi-server in a queuing system.
REFERENCES
B. T. Taylor. Introduction To Management Science, [1]
England : Pearson Education Limited, 2016.
N. Amit, N. A. Ghazali. Using simulation model queuing [2]
problem at a fast-food restaurant, In: Regional Conference on Science Technology and Social Sciences (RCSTSS), 1055-1062, Singapore:Springer , 2018.
A. B. N. Yakubu, U. Najim. An application of queuing [3]
theory to ATM service optimization: A case study, Mathematical Theory and Modelling, 11-23, 2014. M. J. Pardo, D. Fuenta. Optimizing a priority-discipline [4]
queuing model using fuzzy set theory. Computers and Mathematics with Applications, Vol.54, 267-281, 2007. B. Vahdani, R. Tavakkoli-Moghaddam, F. Jolai. Reliable [5]
design of a logistics network under uncertainty: A fuzzy possibilistic-queuing model, Applied Mathematical Modelling, Vol.37, No.5, 3254-3268, 2013.
T. Ebrahim, M. Ali, G. Iman, A. Hadi, F. Mehdi. Optimizing [6]
multi supplier systems with fuzzy queuing approach: Case study of SAPCO, International MultiConference of Engineers and Computer Scientists, 1-7, 2011.
S. Meng, D. Wu, Z. Huimin, L. Bo, W. Chunxiao. Study on [7]
an airport gate assignment method based on improved ACO algorithm. Emerald Insight, 20-43, 2018.
Aydin, Ozlem, A. Apaydin. Multi-channel fuzzy queuing [8]
systems and membership functions of related fuzzy services q
L Ls Wq
s W
q
L
s L
q
W
s W
q
L
s L
q
W
and fuzzy inter-arrival times, Asia-Pacific Journal of Operational Research, Vol.25, No.5, 697–713, 2008. N. Sujatha, V. S. Murthy Akella, G. V. S. Deekshitulu. [9]
Analysis of multiple server fuzzy queueing model using α – cuts. International Journal of Mechanical Engineering and Technology (IJMET), Vol.8, No.10, 35–41, 2017.
S. Thamotharan. A study on multi server fuzzy queuing [10]
model in triangular and trapezoidal fuzzy numbers using cuts, Vol.5, No.1, 226–230, 2016.
J. Kingman. The first Erlang century—and the next. [11]
Queueing Systems, 63(1-4), 3, 2009.
L. A. Zadeh. A note on prototype theory and fuzzy sets. [12]
587-593, 1965.
J. J. Buckley. Elementary queueing theory based on [13]
possibility theory, Journal Fuzzy Sets and Systems, Vol.37, No.1, 43 – 52, 1990
M. Meenu, T. P. Singh, G. Deepak. Threshold effect on a [14]
fuzzy queue model with batch arrival, Arya Bhatta Journal of Mathematics and Informatics,Vol.7, No.1, 109- 118, 2015.
S. Shanmugasundaram, S. Thamotharan, M. Ragapriya. A [15]
study on single server fuzzy queuing model using DSW algorithm, International Journal of Latest Trends in Engineering and Technology (IJLTET), Vol.6, No.1, 162– 169, 2015.
S. Thamotharan. A study on multi server fuzzy queuing [16]
model triangular and trapezoidal fuzzy number using α-cuts, International Journal of Sciences and Research (IJSR), 226-230, 2014.
S. Shanmugasundaram, B. Venkatesh. Multi–server fuzzy [17]
queueing model using DSW algorithm, Global Journal of Pure and Applied Mathematics, Vol.11, No.1, 45-51, 2015. B. Farhadinia, A. I. Ban. Developing new similarity [18]
measures of generalized intuitionistic fuzzy numbers and generalized interval-valued fuzzy numbers from similarity measures of generalized fuzzy numbers, Mathematical and Computer Modelling, 57(3-4), 812-825, 2013.
E. Lee, R. J. Li. Comparison of fuzzy numbers based on the [19]
probability measure of fuzzy events. Computers & Mathematics with Applications, Vol.15, No.10, 887-896, 1988.
R. Srinivasan. Fuzzy queueing model using DSW algorithm, [20]
International Journal of Advanced Research in Mathematics and Applications, Vol.1, No.1, 57–62, 2014.
A. Boissonnade, W. Dong, H. Shah, F. Wong. Identification [21]