An Application of the Generalized Rectangular Fuzzy
Assessment Model to the van Hiele Level Theory of
Geometric Reasoning
Igor Ya. Subbotin
1,*, Michael Gr. Voskoglou
21Department of Mathematics and Natural Sciences, College of Letters and Sciences, National University, USA
2Department of Mathematical Sciences, School of Technological Applications, Graduate Technological Educational Institute (T. E. I.) of
Western Greece, Greece
Copyright©2017 by authors, all rights reserved. Authors agree that this article remains permanently open access under the terms of the Creative Commons Attribution License 4.0 International License
Abstract
The Generalized Rectangular FuzzyAssessment Model (GRFAM) is applied for the evaluation of student group acquisition of the van Hiele levels of geometric reasoning and an example is presented illustrating our results. The GRFAM is a variation of the Center of Gravity defuzzification technique created in an effort to treat better the ambiguous assessment cases being at the boundaries between any two successive assessment grades.
Keywords
Fuzzy Sets (FS) and Logic (FL), Center ofGravity (COG), Defuzzification Technique, Generalized Rectangular Fuzzy Assessment Model (GRFAM),van Hiele (vH) Levels of Geometric Reasoning
1. Introduction
Situations appear frequently in our day to day life characterized by a degree of uncertainty and/or fuzziness. In Education for example, a teacher is frequently not sure about the degree of acquisition of the new knowledge by students, or for the proper mark to characterize a student’s performance. There used to be a tradition in science and engineering of turning to probability theory when a problem was faced in which uncertainty played an important role. Today this is no longer the rule. Fuzzy Logic (FL), due to its property of characterizing the ambiguous cases with multiple values, provides a rich and meaningful addition to standard logic enabling the mathematical modelling under conditions which are imprecisely defined, despite the concerns of classical logicians.
The authors of this article have frequently utilized principles of FL in past to describe and/or evaluate several human activities. Here the Generalized Rectangular Fuzzy Assessment Model (GRFAM) is applied for assessing the student group acquisition of the van Hiele (vH) levels of
geometric reasoning.
The rest of the paper is formulated as follows: In Section 2 a brief account is given of the vH level theory and of several previous researches on it connected to the present work. In Section 3 we describe the GRFAM, while in Section 4 an example is presented illustrating its applicability for assessing the acquisition of the vH levels in Geometry by high school students. The last Section 5 includes our conclusion and some hints for future research.
For general facts on Fuzzy Sets (FS) and FL we refer to the book [5]. It is recalled here that a FS on the universal set of the discourse U (or a fuzzy subset of U) is a set of ordered pairs of the form A = {(x, m(x)): x
∈
U}, where m: U→
[0, 1] is its membership function. The closer is the membershipdegree y=m(x) of x to 1, the better x satisfies the
characteristic property of A. Practically speaking, a FS is a set with no clear boundaries, e.g. the high mountains of a country, the good players of a team, the young inhabitants of a city, etc.
For reasons of simplicity many authors identify a fuzzy set with its membership function, the choice of which is not unique, depending upon the user’s personal criteria of goals. However, in order to represent correctly the corresponding real situation, the choice of the membership function must be compatible to the common sense.
2. The van Hiele Levels of Geometric
Reasoning
solutions of several geometric propositions and problems. The vH theory of geometric reasoning [12, 13] suggests that students can progress through five levels of increasing structural complexity. A higher level contains all knowledge of any lower level and some additional knowledge which is not explicit at the lower levels. Therefore, each level appears as a meta-theory of the previous one [2]. The five vH levels include:
L1 (Visualization): Students perceive the geometric
figures as entities according to their appearance, without explicit regard to their properties.
L2 (Analysis): Students establish the properties of
geometric figures by means of an informal analysis of their component parts and begin to recognize them by their properties.
L3 (Abstraction): Students become able to relate the
properties of figures, to distinguish between the necessity and sufficiency of a set of properties in determining a concept and to form abstract definitions.
L4 (Deduction): Students reason formally within the
context of a geometric system and they gasp the significance of deduction as means of developing geometric theory.
L5 (Rigor): Students understand the foundations of
geometry and can compare geometric systems based on different axioms.
Obviously the level L5 is very difficult, if not impossible, to appear in secondary classrooms, while level L4 also appears very rarely.
Although van Hiele [13] claimed that the above levels are discrete – which means that the transition from one level to the next one does not happen gradually but all at once – alternative researches by Burnes & Shaughnessy [1], Fuys et al. [3], Wilson [20], Guttierrez et al. [4], and by Perdikaris [6] suggest that the vH levels are continuous characterized by transitions between the adjacent levels. This means that from the teacher’s point of view there exists fuzziness about the degree of student acquisition of each vH level. Therefore, principles of FL can be used for the assessment of student geometric reasoning skills.
3. The Generalized Rectangular Fuzzy
Assessment Model
It is recalled that the solution of a problem in terms of FL involves in general the following steps:
Choice of the universal set U of the discourse.
Fuzzification of the problem’s data by defining the proper membership functions.
Evaluation of the fuzzy data by applying rules and principles of FL to obtain a unique fuzzy set, which determines the required solution.
Defuzzification of the final outcomes in order to apply the solution found in terms of FL to the original, real world problem.
One of the most popular in fuzzy mathematics defuzzification methods is the Centre of Gravity (COG)
technique. According to this technique the fuzzy outcomes are represented by the coordinates of the COG of the level section contained between the graph of the corresponding membership function and the X-axis [11], which are calculated by known from Mechanics formulas; see formulas (1) in [8].
Subbotin et al. [7], based on a Voskoglou’s [14] fuzzy model for the process of learning a subject matter in the classroom, adapted the COG technique for use as an assessment method of student learning skills. Since then Subbotin and Voskoglou used the COG technique for assessing several other human activities. This method, named as the Rectangular Fuzzy Assessment Model (RFAM), was applied for assessing the student performance of two different Departments of the School of Technological Applications (prospective engineers) of the Graduate T. E. I. of Western Greece in the common final exam of the mathematics course of their first term of studies [8].
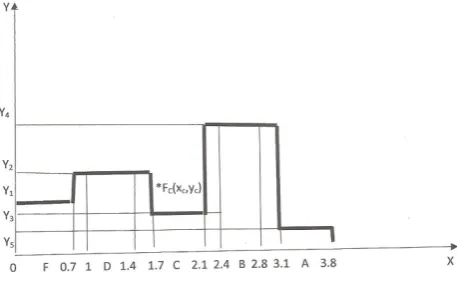
It is recalled that the membership function’s graph of RFAM consists of five adjacent rectangles corresponding to the fuzzy linguistic labels (grades) of excellent (A), very good (B), good (C), fair (D) and unsatisfactory (F) student performance respectively ([8], Figure 1).
Student performance can be assessed by numerical scores in a climax from 0-100. These scores are assigned to the above linguistic grades as follows: A (85-100), B (75-84), C (60-74), D (50-59) and F (0-49). Note that, the above assignment, although it satisfies the common sense, it is not unique; for example, in a more strict assessment one could take A(90-100), B(80-89), C(70-79), D(60-69) and F (0-59), etc.
Figure 1. Graphical representation of the GRFAM
[image:2.595.319.548.485.627.2]corresponding calculations of the COG coordinates.
[image:3.595.313.550.355.559.2]The graph of the resulting FS is now the bold line of Figure 1. However, the method used in ([8], Section 2) for calculating the coordinates of the COG is not the proper one here, because in this way the common rectangle parts are calculated only once. The right method for calculating the coordinates of the COG in this case was developed by Subbotin [10] and the resulting framework was called the
Generalized Rectangular Fuzzy Assessment Model (GRFAM).
The development of GRFAM involves the following steps:
1. Let y1, y2, y3, y4, y3be the frequencies of a group’s members (e.g. students) who obtained the grades F, D, C, B, A respectively. Then 5
1 i
i
y
=
∑
= 1 (100%).2. We take the heights of the rectangles in Figure 2 to have lengths equal to the corresponding frequencies. Also, without loss of generality we allow the sides of the adjacent rectangles lying on the OX axis to share common parts with length equal to the 30% of their lengths, i.e. 0.3 units.1
3. We calculate the coordinates (
x
ci,
y
ci) of the COG, say Fi , of each rectangle, i = 1, 2, 3, 4, 5 as follows: Since the COG of a rectangle is the point of the intersection of its diagonals, we have that1 .
2
i
c i
y
=
y
Also, since the x-coordinate of each COG Fi is equal to the x- coordinate of the middle of the side of the corresponding rectangle lying on the OX axis, from Figure 2 it is easy to observe thatx
ci = 0.7i – 0.2.4. We consider the system of the COGs Fi and we calculate the coordinates (Xc, Yc) of the COG F of the whole area considered in Figure 2 as the resultant of the system of the GOCs Fi of the five rectangles from the following well known [19] formulas
Xc =
5 1 1 i i c i S x S
∑
= , Yc =5 1 1 i i c i S y
S
∑
= (1)In the above formulas Si, i= 1, 2, 3, 4, 5 denote the areas of the corresponding rectangles, which are equal to y. Therefore
S = 5
1 i
i
S
=
∑
= 51 i
i
y
=
∑
= 1 and formulas (1) give thatXc = 5
1 i(0.7 0.2) i
y i
= −
∑
, Yc =5 1 1 ( ) 2 i i i y y =
∑
or Xc = 5
1
(0.7 i) 0.2 i
iy
= −
∑
, Yc = 5 2 1 1 2 i i y =∑
(2).5. We determine the area in which the COG F lies as follows: For i, j = 1, 2, 3, 4, 5, we have that 0
≤
(yi - yj)2 = yi2 +yj2 - 2yiyj,therefore yi2 + yj2
≥
2yiyj, with the equality holding if, and only if, yi = yj.1 Since the ambiguous assessment cases are situated at the boundaries between the adjacent grades, it is logical to accept a percentage for the common lengths of less than 50% of the original lengths.
Therefore 1=( 5
1 i
i
y
=
∑
)2= 5 2 1 ii
y
=
∑
+ 25
, 1, i j
i j i j
y y
= ≠
∑
≤
5 21 i
i
y
=
∑
+ 25
2 2
, 1,( i j )
i j i j y y = ≠ +
∑
= 5 5 21 i
i
y
=
∑
or 5 2 1 ii
y
=
∑
≥ 15 (3), with the equality holding if, and only if, y1 = y2 = y3 = y4 = y5 =15. In case of the equality the first of formulas (2) gives that Xc = 0.7(1
5 + 2 5 +
3 5 +
4 5 +
5
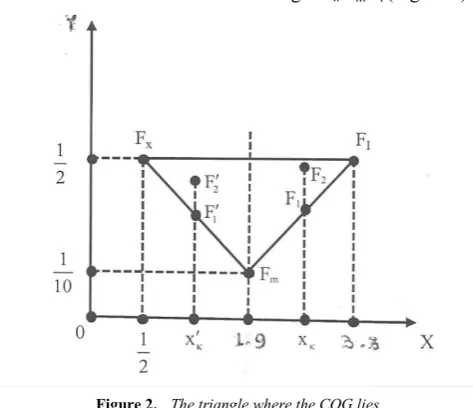
5) – 2 = 1.9. Further, combining the inequality (3) with the second of formulas (2), one finds that Yc ≥101 Therefore the unique minimum for Yc corresponds to the COG Fm(1.9, 0.1).
The ideal case is when y1 = y2 = y3 = y4 = 0 and y5=1. Then formulas (2) give that Xc=3.3 and Yc = 1
2. Therefore the
COG in this case is the point Fi (3.3, 0.5).
On the other hand, the worst case is when y1 = 1 and y2 =
y3 = y4 = y5 = 0. Then from formulas (2) one finds that the COG is the point Fw (0.5, 0.5). Therefore, the area in which the COG Flies is the area ofthe triangle Fw Fm Fi (Figure 2).
Figure 2. The triangle where the COG lies
6. From elementary geometric observations on Figure 2 one obtains the following assessment criterion:
Between two groups, the group with the greater Xc
performs better.
If two groups have the same Xc ≥ 1.9, then the group
with the greater Yc performs better.
If two groups have the same Xc < 1.9, then the group
with the lower Yc performs better
From the first of formulas (2), in which greater coefficients are assigned to the higher scores, and the above criterion it becomes evident that the GRFAM measures the
quality group’s performance. Also, since the ideal
performance corresponds to the value Xc = 3.3, values of Xc greater than
2
3
.
3
= 1.65 indicate a more than satisfactory
[image:3.595.56.301.586.665.2]performance.
Note that two similar to GRFAM models were developed in ([8], Section 3), which were named as the Trapezoidal
(TpFAM) and the Triangular (TFAM) Fuzzy Assessment
Model respectively. The TpFAM was developed by
replacing the rectangles of GRFAM with isosceles trapezoids (see also [9]) and the TFAM by replacing them with isosceles triangles. The formulas calculating the COG in these models are:
Xc = 5
1
(0.7 i) 0.2 i
iy
= −
∑
, Yc = a5 2 1 i i
y
=
∑
(4), with a =7
3
for TpFAM and a =
5
1
for TFAM, while the assessment criterion remains the same in both cases as the above criterion for GRFAM. On comparing formulas (2) and (4) in terms of this criterion it turns out that GRFAM, TpFAM and
TFAM are equivalent models providing always the same
assessment outcomes. In other words, the shape of the membership function’s graph does not affect the assessment conclusions.
4. Assessing the Acquisition of the Van
Hiele Levels by Students
Gutierrez et al. [4] presented a paradigm for evaluating the acquisition of the vH levels in three–dimensional Geometry by three different groups, say G1, G2 and G3, consisting of 20, 21 and 9 students respectively. Here, in order to illustrate the applicability of the GRFAM to the vH level theory, we shall use the data of this paradigm, which are depicted in Table 1.
Table 1. Data of the paradigm [Degree of acquisition] Group vH level F D C B A
G1 L1 0 0 0 0 20
G1 L2 1 0 3 6 10
G1 L3 2 3 6 6 3
G2 L1 0 0 1 2 18
G2 L2 0 3 4 13 1
G2 L3 9 6 5 1 0
G3 L1 0 2 4 2 1
G3 L2 3 4 2 0 0
G3 L3 9 0 0 0 0
From the first row of Table 1 one finds that y5=1 and
y1=y2=y3=y4=0 for L1 in G1. Therefore, the first of formulas (2) gives that Xc= 3.3. Similarly, from the fourth row of Table 1, one finds that y1=y2=0, y3=
1
21
, y4=2
21
andy5=
18
21
Therefore Xc=0.7(3
21
+
8
21
90
21
+
)≈
3.17 for L1 in G2. In the same way one finds that the values of Xc are 2.06 for L1 in G3, 2.74, 2.3, 1.12 for L2 in G1, G2, G3respectively and 2.08, 1.17, 0.5 for L3 in G1, G2, G3 respectively.Therefore, according to the first case of the assessment criterion of Section 3, G1 demonstrated the best performance in the first three vH levels, followed by G2 and G3.
Also, on comparing the above values with 1.65, one concludes that G1 demonstrated a more than satisfactory performance in these three levels, while G2 demonstrated a more than satisfactory performance in the first two levels and G3 demonstrated a more than satisfactory performance only in the first level.
Finally, since the mean value
3.3 3.17 2.06
3
+
+
3.3 3.17 2.06
3
+
+
≈
2.84, G1 demonstrated a more than satisfactory overall performance in the first three vH levels. In the same way, since the corresponding mean values for G2 and G3 are 2.21 and 1.08 respectively, G2 demonstrated also a more than satisfactory overall performance, while the performance of G3 was not satisfactory.
5. Conclusion and Hints for Future
Research
In this work we applied the GRFAM for assessing the acquisition of the vH levels for geometric reasoning theory. The application of the GRFAM was proved to be very simple, while its conclusions can be easily interpreted.
Other fuzzy assessment methods have been also used in earlier works like the measurement of a system’s uncertainty ([15, 18], etc.), and the application of the fuzzy numbers ([16, 17], etc.). These methods, in contrast to GRFAM which focuses on the corresponding group’s quality performance, measure the group’s mean performance. Our plans for future research include the effort to compare the outcomes of all these methods in order to obtain the analogous conclusions.
REFERENCES
[1] Burger, W.P. & Shaughnessy, J.M. (1986), Characterization of the vam Hiele Levels of Development in Geometry,
Journal for Research in Mathematics Education, 17, 31-48. [2] Freudenthal, H. (1973), Mathematics as an Educational Task,
D. Reidel, Dordrecht.
[3] Fuys, D., Geddes, D. & Tischler, R. (1988), The van Hiele Model of Thinking in Geometry among Adolescents, Journal for Research in Mathematics Education, Monograph 3, NCTM, Reston, VA, USA.
[4] Gutierrez, A., Jaine, A. & Fortuny, J.K. (1991), An Alternative Paradigm to Evaluate the Acquisition of the van Hiele Levels, Journal for Research in Mathematics Education, 22, 237-251.
Information, Prentice-Hall, London.
[6] Perdikaris, S.C. (2011), Using Fuzzy Sets to Determine the Continuity of the van Hiele Levels, Journal of Mathematical Sciences and Mathematics Education, 6(3), 81-86.
[7] Subbotin, I.Ya., Badkoobehi, H. & Bilotckii, N.N. (2004), Application of fuzzy logic to learning assessment, Didactics of Mathematics: Problems and Investigations, 22, 38-41. [8] Subbotin, I.Ya. & Voskoglou, M.Gr. (2014), Fuzzy
Assessment Methods, Universal Journal of Applied Mathematics, 2(9), 305-311.
[9] Subbotin, I.Ya. (2014), Trapezoidal Fuzzy Logic Model for Learning Assessment, arXiv 1407.0823, [math.GM].
[10] Subbotin, I.Ya. (2015), On Generalized Rectangular Fuzzy Model for Assessment, Global Journal of Mathematics, 2(2015), No1, 65-70.
[11] van Broekhoven, E. & De Baets, B. (2006), Fast and accurate centre of gravity defuzzification of fuzzy system outputs defined on trapezoidal fuzzy partitions, Fuzzy Sets and Systems, 157(7), 904-918.
[12] van Hiele, P.M. & van Hiele-Geldov, D. (1958), Report on Methods of Initiation into Geometry, edited by H. Freudenthal, J.B. Wolters, Groningen, The Netherlands, pp. 67-80. [13] van Hiele, P.M. (1986), Structure and Insight, Academic
Press, New York.
[14] Voskoglou, M. Gr. (1999), An Application of Fuzzy Sets to the Process of Learning, Heuristics and Didactics of Exact Sciences, 10, 9-13.
[15] Voskoglou, M. Gr. (2011), Stochastic and Fuzzy Models in Mathematics Education, Artificial Intelligence and Management, Lambert Academic Publishing, Saarbrucken, Germany.
[16] Voskoglou, M. Gr. (2015), Defuzzification of Fuzzy Numbers for Student Assessment, American Journal of Applied Mathematics and Statistics,3(5), 206-210.
[17] Voskoglou, M. Gr. & Subbotin, I.Ya (2016), Fuzzy Numbers: A Tool for Assessment Processes, International Journal of Applications of Fuzzy Sets and Artificial Intelligence, 6, 17-32.
[18] Voskoglou, M. Gr. (2016), Finite Markov Chain and Fuzzy
Models in Management and Education, GIAN Program,
Course No. 16102K03/2015-16, National Institute of Technology, Durgapur, India
[19] Wikipedia (2014), Center of mass: A system of particles, retrieved on October 10, 2014 from
http://en.wikipedia.org/wiki/Center_of_mass#A_system_of_ particles