Computer Science Dissertations Department of Computer Science
8-13-2019
Collaborative Edge Computing in Mobile Internet
of Things
Ravishankar Chamarajnagar
Follow this and additional works at:https://scholarworks.gsu.edu/cs_diss
This Dissertation is brought to you for free and open access by the Department of Computer Science at ScholarWorks @ Georgia State University. It has been accepted for inclusion in Computer Science Dissertations by an authorized administrator of ScholarWorks @ Georgia State University. For more information, please [email protected].
Recommended Citation
Chamarajnagar, Ravishankar, "Collaborative Edge Computing in Mobile Internet of Things." Dissertation, Georgia State University, 2019.
by
RAVISHANKAR CHAMARAJNAGAR
Under the Direction of Ashwin Ashok Phd.
ABSTRACT
The proliferation of Internet-of-Things (IoT) devices has opened a plethora of
opportu-nities for smart networking, connected applications and data driven intelligence. The large
distribution of IoT devices within a finite geographical area and the pervasiveness of wireless
networking present an opportunity for such devices to collaborate. Centralized decision
sys-tems have so far dominated the field, but they are starting to lose relevance in the wake of
heterogeneity of the device pool. This thesis is driven by three key hypothesis: (i) In solving
in-neighbors to identify security threats scales well in large environments; (iii) Given the
abun-dance of data from a large pool of devices with possible privacy constraints, collaborative
learning drives scalable intelligence.
This dissertation defines three frameworks for these hypotheses; collaborative
comput-ing, collaborative security and collaborative privacy intelligence. The first framework,
Op-portunistic collaboration among IoT devices for workload execution, profiles applications and
matches resource grants to requests using blockchain to put excess capacity at the edge to
good use. The evaluation results show app execution latency comparable to the centralized
edge and an outstanding resource utilization at the edge. The second framework, Integrity
Threat Identification for Distributed IoT, uses a new spatio-temporal algorithm, based on
Local Outlier Factor (LOF) uniquely using mean and variance collaboratively across
spa-tial and temporal dimensions to identify potenspa-tial threats. Evaluation results on real world
underground sensor dataset (Thoreau) show good accuracy and efficiency. The third
frame-work, Collaborative Privacy Intelligence, aims to understand privacy invasion by reverse
engineering a user’s privacy model using sensors data, and score the level of intrusion for
various dimensions of privacy. By having sensors track activities, and learning rule books
from the collective insights, we are able to predict ones privacy attributes and states, with
reasonable accuracy. As the Edge gains more prominence with computation moving closer
to the data source, the above frameworks will drive key solutions and research in areas of
by
RAVISHANKAR CHAMARAJNAGAR
A Dissertation Submitted in Partial Fulfillment of the Requirements for the Degree of
Doctor of Philosophy
in the College of Arts and Sciences
Georgia State University
by
RAVISHANKAR CHAMARAJNAGAR
Committee Chair: Ashwin Ashok
Committee: Rajshekhar Sunderraman
Raheem A. Beyah
Zhipeng Cai
Electronic Version Approved:
Office of Graduate Studies
College of Arts and Sciences
Georgia State University
DEDICATION
ACKNOWLEDGEMENTS
This dissertation work would not have been possible without the support of many people.
I want to express my gratitude to my advisor Dr. Ashwin Ashok for the endless hours of
discussions and mentoring and to Dr. Rajshekhar Sunderraman for starting me off on this
path. I want to thank my parents Venkatadasu and Nagarathna, my brother Shreeram and
my sister Savitha for the blessings and the support over the years that have gotten me this
far. My wife Vani has been a constant source of inspiration and motivation through the
entire journey while my kids Rohan and Anushka, with their belief in me, have pushed me
TABLE OF CONTENTS
ACKNOWLEDGEMENTS . . . v
LIST OF TABLES . . . ix
LIST OF FIGURES . . . x
LIST OF ABBREVIATIONS . . . xii
PART 1 INTRODUCTION . . . 1
1.1 Collaborative Edge Computing . . . 1
1.2 Collaborative Edge Security . . . 2
1.3 Collaborative Privacy Intelligence . . . 3
PART 2 COLLABORATIVE EDGE COMPUTING: OPPORTUNIS-TIC MOBILE IOT WITH BLOCKCHAIN BASED COL-LABORATION . . . 4
2.1 Towards opportunistic collaboration . . . 5
2.1.1 Blockchain based collaboration . . . 6
2.1.2 Related Work . . . 7
2.2 Opportunistic Collaborative Platform design . . . 8
2.2.1 Blockchain Overview . . . 8
2.2.2 System Overview . . . 8
2.2.3 System Workflow . . . 9
2.3 Platform Efficiency . . . 12
2.3.1 Experiment setup and methodology . . . 13
2.3.2 App Execution latency . . . 14
2.4 Takeaways and Future work . . . 17
PART 3 COLLABORATIVE EDGE SECURITY: INTEGRITY THREAT IDENTIFICATION FOR DISTRIBUTED IOT IN PRECI-SION AGRICULTURE . . . 19
3.1 Towards Collaborative Security . . . 20
3.1.1 Related Work . . . 22
3.1.2 Background on Mesh Network . . . 24
3.2 Spatio-Temporal locality based Threat detection . . . 25
3.2.1 Local Outlier Factor Algorithm . . . 26
3.2.2 Spatio-Temporal locality based Threat detection algorithm . . . . 27
3.3 Precision Agriculture based Threat Detection . . . 33
3.3.1 Evaluation of the platform . . . 36
3.3.2 Thoreau Dataset Analysis . . . 40
3.4 Takeaways and Future work . . . 42
PART 4 COLLABORATIVE PRIVACY INTELLIGENCE: USER PRIVACY INTRUSION MODELING USING MACHINE LEARNING OF SMART HOME IOT SENSORS DATA 45 4.1 Towards Collaborative Privacy Intelligence . . . 46
4.1.1 Privacy Concerns and Dimensions . . . 47
4.1.2 Related Work . . . 49
4.2 Privacy Dimensional Modeling . . . 52
4.2.1 Localization Overview . . . 53
4.2.2 Emotional Dimension Overview . . . 55
4.3 Privacy Intrusion Quantification . . . 58
4.3.1 Experimental Setup and Methodology . . . 59
4.3.2 Rule based Localization Evaluation . . . 63
4.4 Takeaways and Future work . . . 68
PART 5 CONCLUSION . . . 70
REFERENCES . . . 72
APPENDICES . . . 79
Appendix A SURVEY: THREAT PERCEPTION BY PRIVACY DI-MENSIONS . . . 79
LIST OF TABLES
Table 2.1 HW Configuration of IoT Nodes . . . 13
Table 2.2 Resource Usage before deploying apps – percentage of total capacity
of the node . . . 16
Table 2.3 Resource Usage after deploying apps– percentage of total capacity of
the node . . . 16
Table 3.1 Mean-Variance table. This is an example table for 3 physical sensing
attributes (classes). A new column is appended for each new class.
Each table represents the ensemble mean in time window Td. Here,
mean and variance of sensor data from each of 11 nodes are collected
within the time window. . . 31
Table 3.2 LOF of values from Mean-Variance table in time-window Td. The row
LIST OF FIGURES
Figure 2.1 Opportunistic Collaborative IoT using Blockchains . . . 5
Figure 2.2 System Workflow. Lines in Red are the contributions of this approach 10 Figure 2.3 App Execution Latency . . . 14
Figure 2.4 Collaborative Edge Scaling . . . 18
Figure 3.1 Precision Agriculture Data Integrity . . . 20
Figure 3.2 Our proposed integrity threat identification framework . . . 25
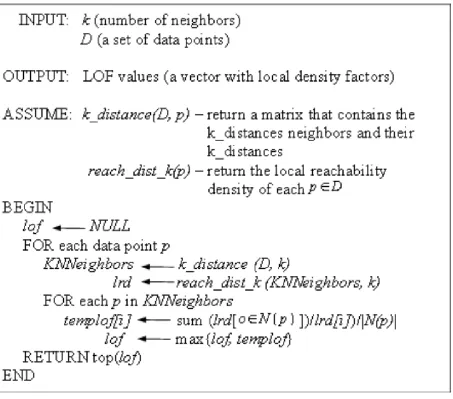
Figure 3.3 Local Outlier Factor (LOF) algorithm pseudocode . . . 27
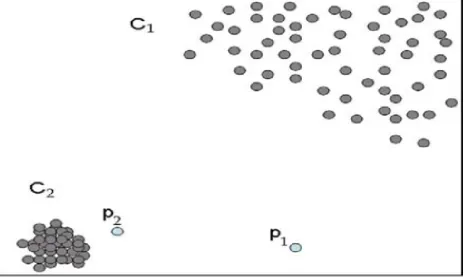
Figure 3.4 Results from Local Outlier Factor (LOF) algorithm . . . 28
Figure 3.5 Sensor Network . . . 29
Figure 3.6 Geometry of sensor placements in a precision agriculture setting (left) and sample LOFs from simulated sensor data for the specific geometry (right) . . . 34
Figure 3.7 Integrity Threat Detection feasibility through LOFs for real sensor data from a wireless mesh network. . . 37
Figure 3.8 Number of threats detected compared to ground truth (blue line) at multiple threshold levels. . . 38
Figure 3.9 Threat detection performance for 100 cycle experiment for 50 nodes (6 nodes physically attacked and 44 nodes virtually attacked by noise addition). . . 39
Figure 3.10 Integrity Threat Detection Classification Effectiveness using ROC curve. . . 40
Figure 3.11 Integrity Threat Detection Classification Performance with Machine Learning . . . 41
Figure 3.12 Thoreau Data Set: Threats by Season . . . 42
Figure 3.14 Threats on 4/1/2017 from 9:30 PM to 11:59 PM at the UC Campus 44
Figure 4.1 A subset of current day smart home devices . . . 47
Figure 4.2 A sample of privacy concerning inferences potentially derivable from smart home sensors. . . 48
Figure 4.3 Threat Perception by Privacy Dimension . . . 48
Figure 4.4 Our SmartHome Privacy Invasion Experimental Framework . . . 52
Figure 4.5 Model to learn the rules from the dataset . . . 54
Figure 4.6 Numerical To Categorical Binning/Discretization . . . 54
Figure 4.7 V/A/D Example - NRC Research Ethics Board (NRC-REB) . . . 56
Figure 4.8 Genre distribution of the EMOBANK corpus . . . 57
Figure 4.9 Function Choice for Dimensions of Emotion . . . 58
Figure 4.10 Image of the Office room setup with Activities . . . 60
Figure 4.11 Image of sensors across the Office room . . . 62
Figure 4.12 Training Schedule . . . 63
Figure 4.13 Ground Truth (Partial) collected during the Training/Learning pro-cess . . . 64
Figure 4.14 Ground Truth (Partial) collected during the Validation process . . 65
Figure 4.15 Evaluation of the Smarthome privacy across Localization parameters 66 Figure 4.16 Results for the Emobank Validation Dataset . . . 67
Figure 4.17 Emotion Survey Dataset Characterization . . . 68
Figure 4.18 Results for the Survey Dataset . . . 68
Figure A.1 Results of the Privacy Intrusion Importance survey . . . 81
LIST OF ABBREVIATIONS
• GSU - Georgia State University
• CS - Computer Science
• WSN - Wireless Sensor Network
• IoT - Internet of Things
• ISP - Internet Service Provider
• DNS - Domain Name System
• STP - Stochastic traffic padding
• CI - Contextual Integrity
• ABC - Affect, Cognition and Behaviour
• VAD - Valence Arousal Dominance
• RIPPER - Repeated Incremental Pruning to Produce Error Reduction
• NLP - Natural Language Processing
• NRC - National Research Council
PART 1
INTRODUCTION
Internet-of-Things (IoT) has created huge opportunities and challenges in compute,
security and our ability to drive intelligent insights with data from the fleet of heterogenous
devices. Collaboration among devices at the Edge in all these areas is the path forward
as we scale beyond the compute capabilities of centralized infrastructures and bandwidth
of networks. Collaboration in each of these areas mean the use of different resources or
intelligence. Collaboration on compute translates to sharing compute resources and services,
while collaboration in detecting security threats translates to sharing information about
context and federated learning implies driving decentralized intelligence with smaller subsets
of data in order to preserve data privacy. Lets explore each of these in more detail in the
sections below.
1.1 Collaborative Edge Computing
IoT is leading the way to a world of smart systems, applications and services powered
by mobile devices. Cloud based mobile IoT is paving the way for a large number of emerging
applications and computing platforms. One of the key challenges in realizing mobile IoT
systems using current day cloud solutions is the heavy dependence on centralized cloud
infrastructures. Such centralized solutions are necessary to address the large scale of IoT,
however, the performance of such systems degrade with the wireless network connectivity
between the device and the cloud. Also, with the growing need for data creation, access
and storage, the network backbones will be inundated with data if they try to handle every
IoT application and service request using centralized data centers. This dependency on a
centralized architecture can lead to performance degradation and eventually unreliability in
We propose the idea of opportunistic collaboration among mobile IoT devices [1] to
share their services and excess computing resources. Opportunistic collaboration among
devices over wireless networking requires proper coordination and agreements among the
devices in a purely distributed manner. To facilitate the distributive collaboration, we
pro-pose a decentralized architecture design using blockchain technology. Through experimental
evaluation of a prototype collaborative mobile–IoT system involving RaspberryPis and a
Dell IoT edge gateway, we show that our proposed distributed collaborative approach is
fea-sible and comparable to a non–collaborative edge–computing based approach from a latency
perspective.
1.2 Collaborative Edge Security
As noted earlier, IoT paradigms have created, in addition to opportunities, a huge
void in security. Although there are multiple works that explore security through device
identification, cryptography and network security protocols, the question of can we trust the
integrity of things to represent reality or precisely, can we trust the data and the metrics
being sent by things, remains largely unanswered in distributed wireless scenarios. Given
the rapid pace of adoption of IoT, being able to trust data from each of these devices is
extremely important, but no systems exist today that can help us categorically state that
data from these devices can be trusted. Designing such a system is challenging given the
number of threat vectors and device types. Moreover, the problem becomes harder in a
wireless sensor networking scenario, especially in harsh environments, due to the potential
avenues for spoofing and physical attacks. Reliance on centralized algorithms to identify
these integrity threats is impractical given the scale and dynamism of the environment.
We explore conditions or threat vectors under which a wireless network of devices may
become unreliable in a fully distributed setting, and present an approach to identify potential
integrity failures or threats using a collaborative approach that makes use of spatial and
temporal locality to understand context [2]. We present the effectiveness of our approach
and trace–based simulations, we show that threats can potentially be identified in real–time
with 80% accuracy and at about 90% precision and recall.
1.3 Collaborative Privacy Intelligence
The IoT devices have become the eyes and ears of the physical environment. Rich user
interactions and powerful sensors at the Edge mean they have access to an unprecedented
amount of data, in some cases, private in nature. Models learned on such data hold the
promise of greatly improving usability by powering more intelligent applications instead of
learning on purely consolidated data. There may be risks and responsibilities to storing it
in a centralized location when the data is private. Given the abundance of data from a
large pool of devices with possible privacy constraints, collaborative learning drives scalable
intelligence.
With Collaborative Privacy Intelligence, we aim to understand privacy invasion by
re-verse engineering an individual’s posture using derived insights from the sensors’ data, and
quantify the level of intrusion based on a generated ruleset for Localization and Emotional
dimensions of privacy [3]. By having sensors track activities in these dimensions, like sitting
and working at a desk, or being Optimistic(happy and surprise), and learning rule books
from the collective insights, we are able to predict ones privacy attributes, an individual’s
PART 2
COLLABORATIVE EDGE COMPUTING: OPPORTUNISTIC MOBILE IOT
WITH BLOCKCHAIN BASED COLLABORATION
The pervasiveness of the Internet–of–Things (IoT) is leading the way to a world of
smart systems, applications and services powered by mobile devices. Cloud based mobile
IoT is paving the way for a large number of emerging applications and computing platforms.
One of the key challenges in realizing mobile IoT systems using current day cloud solutions
is the heavy dependence on centralized cloud infrastructures. Such centralized solutions
are necessary to address the large scale of IoT, however, the performance of such systems
degrade with the wireless network connectivity between the device and the cloud. Also,
with the growing need for data creation, access and storage, the network backbones will
be inundated with data if they try to handle every IoT application and service request
using centralized data centers. This dependency on centralized architecture can lead to
performance degradation and eventually unreliability in mobile IoT systems.
Even as we move towards Edge Computing for IoT workloads to counter computational
inefficiencies and network limits with cloud based architectures, the fact that mobile IoT
machines are getting smarter and more powerful is encouraging. IoT devices are getting
packed with resources such as sensors, computing, I/O, etc. However, these resources are
being completely underutilized as most of them are used only for a certain duration for
specific applications. For instance, a smartphone with quad–core processors has more
com-puting power and storage than necessary for an average daily usage which mostly involves
access to text and emails; a smart printer in an office is largely in sleep and usually handles
jobs in aperiodic chunks; a smart TV is used more in the evenings at homes. The scenario
applies to services available on devices as well. For instance, printer services and camera
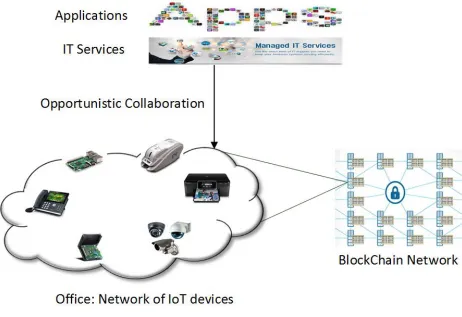
Figure (2.1) Opportunistic Collaborative IoT using Blockchains
resource and service capacity available in mobile IoT devices at the Edge opening up a huge
opportunity for sharing them across all available nodes, in a paradigm that we would term
as the Collaborative Edge. In this regard, we propose a system design for better utilization
of resources and services in mobile IoT through opportunistic collaboration at the Edge.
2.1 Towards opportunistic collaboration
As we look to address the above issues with network reliability, and resource and service
underutilization, we realize the need for opportunistic collaboration of IoT devices to share
resources and services when they are available. Opportunistic collaboration becomes
neces-sary as application offloading to the cloud may not always be possible due to bandwidth and
latency concerns. Also, the problem gets worse at scale. We seek to improve computational
[image:21.612.74.536.72.389.2]execute applications and services closer to the devices, at the edge. Improving computation
efficiency through collaboration coupled with the opportunistic usage of unused capacity
in devices and at the edge, motivates our proposed opportunistic collaborative mobile IoT
design. The proposed solution uses the well–known paradigm of blockchains to facilitate the
collaboration, as illustrated in Figure. 2.1.
2.1.1 Blockchain based collaboration
We present a novel collaborative mobile IoT architecture that lets mobile IoT devices
come together in an adhoc manner, advertise their excess resource capacity and offered
services using the blockchain framework. The collaborating devices are connected through a
blockchain network that manages data dissemination in the network. The system usessmart
contracts to advertise excess resources and network capacity, which are synchronized across
a global network of blockchain nodes. These contracts are binding in nature and transparent
to the network of nodes participating in the blockchain. Resources are made available to
the seeking devices through containers (e.g. docker) so that applications can be executed
in a sandboxed fashion and do not need rooting the device. Services are made available
through peer–to–peer (P2P) communication protocols. Here, services can be those initiated
by apps or broad IT infrastructure based services that cater to diverse applications and other
dependent services.
This approach lays the foundation for a distributed computing solution for mobile IoT
that lets one opportunistically use excess capacity on resources and services. In essence, our
proposal is a distributed middleware design that leverages blockchain technology for smart
resource/service discovery, coordination and management.
In summary, the key contributions of this solution are:
(i) Design of a distributed mechanism to allocate resources and execute services through
smart blockchain contracts and application execution on sandboxed containers,
(ii) Implementation of a prototype collaborative mobile IoT system on Raspberry Pis
(iii) Evaluation of network latency and benchmarking resource utilization under
col-laboration.
2.1.2 Related Work
We discuss related works from the areas of resource abstraction platforms, resource
lookup algorithms, distributed resource sharing platform and service invocation platforms.
Ardalan Amiri Sani et. al. [4], proposed an architecture RIO, for the abstraction of
resources using a separation of the application layer from the operating systems services
and kernel layer. Their approach addresses the specific area of resource abstraction with
cross memory mapping. Daniel J. Dubois et. al. [5], proposed a middleware ShAir, for
P2P resource sharing. It elaborates on the abstraction of resources using an event bus.
While the approach addresses resource abstraction, it does not address specifically the adhoc
networking and resource registry aspects. Ion Stoica et al. [6] discuss the approach of P2P
lookup of Internet applications. It uses a distributed lookup protocol that helps map a given
key to a node with the right content and efficiently handles the dynamic registration and
exits of the nodes in the network. Salem, et.al, [7] have proposed a mechanism for sharing
resources at the edge. It uses registries and a central mediation to choose the right resources
based on demand. Also, they introduce the concept of compensation for the resources used.
IBM and Samsung [8] have brought together in a proof of concept, the blockchain as
a repository of assets, their artifacts and related services, along with the P2P fabric using
Telehash that enables discovery and communication. This is testament to the fact that
decentralized IoT is permeating the industry and there is a perceived need for it in the
near term. One of the key aspects to fully realize it is the flexibility to execute any apps or
services on any device using any resource in the pool. SingularityNet [9] has brought together
multiple AI services talking to each other to drive synergies from a decentralized AI. The
underlying platform to support this level of communication is a decentralized system on
blockchain that support services and apps. The group led by Prof. Bhaskar Krishnamachari
the decentralized platform to advertise, discover and instantiate services and apps using
blockchains is key to materializing highly sophisticated concepts in diverse areas.
Our proposed architecture helps provide a one–stop solution to: (a) Sharing of system
resources and services, (b) Decentralized mediator and decision making, and (c)
Compensa-tion for sharing. While such features have been discussed in many technologies and research
works before, combining all into a single entity framework has not been well explored.
2.2 Opportunistic Collaborative Platform design
2.2.1 Blockchain Overview
Blockchain is a distributed database for an active list of records called blocks. Each
block contains a timestamp and a link to a previous block making blockchain a chronological
sequence of blocks with all transactions recorded up to that point in time. Just as
transac-tions execute, they are mined, validated and added to blocks to be synchronized with the rest
of the blockchain network. A blockchain serves as an open, transparent distributed ledger
that can record transactions between parties efficiently and in a verifiable and permanent
way. The ledger hosts transactions and smart contracts that can be triggered and executed
automatically in software. A smart contract is a computerized transaction protocol that
executes the terms of a contract. All of its code and data are housed in the blockchain and
synchronized across the network.
2.2.2 System Overview
The core of this design is a distributed middleware that enables collaboration of mobile
IoT elements using the capabilities of blockchain network. The blockchain framework helps
to advertise, disseminate and make resources and services available to the network of IoT
devices. Our design focuses on a localized blockchain network of nodes. We position that
each network of IoT devices can form a small blockchain network that can expand organically
as more devices are registered into this collaborative network. It also provides a virtual
on a global scale.
As shown in Figure. 2.1, there are two key elements that comprise this distributed
architecture: (a) applications and services that require resources, (b) distributed collection
of IoT elements (devices and machines) with resources to share. Here, the IoT elements
are termed as the collaborating nodes. Discovery of services and resources (computing and
storage), consent for collaboration, invocation of services and allocation of resources are done
usingsmart contractsthat are deployed by each of the collaborating nodes in the blockchain.
These contracts contain information of the list of available services and resources on each
node. Through the blockchain framework these contracts are shared among all the nodes in
the network.
A subset of the blockchain nodes, designated (through consensus) as miners, create
and update smart contracts across the blockchain. For example, in an office room scenario
of a collaboration network of a phone, printer, laptop, smart voice assistant and smart
thermostat, the device with the highest computing power can be designated as the first
miner. In essence, every device in the network can be designated as the miner. The downside
is that the information dissemination time would increase as synchronization of each contract
update will have to percolate through each miner node and arrive at a consensus. Depending
on the number of miners the convergence can take few seconds to minutes. On the other
hand, less number of miners will put a heavy load on a few miners. This lends itself to an
interesting trade off between miner count and resource availability.
2.2.3 System Workflow
The blockchain setup is a one–time process that involves all the mining and collaborating
nodes. Here, we particularly focus on the collaborative execution process and not on the
setup process. The setup process is analogous to setting up any IT infrastructure where
registration of devices and information routing is checked through template test benches. In
the office room example discussed above, the setup process is equivalent to registering the
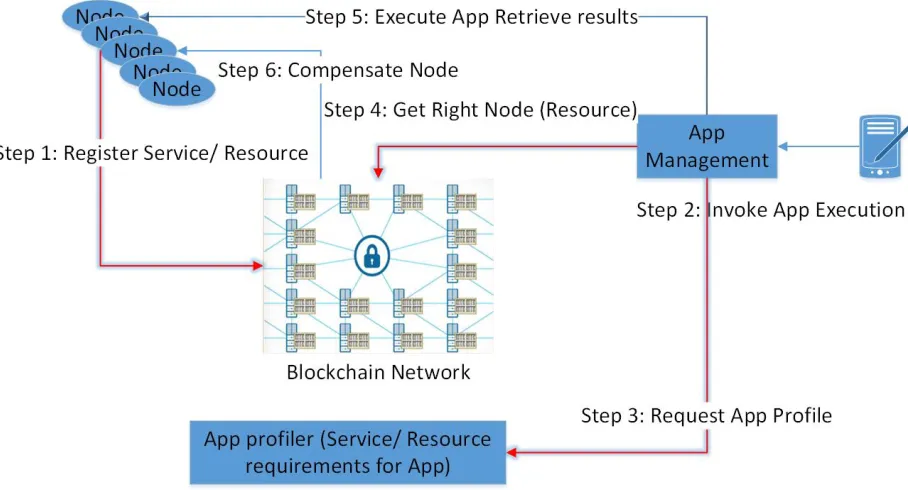
Figure (2.2) System Workflow. Lines in Red are the contributions of this approach
we discuss the design details of the execution workflow of the process that happens once
a blockchain is setup and that a resource requirement is found in the network. How the
network of nodes collaborate among themselves in a distributed manner to help each other
achieve their tasks (applications and/or services) is the key notion of this workflow design.
We discuss this workflow in more detail using the illustration in Figure. 2.2. Note that
this framework does not implement any new security measures, but inherits the security
guarantees provided by the Blockchain and the underlying wired/wireless network.
(Step 1) Service and Resource Registration. Any node with resources or services to
offer registers the resources and/or services with the smart contract deployed in its blockchain
network. The contracts contain resources and services available for rent/lease along with
their cost and node identity in an encrypted manner. When the resources are advertised,
they are recorded along with the identity of the node offering the same. This minimizes the
resource discovery time as it accounts for locality in addition to keeping fragmentation to
a minimum. Once a resource or service becomes available, it goes through a dissemination
[image:26.612.81.535.72.317.2]state of the transaction, it gets synchronized with the rest of the blockchain that involves
mining of the transaction, creation of a block and subsequently synchronization with the rest
of the blockchain cluster. As the technologies move closer to autonomous operations, it is
extremely important for resources and services to be discovered when needed. Having them
on the blockchain makes them immediately available and easy to audit, two key aspects as
we look into distributed autonomous systems.
(Step 2 & 3) Application Profiling. Once an application is kicked off, a typical
appli-cation management system profiles the apps for its required and excess resources. It also
acquires the list of services that might be invoked as part of the execution cycle of the apps
and some of these services might be spread across the network. The apps and services to
profile are invoked through an automated triggering process during the contract preparation.
(Step 4) Resource Allocation. Once distributed or queued for execution, the edge
com-puting units check for the availability of the resources and/or services necessary to execute
the apps and services. These edge units can be a single edge computer or a collection of
nodes in the blockchain at the edge of the network. If the edge units do not have sufficient
computing resources as requested in the contracts the request is turned to the blockchain
nodes to execute the apps and services. Selection of the blockchain nodes to execute the
apps and services comprises the resource allocation phase. Any traditional resource
alloca-tion mechanism that optimizes for latency based on available computing resources works in
this case. However, the adhoc and distributed behavior of the blockchain approach simplify
the resource allocation process to a simple resource matching process by comparing
con-tracts. This is possible because the contracts are agreed upon based on consensus and all
collaborating nodes are informed of every other node’s resource requirement and availability.
This execution is analogous to pairing and agreement among the collaborating IoT devices
in the office scenario to help each other with resources to execute the apps pertinent in the
network. In the event, the nodes in the network do not have excess resources exposed for use,
(Step 5 & 6) Execution and Compensation. Once the node with the available resources
is acquired the app is executed and the results gathered. App/service execution is done in
sandboxed containers that get deployed in the blockchain nodes during the execution process.
As we will describe later, our prototype system usesdocker[11] containers, however, any type
of sandboxing solution will work. In addition to satisfying the service and resource demands,
it matches the rental price with the price the requesting entity is ready to pay for the resource
or the service. Once either one is granted to the requesting entity, the node renting them is
compensated for it with cryptocurrency (e.g. bitcoin [12], ethereum [13]).
Note the distinction between ‘initiation’and ‘invocation’; initiation of the app/service
involves Resource discovery while invocations refer to execution which is instantaneous. For
instance, deploying an HTTP service (initiation) versus accessing webpage using HTTP urls
(invocation). Service invocation takes on a lot more importance in solutions that tie them
together by cascading them and getting results to be fed as inputs to the next set of services.
SingularityNet [9] has set an example of cascading the artificial intelligence services so they
no longer as just speech or text AI services, but services that work in tandem to create a
coherent solution. Such examples make a compelling case for the need of our decentralized
collaborative platform.
2.3 Platform Efficiency
We conducted experiments using a prototype implementation of our proposed system
to evaluate the feasibility and benefits of the collaborative approach. We use latency and
resource utilization efficiency as the metrics for our evaluation, where
• App Execution Latency is defined as the time it takes for all steps in the workflow
in-cluding the latency for resource procurement, transfer and deployment, and initiation.
This is equivalent to user response time or service delivery time.
• Resource Utilization Efficiency is defined as a combination of the dissemination
blockchain network and the procurement efficiency to allocate resources to the
re-questing entity.
2.3.1 Experiment setup and methodology
We set up a blockchain network with 4 nodes forming a private network which are set to
mine transactions and blocks, each on a single thread. The setup comprises 3 Raspberry Pi3
and a Dell 5100 IoT gateway, all of which have resources to spare (x RAM, y CPU cycles,
z storage) and services available that are advertised on the blockchain as part of a contract
with appropriate usage costs. Any app that wants to use these resources and/or services will
need to request and acquire a handle to them and compensate the offering node. The nodes
each have (pseudo) accounts set up to receive compensation for mining, resources leased and
services invoked through pseudo cryptocurrency. Table 2.1 outlines the configuration of the
Raspberry Pis and the Dell gateway. Four containerized apps on Docker [11] with different
data and storage requirements and execution priorities are used as sandboxes for executing
the apps and services. All experiments were conducted in an office room environment with
the 3 Raspberry Pi nodes and the Dell edge gateway placed in the same local area network
within 5m radius.
Nodes RAM(GB) Storage(GB) CPU
Raspberry Pis 1GB LPDDR2 32GB microSD 4x ARM 1.2GHz
Dell5100 GW 2GB DDR3L-1067MHz 32GB SSD Intel E3825 1.33GHz
Table (2.1) HW Configuration of IoT Nodes
We deploy 4 containerized apps using our architecture and they are set to be available as
services in our prototype system. A Java program that simulates App Manager and Profiler
invokes the blockchain contract to procure resources to invoke services. This setup helps
evaluate the effects of sharing resources and services on the network. The containerized apps
we use for our evaluation are:
• busybox httpd: a full-fledged web server: size: 3.1 MB
• mysqld: a mysql database: size: 190MB
• dockerui: UI for docker management: size: 4.5 MB
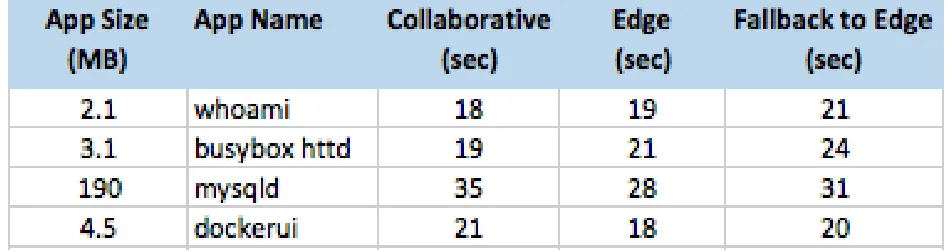
2.3.2 App Execution latency
Figure (2.3) App Execution Latency
We consider 3 aspects when evaluating app execution latency: (a) Resource
procure-ment, (b) App deployprocure-ment, and (c) App invocation. We will compare these steps for our
proposedCollaborativeapproach, purely computing onEdgeand joint edge and collaborative
when the system will Fallback to Edge when the resources are not available in the
collabo-rating nodes. Here, edge implies a monolithic powerful edge with compute capabilities closer
to the source of data, and our solution implies an “Elastic Edge” with multiple nodes
col-laborating. The Edge is not opportunistic and all resources necessary for the execution of
apps and services have to be provisioned at the Edge when the app/service is initiated.
We observe from Figure. 2.3 that our collaborative system’s execution latency is
compa-rable to that of a purely centralized Edge computing system. This shows that a collaborative
distributive approach to mobile IoT is feasible. We also note that the collaboration may not
necessarily provide all resources requested, in which case the system is able to fallback to the
edge. We can observe that the fallback to edge approach has a minimal overhead as resource
discovery time is very small in the blockchain based architecture due to the information
[image:30.612.68.544.210.336.2]Note that in our setup the Edge was placed in the same local network within a 5m radius
of the collaborating nodes. The latency for app setup phase will scale with the distance
between the requesting nodes and the edge unit. In a separate benchmark experiment, we
observed a network latency (cellular) of the order of 50ms for an Edge computing device
placed 10 miles away from the experiment office location. In the collaborative approach, the
apps are present and available on the local network. It is important to note that once the
resource is procured for a service app, it is available instantaneously for all other user apps
that access the service.
The app execution latencytAE is the cumulative sum of the resource procurement time
tRP, app deployment time tAD and app initiation time tAI. The app deployment time is a
function of transmission rate and app size and the app initiation time is transmission latency
coupled with message processing time to procure a resource handle. The procurement time
is the same as the time it takes for the replicas to reach consensus on when a resource has
been released for use or reacquired into the pool. The slope is dependent on a few factors;
proportional to the queuing delay at each replica in a bigger network (>4 replicas) and
inversely proportional to the transmission delay (increased transmission delay offsets the
queuing delay at each replica).
The 3 latency measures can be expressed as,
tRP = (slope∗nreplicas) +b;slope =a∗
tqueue
ttrans
(2.1)
where,aandbare empirically measured constants that account for network factors that
impact performance and compute capacity of nodes in a heterogeneous network, respectively.
tAD =
sizeapp
ratetrans
;tAI =ttrans+tmsgprocess (2.2)
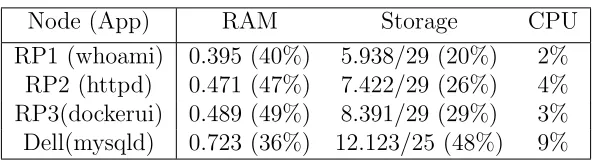
2.3.3 Resource Utilization Efficiency
In contrast to our proposed collaborative approach, a purely edge computing
resource usage of the 4 nodes in our network, and Table 2.3 shows the resource usage after
deploying the apps using our collaborative model. We can observe from the usage statistics
that collaborative approach enables to allocate resources through a proper matching of
avail-able with requested. In our test case, we ensured that the resources required for the 4 apps
are available in the collaborating nodes. In reality, the system will have to fall back to the
edge or cloud in case the resource is not available. However, the collaboration presents a first
hand opportunity to run the applications and services merely through mutual agreements
and only approach the central edge/cloud units when no agreements can be reached. Due to
the distributive nature of blockchains, such a case is rare as finding at least one node that
has the available resource has a non-trivial probability.
Node RAM Storage CPU
RP1 0.381 (38%) 5.922/29 (20%) 2%
RP2 0.329 (33%) 7.271/29 (25%) 2%
RP3 0.421 (42%) 8.372/29 (29%) 2%
Dell 0.597 (30%) 11.383/25 (46%) 3%
Table (2.2) Resource Usage before deploying apps – percentage of total capacity of the node
Node (App) RAM Storage CPU
RP1 (whoami) 0.395 (40%) 5.938/29 (20%) 2% RP2 (httpd) 0.471 (47%) 7.422/29 (26%) 4% RP3(dockerui) 0.489 (49%) 8.391/29 (29%) 3% Dell(mysqld) 0.723 (36%) 12.123/25 (48%) 9%
Table (2.3) Resource Usage after deploying apps– percentage of total capacity of the node
To understand the resource utilization better we discuss a use–case to highlight the
benefit of the collaborative approach: A gaming app needs resources from multiple nodes as a
single node does not have the required resources. The request has to be supported by multiple
nodes with partial resources. Suppose the request is for 200 MB of memory, a camera and a
[image:32.612.158.454.479.559.2]different nodes and camera and microphone from individual nodes. However, the caveat here
is that the app must be able to accept resources from multiple sources. E.g. an application
that requires camera and microphone at the same location may not benefit, however, it
can resolve to find a node that offers the RAM while using the camera and mic from a
different node. Our framework supports such a management of resources. Our distributed
model allows for handling heterogeneous set of resources from physically separated entities,
which gets complicated using traditional central resource allocation techniques. This is made
possible through the use of blockchain.
2.4 Takeaways and Future work
In this chapter, we explored the idea of an opportunistic collaborative resource sharing
for mobile IoT systems. We designed a novel architecture that uses blockchains for
col-laboration and developed a mechanism that opportunistically identifies available resources,
advertised services and invoked or utilizes them based on a collaborative consensus. We
implemented a preliminary prototype of a 4node collaborative IoT network along with an
edge computing gateway. Through experimental evaluation, we showed the feasibility of the
collaborative architecture with overall app execution latency comparable to the traditional
centralized edge approach and a much better resource utilization.
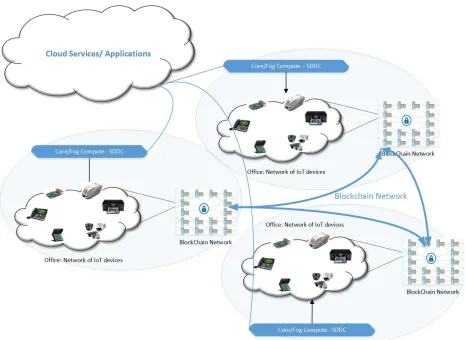
This model can be used further to explore larger scale collaborative blockchain networks
as outlined in our work on 5G IoT in a book chapter [14]. Although a detailed empirical
study of scale is out of scope of this chapter, here’s how a scaled collaborative edge-computing
5G mobile IoT platform is expected to evolve. The Edge, in addition to collaboration with
localized nodes outlined here, will interact with Fog or Core nodes. These Core nodes
are analogous to small data centers and have the necessary compute, storage and network
capabilities to run substantial workloads. These Core nodes will also take advantage of
architectural advances made with 5G, like NFV, Network Slicing and SDDC. To complete
the end-to-end flow, these core nodes will connect back to the Cloud for any central updates,
and service coordination will evolve into a more sophisticated architecture with localized
structural boundaries with more frequent synchronization that fits into a more globally
distributed structure. On these blockchain nodes, although resource/service procurement
times on a small network with little transmission delays are found to vary linearly with the
number of nodes, queueing delays play a huge role in bigger networks driving consensus
times higher making it important to profile and optimize the blockchain network for the
workloads we are interested in. Although empirical evidence from this chapter shows an
ideal fit in localized networks like office buildings, store locations, or industrial floors, this
scaled architecture over 5G with Edge Computing and Blockchain based collaboration would
be ideal for any complex IoT workloads.
[image:34.612.74.540.310.650.2]PART 3
COLLABORATIVE EDGE SECURITY: INTEGRITY THREAT
IDENTIFICATION FOR DISTRIBUTED IOT IN PRECISION
AGRICULTURE
Despite lack of trust, the show must go on! The IoT Value/Trust Paradox survey
in 2017, [15] of 3,000 consumers found that 53 percent of respondents believed that Internet–
of–Things (IoT) devices make their life easier, but only 9 percent have a high level of trust
that their data collected and shared via IoT is secure. Despite the low levels of trust, 42
percent of respondents report they were not willing to disconnect their IoT devices, even
temporarily, because they bring sufficient value to them. These numbers attest to the fact
that IoT devices have become so integrated into human lives that it is almost impossible
to imagine disconnecting from the world of IoT – meaning that trust, or lack of it, hardly
seems to impact IoT adoption.
With consumers finding it increasingly difficult to disconnect, the only practical way to
support adoption of IoT is with stronger security policies and by being transparent about
data being used. To do so, one of the key factors for understanding is the potential for
failures or precisely, the threat vectors. Two key areas for threat vectors figure prominently
in IoT deployments: (i) ones that arise from device malfunctioning, (ii) ones that arise from
(malicious) user–driven attacks or control changes. It is the ignorance or opaqueness in our
current IoT system designs to such fundamental threats that brings about the question of
validity of the data being sampled on each of the devices in the IoT network. An exhaustive
list with reasoning on why devices become untrustworthy over time has been outlined in
[16].
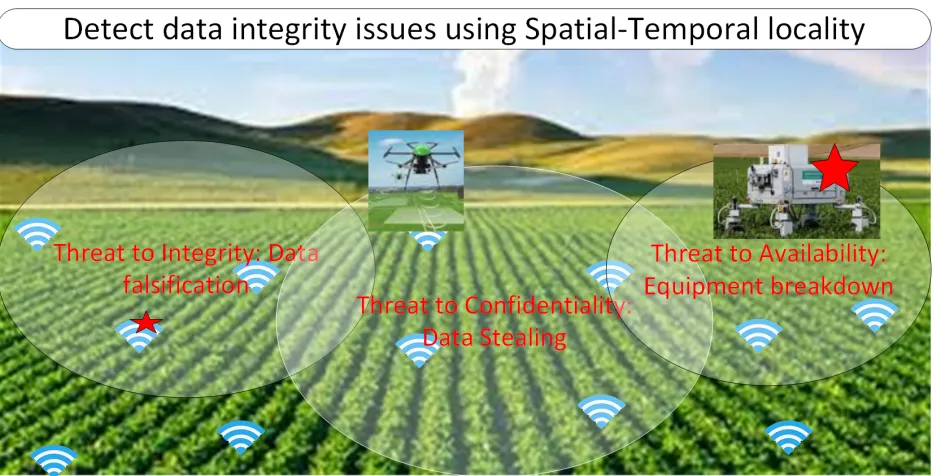
Data trustworthiness in precision agriculture: To get an exemplar sense of the
Figure (3.1) Precision Agriculture Data Integrity
agriculture. The US Department of Homeland Security outlines three broad categories of
threat vectors [17] for precision agriculture:
(a) Threats to Confidentiality: This attributes to the concern in loss of data privacy
of the farmers and potential reputation loss for the collaborating hardware and software
manufacturing companies.
(b) Threats to Integrity: This attributes to the concern in potential falsification of data
and introduction of rogue data into the devices/network, including sensor failures in harsh
conditions (watering/flood, tractor weight, high/low temperatures).
(c) Threats to Availability: This attributes to the concern in potential unavailability of
equipment and other cyber–related outages including natural disasters. This is key because
farming and livestock operations largely depend on specific equipment and tools.
3.1 Towards Collaborative Security
To this end, in this paper, we focus on addressing the Threats to Integrity problem. In
[image:36.612.74.542.71.309.2]data in a distributed set of wireless networked sensors. The threat identification in prior
research have primarily focused on identifying unidentified or authenticated nodes or devices
on the network or profiling them based on characteristics that are either static or predictable.
Once identified and authenticated in one of the numerous ways, nodes are entirely trusted
and values from them are acted upon and propagated. However, it is entirely possible for
any malicious player with physical access to or in physical proximity to the network to
tamper with either the device or the conditions, making it essential to identify these data
integrity issues among a set of authenticated sensor nodes. As outlined by the DHS [17],
threats to Integrity are real, have a huge financial impact and remain unresolved at this
point. We explore and evaluate this in the context of Precision agriculture that employs a
distributed mesh sensor network due to the extensive real estate that needs to be monitored
and maintained at a reasonable cost. The sensors on the network are often connected via
cellular, Bluetooth, or Wi-Fi networks and rely on edge computing to make decisions at
the source. The solution entails the use of spatial and temporal locality of sensors on the
distributed network to detect data integrity threats as shown in Figure. 3.1.
To solve the threat identification problem we design a new spatio–temporal aware
in-tegrity algorithm that detects potential threats in a set of sampled data and quantifying
through a threat score metric. The core idea of this algorithm is based on using the Local
Outlier Factor (LOF) technique to identify outliers in a dataset through a clustering
mech-anism. The uniqueness of our approach is to involve the spatial and temporal distribution
of the sensor values in a unified manner for threat considerations. In this approach,
sen-sors within a local window (finite geographic range and sampling time window) are set for
threat investigations periodically, and this activity is duplicated across all the sensors in the
deployment. This means that the threat identification algorithm will run on each sensor
device and will work with data points from neighbor sensors within spatial vicinity. We
design our system using the analogy of a mesh network topology in a farm setting, and setup
experiments and simulations in such a setting to evaluate the effectiveness of our proposed
3.1.1 Related Work
It is noteworthy that our problem in question is fundamentally different from traditional
network security issues which have a long history of solutions through cryptography. Security
checks for devices have long been done through attestation methods that conduct a check
on the identity of the device. This is the closest form of integrity threat check that relates
to validating the integrity or trust of actual data from the device.
Hardware based or binary attestation is based on binaries that have been executed on
the execution platform. TPM [18] is a co-processor designed to protect cryptographic keys
and record software state of a computing platform by using a set of special-purpose Platform
Configuration Registers (PCRs). Each PCR stores a single cryptographic hash which can
be read by external software. The concept of a Dynamic Root of Trust for Measurement
(DRTM) [19] was introduced to address the issue of static PCR read sequence, by allowing the
chain of measurements to begin at a user-defined point in the platforms operation. Software
Guard Extensions (SGX) [20] provide a hardware-enforced isolated execution environment
(an enclave) for application software. The enclave provides a means of attesting software
inside the enclave to other enclaves. Binary attestation is brittle as any configuration changes
or upgrades result in different hashes of binaries, even if the platform remains in a trustworthy
state, leading to high false positives in flagging threats in a wireless sensor network.
Software based attestation verifies integrity of resource-constrained embedded devices
which have no hardware security features to store secrets for attestation. It exploits side–
channel information, such as precise time needed by the prover to perform specific
compu-tation. Limitations include strong assumptions about adversarial capabilities, and this only
works if the verifying entity communicates directly with the proving device, with no
interme-diate hops. However, multihop paths are unavoidable to ensure end–end threat identification
over a distributed wireless sensor network.
Hybrid attestation While binary (hardware) attestations are impractical in most
to work with. Below are some hybrid approaches that address challenges with binary and
software attestations.
(a) Minimal Trust Anchors: The SMART architecture [21] provides a dynamic root of
trust for low-end devices without specialized memory management or protection features.
(b) TrustLite [22] is a generic security architecture for low-end embedded systems. It
allows OS-independent isolation of specific software modules, called trustlets. TrustLite
introduces the Execution-Aware Memory Protection Unit (EA-MPU) as a generalization of
simple means of memory protection, such as SMART.
(c) Physical Utility Functions (PUF): A PUF[23] based system that maps a set of
challenges to a set of responses based on the underlying physical micro structure of the device.
PUFs are equivalent to a fingerprint for the hardware element in the device, potentially
identifying the device through specific measures. It has been shown that radio signals’ RSS
(received signal strength) [24] can be used to identify a transmitting party. PUF and wireless
link fingerprints ensure that the data is coming from the stated IoT device and from the
stated location [25]. However, the key challenges of PUFs are that they hard to implement
and are very technology specific..
(d) Based on Sensor and Process Noise: A combined fingerprint for sensor and process
noise is created during the normal operation of the system as outlined in Noiseprint [26].
Under sensor spoofing attack, noise pattern deviates from the fingerprinted pattern. To
extract the noise difference between expected and observed value, a representative model
of the system is derived and the Kalman filter is used for state estimation. This method
performs device identification and profiling of normal operating range for comparison against
compromised profiles. However, it requires pre–calibration of each sensor setup to obtain
fingerprints for filter modeling, which can be unrealistic in a farm or large scale settings.
(e) Based on PUF data signing: Trusted sensors, as outlined in [23], offer integrity,
authenticity and non–repudiation guarantees on the sensed data by leveraging PUFs as root
of trust. This is done by having the sensor firmware sign the data, and integrity of the
typical low-end sensor hardware and does not require any hardware modifications. Although
applicable to standalone sensors, it is complex and cost prohibitive.
Although all of the above hybrid mechanisms help with authentication at a cost, they
fall short of validating the data and identifying any kind of anomalies in data from distributed
network of devices.
3.1.2 Background on Mesh Network
Before we discuss the proposed threat identification system architecture, we briefly
review the traditional knowledge of mesh network design. This is to ensure consistency in
the understanding of the type of network topology we chose for our design explanation and
evaluation.
Our proposed mechanism depends on the network establishment and routing details of
the Open Thread protocol [27] for mesh networks. Although we use the Thread network for
our evaluation, the framework is generic to any distributed network. The below device types
are included in a Thread network:
– Border Routers provide connectivity from the 802.15.4 network to adjacent networks
on other physical layers (Wi-Fi, Ethernet, etc.). These routers have special characteristics
like multiple interfaces. There may be one or more of these on the network.
– Thread Routers provide routing services to network devices. Thread Routers provide
joining and security services for devices trying to join the network. The Routing Enabled
End Devices (REED) can become Thread Routers, but not Border Routers.
– A Leader manages membership to the network and roles of the nodes. It maintains a
registry of assigned router IDs and accepts requests from router-eligible end devices (REEDs)
to become routers. The Leader, like all routers in a Thread network, can also have
device-end children. All information contained in the Leader is present in other Thread Routers so
that if the Leader fails or loses connectivity with the network, another Router is elected to
– End devices that are not router-eligible can be either FEDs (full end devices) or MEDs
(minimal end devices).
The Thread Mesh Link Establishment (MLE) [28] protocol establishes a network,
con-figures links and disseminates information about the network. Also, It is used to discover and
establish links to neighboring devices, determine their quality, and negotiate link parameters
with peers.
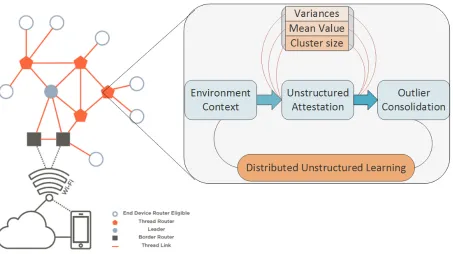
3.2 Spatio-Temporal locality based Threat detection
Figure (3.2) Our proposed integrity threat identification framework
We define a mechanism to detect threats using cluster based outlier detection techniques
and spatio–temporal locality based parameters. The scope of our contribution in this design
is that our technique opens up a new way to use existing knowledge on outlier detection in
an entirely distributed paradigm with locality based parameters. The technique identifies
physical layer data integrity threats related to sensor value tampering or falsification. Our
[image:41.612.88.541.282.536.2]similar clusters and identify potential threats.
A fully distributed IoT network deployment in precision agriculture would use a mesh
network. As we set out to detect any outliers in the data flowing through this network as
outlined in the high level architecture in Figure. 3.2, we will leverage key characteristics of
a distributed network deployed in a wide farming area. In a wide area sensor deployment,
it is very practical to have sensors in certain patches report values that are similar or values
in the same range, or values trending similarly. This is true even with livestock reporting
temperature or humidity or other health related values. The key assumptions for the success
of this mechanism are that the network is fully distributed without any single point of failure
and there exist spatial and temporal locality in the network.
3.2.1 Local Outlier Factor Algorithm
We use the Local Outlier Factor (LOF) technique [29] to detect outliers in a data set with
varying distribution densities through a clustering approach. We develop on this algorithm
by extending this to a distributed paradigm with a locality based contextual variance and
introducing a histogram based approach for cluster delineation. The following paragraph
provides a brief discussion on the benefit of using LOF, with Figure. 3.3 describing the
pseudo–code of LOF algorithm. In the implementation, we use the lof function from the
DBScan package that is parameterized with the number of nearest neighbors that helps
control the clustering structure.
Consider the simple 2D data set shown in Figure. 3.4. There is a much larger number of
items in cluster C1 than in cluster C2, and the density of the cluster C2 is significantly higher
than the density of cluster C1. Our intent is to mark both objects p1 and p2 as outliers as
the conclusion is visually obvious. However, due to the low density of the cluster C1, it is
clear that for every item q inside the cluster C1, the distance between the item q and its
nearest neighbor is greater than the distance between the item p2 and the nearest neighbor
from the cluster C2. So, the item p2 will not be considered an outlier under a traditional
Figure (3.3) Local Outlier Factor (LOF) algorithm pseudocode
approach. Alternatively, LOF is able to capture both outliers (p1 and p2) due to the fact
that it considers the density around the points. The LOF algorithm runs with polynomial
time complexity and is mobile device-ready.
3.2.2 Spatio-Temporal locality based Threat detection algorithm
To this end, we assume that the network is setup and the device registration has already
been established. The core question we address is if the data values received from each sensor
are valid or not. To determine this, we run our proposed threat detection algorithm 1 on
[image:43.612.81.534.70.469.2]Figure (3.4) Results from Local Outlier Factor (LOF) algorithm
context of spatially local set of sensors, which is defined as a cluster of sensors within a finite
geographical area. This area is set based on the communication range of the sensors. In
addition, the data is sampled over a local time reference or window and the threat detection
is conducted periodically.
To understand the importance of spatio–temporal sampling in our work, let us take
the example of sensors deployed in an agricultural farm. In this case, the soil in the areas
of the farm within short distances are expected to have similar physical attributes such as
temperature, pressure, humidity, Oxygen content, Nitrogen content etc. We leverage this
fact to develop our insight that, the sensors within these relativelyhomogeneousspots in the
farm can communicate with one another and jointly agree/disagree on the values based on
comparative evaluation of the distribution of values they have sampled. This is analogous to
a group of people within a room being able to agree upon what the temperature of the room
could be or could not be (outlier) based on discussing with one another. The effect of outlier
[image:44.612.77.542.73.351.2]Figure (3.5) Sensor Network
cluster of nodes (or rooms as in the example mentioned above), thus enabling its impact at
scale. In this work, we describe the fundamental mechanics of the distributed technique and
aim to implement the functionality at large scale in future work.
In this regard, let us consider the mesh network configuration as shown in Figure. 3.5.
We use this network as the sensor spatial deployment reference. Here, each node (numbered
circles) represents the sensor device; the arrow represents the communication (connectivity).
The highlighted part of this network (6 nodes) is used in the evaluation of our technique
to be discussed in Section 3.3.1. We will now discuss each step of Spatio-Temporal Locality
based Threat Detection Algorithm[ 1] in detail.
Step 1: Data Maintenance for a time window: Each router–enabled node
main-tains values only of its neighbors. The neighbors are defined through a spatial adjacency
[image:45.612.77.538.75.398.2]Algorithm 1 Spatio-Temporal Locality based Threat Detection
// Algorithm actively runs on all routing enabled nodes in real time Data: Metric data from all adjacent nodes
Data: Mesh network and routing metadata
Data: Configured time interval for algorithmic runs
Result: Identified threats
while Router node is active do
while Looping for the threat detection time interval do
Data persistence: Persist data from all the adjacent nodes for the time interval
end
Create Contextual Mean and Variance: In the structure outlined in table 3.1
Run LOF algorithm: Using Mean and Variance as dimensions, as outlined in Figure. 3.3 Record Threat Scores: In the structure outlined in table 3.2
Calculate threat score threshold: Using a standard deviation based heuristic method Identify Threats: Using the threshold that was calculated
Notification of Threats: Notify the elected leader of the mesh network
end
the nodes connected to it : {2, 3, 5, 7, 8 , 11}. Data from each node is sampled periodically
and communicated across to its cluster’s router-enabled node. If 1/Ts is the sampling rate
at each sensor node, the threat detection routine is executed every Td time window, where
Td > Ts. This time window is determined based on how long some characteristic would be
either constant or would be predictable. The time window duration is selected based on the
sampling duration on the nodes, ensuring that there are statistically relevant amount of
non-trivial (anything with non-zero information) data (atleast few hundred samples) collected in
each iteration.
Step 2: Create contextual Mean and Variance: The sensor values collected in
the relay node are recorded in a time-stamped table. Such a table is maintained for each
physical attribute, for e.g. temperature, humidity, oxygen levels, etc. We will refer to a
physical attribute as a class. For each class the mean and variance of the values collected
in time window Td are computed. It records the mean and variance values for each class as
mij and vij, respectively, where i is class index and j is node index. TABLE 3.1 shows an
Table (3.1) Mean-Variance table. This is an example table for 3 physical sensing attributes (classes). A new column is appended for each new class. Each table represents the ensemble mean in time window Td. Here, mean and variance of sensor data from each of 11 nodes are
collected within the time window.
Class 1 Class 2 Class 3
0 0 0
m12, v12 m22, v22 m32, v32
m13, v13 m23, v23 m33, v33
0 0 0
0 0 0
0 0 0
0 0 0
m18, v18 m28, v28 m38, v38
0 0 0
0 0 0
m111, v111 m211, v211 m311, v311
Step 3: Execute LOF algorithm: We ensure that there are sufficient number of
non-trivial mean and variance values collected in the table. We believe a few hundred entries for a
class is reasonably good (LOF needs atleast 25 to make a reasonable cluster identification).
If the number is lower than 25 we wait on the next time-window iteration. If there are
consistently trivial values collected in the table then it is a clear indication that something
is wrong with the sensor(s) and/or the collection. We will refer to the non-trivial case for
further discussion. The populated mean and variance values in each column (class) are input
as a tuple to the LOF algorithm 3.3, which outputs anLOF value for each class-node pair as
lofij. The lof values are maintained in a table as shown in TABLE 3.2. LOF computation is
a simple algebraic computation and thus converges fast (order of ms). Thus, even for large
numbers of nodes and potentially large number of clusters, the runs are effectively in real
time, making it viable to have this running in the nodes and/or the network at all times.
Step 4: Record Threat Scores: We use the LOF values in the context of threat scores
that underline the potential integrity threat to the sensors sampled in the list. The values of
[image:47.612.212.397.148.325.2]Table (3.2) LOF of values from Mean-Variance table in time-windowTd. The row and column
definitions are same as the mean-variance table.
Class 1 Class 2 Class 3
0 0 0
lof12 lof22 lof32
lof13 lof23 lof33
0 0 0
0 0 0
0 0 0
0 0 0
lof18 lof28 lof38
0 0 0
0 0 0
lof111 lof211 lof311
If the variability in the measures are high then it will lead to potential outliers. If the outliers
are clearly identified then it could potentially be flagging the threat on the corresponding
sensor. However, depending on the density of data (very few nodes in connection range)
then the table may not be rich, thus increasing the chances of potential false-positives and
false-negatives. The LOF value computation is a measure of variability and is independent
of the which sensor nodes are connected. This implies that such a mechanism will also work
for mobility scenarios, for example, sensors deployed on livestock. Here, the sensor nodes,
as they move, will connect to different set of sensor nodes and a router node. Ensuring that
connectivity is maintained across the area of mobility of the nodes (movement of livestock
over a farm) is sufficient for our approach to work in mobile scenarios.
Step 5: Calculate threat score threshold: We set the threshold for the LOFs
for each class, for threat identification equal to µ+ασ, where µ and σ are the mean and
standard-deviation of the LOFs. Hereαis a variable representing the length of the tail of the
distribution of the LOFs. The rationale for this form of threshold is by invoking the central
limit theorem that attributes a normal (Gaussian) distribution to an i.i.d (independent and
[image:48.612.225.385.119.299.2]variables and fit to a normal distribution curve assuming a large number of LOF samples,
that would converge to the mean and variance of the LOFs (for each class) in the table.
A small value of α essentially means highly sensitive (many of the sensors are flagged as
potential threats) but less selective (less precision in identifying the threat(s)), and a larger
value can lead to higher selectivity but lower sensitivity. As we will discuss later, in our
evaluation we will consider α values of 0.75, 1, 2 and 3, and report the precision, recall and
accuracy values for these choices in our datasets from our experiments.
Step 6: Identify Threats: All values above the set threshold for LOF are flagged
and the corresponding sensors are noted for potential threats. Since the LOFs note the class
and sensor ID, the exact sensor node and physical attribute that could have been at risk
or attacked or failed (power disconnection) can be identified. Since these computations are
running every cycle of the time-window, the process essentially happens in real-time with a
practical latency of the order of Td. Hence, once a sensor node is at threat it can be flagged
by our system in the order of Td+Tp, where Tp is the processing time of the mechanism in
total.
Step 7: Notification of Threats: One of the metadata aspects maintained in the
router node is the elected (during deployment phase which is out of scope of this paper)
leader for that cluster of nodes (the router node could be the leader itself), which is dynamic
and might change as memberships change on the mesh network. As soon as the threats
are identified, it is made imperative that the router node notify the leader of all the threats
identified by this node. Once the leader receives lists of threats from all router enabled nodes,
it can take decisions on either observing them closely or quarantining them or invoking human
involvement.
3.3 Precision Agriculture based Threat Detection
There are various topologies for geographical placement of sensors in a precision