Care Practice in Residential Care Homes for the Elderly (RCHE): The
Application of Visual Method Using Computer-Assisted Qualitative Data
Analysis Software (CAQDAS): NVivo 7.0
Noralfishah Sulaiman1, 2, David Baldry2, Les Ruddock2 1
Universiti Tun Hussein Onn Malaysia, 86400 Parit Raja Batu Pahat Johor, Malaysia 2
Research Institute for the Built & Human Environment (BuHu), University of Salford, Salford Greater Manchester, M5 4WT, UK
Email: [email protected]/[email protected], [email protected], [email protected]
Abstract:
The purpose of any type of research is to record and demonstrate what is important about the story of an event, people or place. In research, a visual method covers all uses of images such as photograph, with or without accompanying words, as a part of the research process. Though most sociologists are ‘visually illiterate’ and show little sign of considering the use of visual images, in the last decade there has been a considerable renewal of interest in this method. Using photographs as a ‘true-nature’ representation of the surroundings of care homes for the elderly, this paper seeks to explore and elucidate the application of visual method using NVivo 7.0 software in the PhD thesis entitled ‘Opportunities for the Transfer of United Kingdom (UK) Best Practices for the Provision of Residential Care Homes for the Elderly’. This research is particularly seeking to understand how the operational care practices are being delivered at both the Residential Care Home for the Elderly (RCHE) in the UK and Malaysia. The relevencies, techniques and steps of using this visual method and software will be explained accordingly.
Keywords:
Visual method, care practices, NVivo 7.0
1. Introduction
2. Definition and Context of Visual Method
Pictures were accepted in Western society as a ‘true-nature’ representation of the surrounding world during the Italian Renaissance, when Leonardo da Vincci and his colleagues proclaimed that central perspective was the only legitimate way to construct a pictorial representation. They visualised a painting as a window, opening on a view of perspective space as seen from one central point; in geometrical terms, the picture is a cross section of the cone shaped visual field, the apex of which is the observer’s eye (De Haas, 1979). In research, visual method covers all uses of images, with or without accompanying words, such as photographs, video, film, television, or hand-drawn artwork, whether pre-existing or generated as part of the research process, as data for social research purposes (Payne & Payne, 2004). It can also take the form of film or still photos, maps or diagrams (Latham 2003; Young and Barrett, 2001) or drawings (Guillemin, 2004; Kearney and Hyle, 2004). Photographs that people have taken are likely to record what was new, noteworthy, difficult, memorable and/or out of the ordinary (Titus, 1976). However, over the last century, the use of photographs as data for social purposes has waxed and waned (Hurworth, 2004). Payne & Payne (2004) added most sociologists are also “visually illiterate”, showing little sign of considering use of visual images. Hurworth (2004) supported this claim as identified in comparison with other data collection method. Only a relatively small amount has been written concerning the use of the visual medium for research and even less about how photographs can also be integrated into the interviewing process. It has swung from being popular to being ignored but in the last decade there has been a considerable renewal of interest in this method (Hurworth, 1995; Hurworth & Sweeney, 1995). Interestingly, it has been shown that various researchers suggested that photography can be powerful evidence in collecting research data especially qualitatively.
3. The Research Inquiry
Creswell (2004) simplified research questions to those that the data collection will attempt to answer. Realising the importance of transferring of best practice in the provision of RCHE, within the specific boundaries, the research questions in this research have been identified as the following;
(1) Which strategic, tactical and operational practices within the context of public sector Facilities Management (FM) are applied in the provision of RCHE in the United Kingdom?
(2) What are the current strategic, tactical and operational practices within the context of public sector FM currently being delivered in the provision of RCHE in Malaysia?
(3) To what extent has a best practice approach at strategic, tactical and operational public sector FM functions been established or has empirically emerged in the context of United Kingdom? (4) To what extent has a best practice approach at strategic, tactical and operational public sector
FM functions been established or has empirically emerged in the context of Malaysia?
(5) Which enablers, barriers and benefits will Malaysia face if the Best Practice Transfer Process takes place?
(6) What lessons could be learned for the improvement of the provision of RCHE in Malaysia? (7) What are the transferable strategic, tactical and operational practices needed for the provision of
RCHE to be transferred to Malaysia?
4. Research Methodology & Method
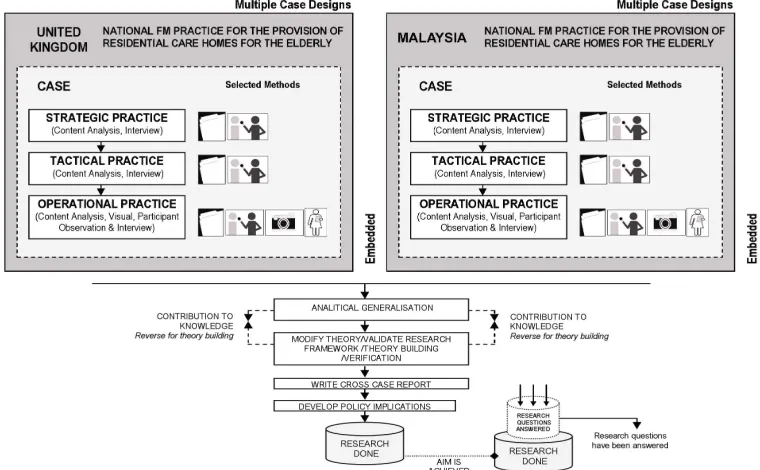
type of research units and so on (Sarantakos, 1997). Subsequently, a researcher could use as many sources as possible that can be called “multiple sources of evidence” to increase the validity of data collection. In order to conduct a good case study, Yin (2003) suggested that a researcher should immediately note that no single source has a complete advantage over all the others. As a case study approach is an umbrella term for a family of research methods, the “method of triangulation” is employed by which visual method is used as one of the methods. Prosser and Schwartz (2003) agreed, stating that “A case study perhaps, in which the photographs, presented in the form of visual quotes, will be used in conjunction with other evidence to support a particular theory or working hypothesis”. Using the “multiple embedded case study design”, the primary concern of this research is to study the strategic, tactical and operational FM practices delivered for the provision of RCHE in both countries United Kingdom and Malaysia. However, this visual method is only trying to obtain the data on operational practice delivery at the RCHE for both countries. The application of case study using Multiple Case Embedded Matrix and the employment of a visual method can be seen in Figure 1.
Fig. 1. Case Study Matrix Design-Multiple Case Embedded; for UK and Malaysia
5. Why Visual Method?
two different countries, suggesting that the comparison between recent photos collected from different countries could show marked differences. On top of that, many of the classical anthropological ethnographies use photographs to economically show the visual differences of alien culture (Ball & Smith, 1992). In terms of culture in the research settings and social phenomena, the photographs serve essentially presentational and illustrative purposes rather than providing a focus for a more sustained analysis of the visual dimensions culture (Ball and Smith, 1992). Also, the extensive use of photographs can illustrate among other things, ritual practices, everyday life and material culture (Ball and Smith 1992). Grady (2004) stated, pictures are also valuable because they encode an enormous amount of information even in a single representation. For an example Figure 2 shows the images taken by satellite photos for RCHE in the UK and Malaysia. Based on the images, immediately some points of view can be construed from the observer’s eye. Then, language can do the work of eyes based on the interpretation made by the person who saw it as well as the researcher.
[image:4.595.136.425.262.460.2]Source: Google Earth (2008) Fig. 2. Satellite Photos for RCHE in the UK and Malaysia
what’s there but of what an individual sees, not just a record but an evaluation of the world”. Definitely, this signifies that if participant observation is being used, photographs are able to validate all of the information collected on observation as more accurate. Simultaneously, photographs can be ‘a more transparent representation of the life experiences of participants in a study’ (Dodman, 2003). In summary, Sontag (1978) concluded that “You may not agree with his/her (subjective) evaluation, but thanks to the objective nature of photographs you can not deny its truthfulness; photographic images do not seem to be statements about the world so much as pieces of it. Importantly, the pieces serve as pieces of evidence. Evidence, of course, is what every one is looking for in the research setting”.
6. Sampling Frame & Unit of Analysis
[image:5.595.130.472.647.784.2]A researcher employs a sampling procedure that corresponds to the philosophy of the type of research but if it is qualitative, it will be is less structured, less quantitative, and less strict than the techniques of quantitative research. In visual method, Rose (2007) explained that “There are no hard and fast rules for deciding what size your sample should be. Sample size depends on the amount of variation among all the relevant images. If there is absolutely no variation, a sample of one will be representative..”. This method was specifically chosen to gather the data on operational care practice at the RCHE. To conduct the method, time-based sampling was used in which 3 hours were allocated for each care home to engage the participant observation. While conducting the participant observation, the photographs on operational care practice delivery and the condition of RCHE were being taken at the same time. Altogether, about 18 hours were spent taking photographs at the 6 RCHE both in UK and Malaysia along with the tour of the building for participant observation. The shooting script and the UK’s National Minimum Standard for the Care Home for the Elderly 2000 were used as a guide to capture the photos driven by the developed research questions. This conceptually-driven sequential sampling is also known as theoretical sampling where it is associated with theory and also known as theory-driven ‘up-front’ sampling (Miles & Huberman, 1997). It is selective, not representative (Payne and Payne, 2004). In total, 150 photos were captured in Malaysia and the same quantities of sampling frame were shot in the UK respectively. The total of 300 photographs have been documented and then reasonably reduced for the categorising process. Then, 50 photographs were selected to represent each residential care home. At the end of the process, only 10 representative and significant photographs were chosen for each care home for the elderly totaling 30 photographs for each country. See Table 1. Considering this as a support method, this sample was sufficient to represent visually standard of RCHE ranging from choice of home, health and personal care, daily life and social activities, complaints and protection, environment, staffing and management and administration. Interestingly, there were also certain events which took place during the researcher’s visit. So, the senses of event, culture and social value were also recorded during the visit.
7. Computer Assisted Qualitative Data Analysis (CAQDAS): The Application of NVIVO 7.0
“Computers are useful for administrative functions and at arranging and sorting data. What computers can't do is think like a qualitative researcher. But the fact that computers don't think is not a limitation at all; in fact, it leaves the researcher doing what they most want to do - the thinking” (Gibbs, 2004).
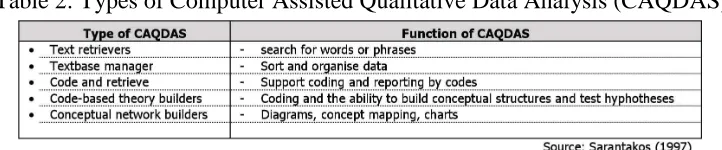
[image:6.595.117.478.368.443.2]Nowadays, almost every qualitative researcher uses word processors to transcribe their interviews, theoretical ideas, write up their field notes and the final thesis while undertaking a piece of research. In a way to understand the world or to imbue with meaning in research settings, CAQDAS has transformed the traditional way of managing and the analysis of the data such as paper management techniques, indexing, photocopiers, filing cards, mind mapping charts, coloured pens, etc to the more efficient and systematic ways. As qualitative data requires an understanding of the meaning of the texts which are commonly iterative, bulky, dense, recursive, complex and dynamic, the continuous modification and enhancement of CAQDAS are necessary to assist the interpretive philosophers to interpret the world they live better. The key development in CAQDAS was the introduction of software that could manage the coding and retrieval of texts of the transcribed data. Furthermore, some of the software features can also provide a variety of facilities to help the analyst examine features and relationships in the texts to develop the theoretical ideas. Weitzman and Miles (1995) summarised the categories of CAQDAS as in Table 2.
Table 2: Types of Computer Assisted Qualitative Data Analysis (CAQDAS)
NVivo has been developed, supported and distributed by QSR International Ptd Ltd, a largest privately owned qualitative research software developer in the world headquartered in Melbourne, Australia. It was formally established in 1995 and originated in 1981 – when the first software product, NUD●IST, was developed. With the development of the NUD●IST (1980s) and NVivo (1990s) software lines, QSR has long enjoyed a reputation as a front-line innovator in qualitative computing. This software is suitable for those with backgrounds in sociology, psychology, health, nursing, social work, social policy, geography, anthropology, economics, criminology, politics, cultural studies and community studies. Therefore, considering the benefits of the software, this research is trying to utilize the benefits of CAQDAS using a visual method.
8. Techniques for Applying the Method
8.1 Selection of Research Topic
To start with, the research topic was identified and was aimed to identify the “Opportunities for the Transfer of United Kingdom (UK) Best Practices for the Provision of Residential Care Homes for the Elderly in Malaysia to Meet Emerging and Changing Social Needs”. Research materials to store visual data are a digital camera and a notebook computer to store the captured images.
8.2 Operationalising Research Questions
The research questions stemmed from a particular issue, that is the lack of awareness on learning and improving the current practice in the provision of RCHE in Malaysia. The problems were identified and explained in previous papers prepared by Sulaiman et. al, (2006a, 2006b, 2006c, 2006d and 2008a). These have raised numerous questions suitable for research as described in 3.0. Wilkinson and Birmingham (2003) argued that in research a well developed research questions can certainly limit the themes and issues, and their types, to be explored, making the whole process more manageable. The questions should be relevant to the topic area, able to be answered by observable evidence, feasible for the researcher to answer, and should have more than one possible answer. In this regard, a photo documentation technique was used to answer the research question on the operational practice delivered at the RCHE for both countries. It has been defined as “the precise recording of, among other things, art, text, architecture, ritual, or a physical location”(Glowski, 1998). Suchar (1997) used this technique to study the detailed physical, social, and cultural changes that gentrification brought to the urban environment and neighbourhoods in Chicago and Amsterdam. Rieger (1996) said the key to the successful use of photo documentation is the careful conceptualisation of the link between the research topics. In this case, those 50 pictures containing the activities associated with operational practices at the RCHE were captured and shooting scripts were used based on the developed research questions addressed. Rose (2007) described that the shooting scripts are a list of sub questions, generated by that overall question and they guide the taking photographs relevant to the research questions. A shooting script guides what photographs a researcher is going to capture and more importantly, why they are taken. Suchar (1997) claimed that to serve as evidence for social science research, the photos must be clearly connected to a research question. He emphasised by using the scripts, the information within (a photo) can be argued as putative facts that are answers to particular questions. The crafted research questions on operational practice at the RCHE finally guided and limited the number of captured photos as finally only 10 photos represented each RCHE.
8.3 Identification of Research Settings & Gathering Fieldwork’s Permission
Table 3: The Criteria of selected RCHE and the number of selected images
In order to commence the fieldwork activities, Table 3 shows that 6 RCHEs provided by the government have been selected. It has been managed by the local authorities in the UK and Department of Social Welfare in Malaysia. The alphabets A, B, and C represented the 3 RCHEs in the UK and the X, Y, and Z represented the 3 RCHEs in Malaysia. In order to obtain permission for entering the research settings, according to the Research Ethic Framework (REC), in cases where research involves vulnerable groups every effort should be made to secure their informed consent (ESRC, 2008). Gray (2004) suggested informing people in the research setting of what you are doing, and eliciting their consent, is seen as good practice by most researchers. Payne & Payne (2004) reminded that before using cameras a researcher must, of course, ensure that everyone is agreeable. Hence, an Informed Consent (IC) was presented to the research participants for addressing this issue as recommended by Frachtling and Sharp (1997), stating that an IC must be obtained from participants before any observational data are gathered. In effect, the benefit such as ethical dilemmas can also be reduced by using an inform consent while conducting a visual method (Hurworth & Sweeney, 1995). Considering this, official letters were sent to the RCHE managers to seek their permission. When they have agreed the researcher then brought the IC to be signed in the presence of the researcher before the fieldwork activities could take place. Instead of taking pictures, Mack et. al., (2005) commented that if the researcher involvement with an individual appears to be progressing beyond participant observation to a formal interview, it is necessary to obtain IC before beginning an in depth interview. Furthermore, Diener and Crandall (1978) suggested that fully informed consent should include (1) describing the overall purpose of the research; (2) telling the participants about their role in the study; (3) stating why they have been chosen; and (4) explaining the procedures of the fieldwork being undertaken. In this case, the developed IC covers the method of participant observation, a visual method as well as an interview. In summary, the importance of IC is to obtain official permission from the research participants, giving brief explanation on the research aim and objectives, to recognise the privacy and confidentiality of the data to be collected, the benefit of the research project, the contribution of the research participants to the production of new and potentially illuminating knowledge about the sector in which they are working, and finally the section to enable the RCHE managers to sign for their consent to be a participant in the presence of the researcher. In this regard, as agreed in the IC, the names of selected RCHEs were not be revealed due to confidentiality and privacy of the service users and the research settings.
8.4 Collection of Data: Capturing Images at the Research Settings
8.5 Application of CAQDAS: Word Processor and NVivo 7.0
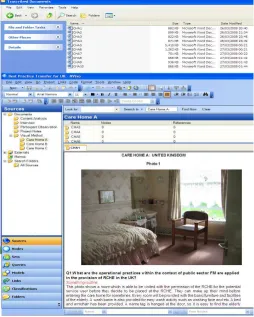
Fig. 3. The Transcribed Word Processor Files before being imported into NVivo For each RCHE, the 50 images repetitiously portrayed the delivered operational practices, therefore, only the 10 pieces most compliance photographs were taken for analysis. At this stage the application of CAQDAS was started to be applied as a tool for qualitative analysis. The first stage involved the transcription of 60 photos for 6 RHCEs. It was first transcribed into the word processor software known as Microsoft Office. Then these textual transcription files were imported into the NVivo software to be analysed further. Figure 3 shows the transcribed documents for 10 photos for the “RCHE A” in the UK. The bottom of Figure 3 shows the appearance of the file in NVivo.
8.6 Recording & Manipulating Data: Categorising and Coding Process
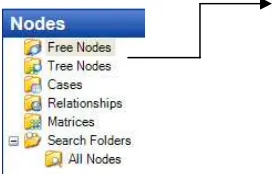
themes, as well as messages, meanings and symbols which indicate the presence of one of the categories (Sarantakos, 1997). In NVivo, those categories and the coding are stored at “nodes”. Nodes are containers for categories in the project, ideas or topics you are interested in (Richards, 2006). Figure 4 shows in the Navigation View, Nodes or categories can be represented by Free Nodes, Tree Nodes, Cases and Relationships. Free Nodes contain free codes from the textual sentences while Tree Nodes contain the developed categories. These two folders help to develop and record the coded texts. In this case, a category was defined as a set of criteria integrated around a theme or value in operational practice at the RCHE in both UK and Malaysia.
Fig. 4. Nodes and Coding in NVivo 7.0
According to Richards (2005) “The researcher discovers themes, or threads in the data, by good exploration, good inquiry. By handling the data records sensitively, managing them carefully and exploring them skillfully, the researcher ‘emerges’ ideas, categories, concepts, themes, hunches and ways of relating them’. Therefore, the code used in photographical transcripts must depend on a theorised connection between the image and the broader cultural context in which its meaning is made. The categories emerged from the transcribed photos were identified as on the right of the Figure 4. Interestingly, the coding process can also be automated using this software.
8.7 Working with the Data: Handling Ideas with Links, Relationship, Query
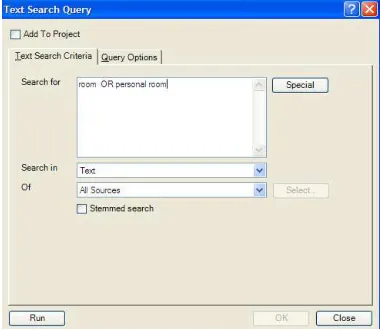
Fig. 5. The Relationship within data Fig. 6. Query on text ‘room’ OR ‘personal room’ in NVivo
8.8 Model Development
While handling the data, the researcher also needs the ability to draw and show models of what is going on and what is aimed for as stated in the research questions. Using the “Model” folder, a research model can be easily developed by searching the sources of coded text in the project document. The associated items will be searched throughout the project document and it will be appear in the form of a research model automatically. As this research is in a stage of analysis the process of model development can not be processed at the moment. However, from the NVivo Tutorial session, it has shown that NVivo is able to do this function. The results can also be modeled by segregating the positive as well as negative value of the model. The appearance of the model will be portrayed in the form of shapes and can be easily understood.
9. Summary
interaction between subjects and objects of the research. Also, the real heart of the analysis requires an understanding of the meaning of the texts, and that is something that computers are still a long way from being able to do. With regards to visual method, photos and other semiotics are among the many approaches used in qualitative research to gain insight into people's attitudes, behaviours, value systems, concerns, motivations, aspirations, culture or lifestyles. The information that is collected and transcripts document are unstructured and often text-based. This information can be messy and time consuming to analyze using manual methods. As the interpretivism has a close link with the constructivism epistemology, NVivo has been helping in many ways to store, manipulate, construct and link the ideas as well as producing a research model and the project report in one “software package”. As a result the process of finding themes and extracting social meaning would be very more effective and reliable.
References:
Ball, M & Smith, G.W.H (1992), Analysing Visual Data. Sage Publication. London.
Creswell, J.W (2004), Research Design: Qualitative and Quantitative Approaches. Thousand Oaks, CA: Sage.
Dakin, R.E (1960), Cultural Occasion and Group Structures: A Photographic Analysis of American Social Situations. American Sociological Review, Vol. 25, pp 66-74.
De Haas, W.G.L (1979), Technology as a Subject of Comparative Studies: The Case of Photography. Comparative Studies in Society and History. Vol. 21, pp 362-371.
Diener, E. & Crandall, R. (1978) Ethics in Social and Behavioural Research Chicago: University of Chicago Press
Dodman, D. (2003). 'Shooting in the City: An Autophotographic Exploration of the Urban Environment in Kingston, Jamaica' Area 35(3): 293-304.
Emerson, R.M., Fretz, R.I., & Shaw, L.L. (1995) Writing Ethnographic Fieldnotes. University of Chicago Press. Chicago.
ESRC (2008), Research Ethics Framework (REF), Economic & Social Research Council (ESRC), UK.
Fielding, M, Bragg, S, Craig, J, Cunningham, I, Eraut, M, Gillinson, S, Horne, M, Robinson, C and Throp, J (2005), Factors Influencing the Transfer of Good Practice, Department for Education and Skills. University of Sussex.
Glowski, J.M (1998), A Guide to Photographic Documentation in the Field [Internet].
Available.from:http://kaladarshan.arts.ohiostate.edu/photodoc/Guide%20to%20Photo%20Do
c7_15_98.pdf [23 September 2007]
Gray,A.A (2008), Research Questions in Proposal Writing and Social Work Research.
[Internet].Available.from:http://www.und.nodak.edu/instruct/wstevens/PROPOSALCLASS/
AMYGRAYResearchQuestionPaper.htm [20 March 2008]
Gray, D.E (2004) Doing Research in Real World. London. Sage Publication.
Hurworth, R (1995), A Annotated Bibliography Concerning the Use of the Visual Medium for Research and Evaluation. Evaluation News & Comment, 2(1), 53-60.
Hurworth, R & Sweeney, (1995), The Use of the Visual Image in a Variety of Australian Evaluations. Evaluation Practice. 16(2), pp153-164.
Knowles, C & Sweetman, P (2004) Picturing the Social Landscape: Visual Methods and the Sociological Imagination. Routledge. New York.
Latham, A (2003), Research and Writing Everyday Accounts of the City: An Introduction to the Diary-Photo-Diary-Interview Method in C. Knowles and J. Sweetman (Eds) Picturing Social Landscape: Visual methods and the Sociological Imagination. London. Routledge, pp. 117-31.
Nordeman, L (2007), Walker Evans Revolutionizes Documentary Photography. [Internet].
Available from http://xroads.virginia.edu/~UG97/fsa/welcome.html[25 January 2008].
Payne, G and Payne, J (2004), Key Concepts in Social Research. Sage Publication. London. Prosser, J And Schwartz, D (2003), Photographs within the Sociological Research Process in
PROSSER, J Image-Based Research A Sourcebook for Qualitative Researcher. Routledge Falmer. London, pp. 115-130.
Richards, L (2005), Handling Qualitative Data: A Practical Guide. Sage Publication. London. Richards, L (2006) Resource pages for Handling Qualitative Data [Internet]. Available from
http://www.sagepub.co.uk/richards/ [15 February 2008]
Rose, G (2007), Visual Methodologies: An Introduction to the Interpretation of Visual Materials. Sage Publication. London.
Sarantakos, S (1997) Social Research. Palgrave Publishers Ltd. New York.
Sherman, E & Reid, W.J (1994), Qualitative Research in Social World. New York. Columbia University Press.
Sontag, (1978), On Photography. Penguin Books. London.
Suchar, C (1997), Grounding Visual Sociology in Shooting Script. Qualitative Sociology. 20, 33-55.
Suchar, C (2004), Amsterdam and Chicago: Seeing the Macro Characteristics of Gentrification, in C. Knowles and J. Sweetman (Eds) Picturing Social Landscape: Visual methods and the Sociological Imagination. London. Routledge, pp. 117-31.
Titus, S.L (1976), Family Photographs and Transition to Parenthood. Journal of Marriage and the Family. Vol.38, No.3, pp 525-530.
Tucker S. A. & Demsey, J. V. (1991). Photo-interviewing: A tool for Evaluating Technological Innovations. Evaluation Review, 15 (5), 639-654
Wilkinson, D & Birmingham, P (2003), Using Research Instruments. Sage Publication. London. Yin, R.K (2003), Case Study Research. Sage Publication. London.