Towards Empirically Measuring Patience
Klaus Brockhoff
1,*, Maximilian Margolin
2, Juergen Weber
21WHU Foundation, Burgplatz 2, D 56179 Vallendar, Germany
2Institute of Management Accounting and Control, WHU – Otto Beisheim School of Management, Germany
Copyright © 2015 Horizon Research Publishing All rights reserved.
Abstract
Patience is considered mostly as one-dimensional. In this view it reflects the willingness to defer consumption. This can be represented by a time discount rate. We suggest that patience has a broader, multi-dimensional meaning. This is in contrast to much of the literature. We have identified 19 items to measure patience. Only a small subset of these items is correlated with self-evaluations of patience, which in turn is correlated with the standard economics measure of time discount rate. Our result suggests that patience is indeed a multi-dimensional construct. This could be of interest in many fields, particularly when patience is considered as influencing commercial decisions.Keywords
Patience, Impatience, Measurement, Validation Of Survey Measures, Time PreferenceJEL classification: C21, C84, D01, D03
1. Introduction
1.1 The Classical PerspectivePatience is of interest to many sciences. In economics, it is most frequently measured by evaluating tradeoffs between present rewards and future gratifications. In this respect, “patience is the preference for delayed over immediate consumption” [8]. Kashner [15] mentions authors who use seven different words to describe this behavior, including impatience. It is this traditional view which explains interest rates as the result of a negotiation between parties which are dissimilarly patient to postpone consumption [6, 11]. More recently, this type of patience is evaluated in experiments on the willingness of children or adults to defer consumption by finding a trade-off between a fixed sum of money (or a reward) at present and a larger sum of money (or a multiple of a reward) at a future time [3, 15, 20, 29]. Accepting this view, authors of these and similar works study whether patience can be measured by offering differently valued incentives for a deferral of immediate actions. The measure can be considered unidimensional. The same experiments can be used to explore whether subjects use constant discounting [26] or hyperbolic discounting of the future reward [1, 17, 22, 23, 24, 29]. The latter is alternatively
called decreasing impatience. It indicates that subjects “become more patient if payments are shifted into the future” [29, p. 322]. More recently, the idea of decreasing relative impatience was introduced [24]. As a consequence of the different concepts of discounting its author suggests that these might reflect “distinct psychological motives underlying intertemporal choice” [24, p. 835]. We interpret this as a first indication of different types of patience. Furthermore, the experiments reveal that patience appears not to be constant over the lifetime of people. They indicate that patience grows with age of subjects [3, 13, 18]. In addition, it has been found that different types of personalities react differently to waiting situations. These reactions are considered as an indication of patience [1, 9, 29].
Patience does not only seem to vary with personal characteristics but also with specific events or situations [28]. These situations define particular contexts of waiting, which, for instance, can be different in professional or private environments. To illustrate this point: Other than in the experimental studies mentioned above, researchers study the switching behavior of television viewers when advertising interrupts a program [7] or that of video viewers when the start of the video is delayed [16]. In both of these cases, patience or impatience are considered unidimensional although no monetary reward is offered to manipulate behaviors.
Differences in patience are correlated with particular behaviors. “… more impatient children and adolescents are more likely to spend money on alcohol and cigarettes, have a higher BMI, are less likely to save money, and commit more violations of the school’s code of conduct” [29, p. 510], and they have a less favorable outlook for school performance [29, pp. 511, 512]. Present-biased, more impatient people use more credit card borrowing [20]. Thus, patience influences behavior.
1.2. Development of a Multidimensional View
In the studies mentioned above, the subjects had not possibility to influence the conditions of the experiments. Differences in context of a situation requiring patience let us doubt that patience or impatience could be measured by a unidimensional scale. Rather, one might argue that an individual’s patience is expressed differently in different situations, also depending on whether these situations can or cannot be influenced by the individual. Eventually, it could mean that different items indicative of patience or impatience are integrated into not only one construct but into different constructs measuring patience. One of these might be correlated with self-evaluations of patience and thus with the standard model. Indeed, psychologists approach the measurement problem at such a broad base. Contrary to the one-dimensional measure of patience, Dudley [10] has probed into developing a multidimensional scale of various types of patience. This research is based on Blount and Janicik [4,5], who have extensively explored the psychological literature contributing to the concept. Their basic assumption is that “patience can only occur when there is a delay” [10, p. 27]. With this in mind, a number of studies were performed to shed light on three problem areas: “explaining and understanding the delay, evaluation of responsibility for the delay, and responding to the delay” [10, p. 9]. These studies involve different situational aspects of patient or impatient waiting. Patience is then described “as a cognitive, behavioral, and emotional response to delay” [10, p. 9]. Furthermore, two categories of delay are identified: “postponement (waiting for something to begin) and tolerance (waiting for something to end)” [10, p. 11]. In both categories, the term “waiting” implies a divergence from a preferred situation. In our view, a difference between voluntary and forced delays (i.e. the red traffic light) is indicative of different types of patience.
The experimental studies also suggest a correlation between risk-attitude and patience. More patient subjects are more risk-averse [29, p. 522]. This result should be of interest in the analysis of patience in business decisions, whether it concerns tolerance or postponement. More patience would lead to defer decisions which would optimally have been taken at an earlier point in time. Such decisions could involve employing some manufacturing machinery even though the marginal value with respect to time has turned negative or continuing sales of a traditional product of the company which also shows a negative marginal value with respect to time or of continuing the employment of a person for reasons of tradition although his or her performance is dissatisfying. To the degree that this is observed, patience reduces economic performance. A recent comment on the economics of the container ships industry illustrates the point. It indicates that more mergers seem to be necessary to improve the situation. However, “in many family-owned shipping firms with a long business tradition” sticking to the traditional stand-alone strategy is very strong. This means that these companies are more patient to endure bad results than their banks [21].
1.3. Hypothesis and Organization of the Paper
Therefore, it is of interest to identify measures of patience beyond a self-evaluation or an implicit preference for immediate consumption. Our main hypothesis is that patience is not a unidimensional construct. To shed light on this hypothesis, we have developed a set of items which according to earlier theoretical studies appear to be related with patience. These are rated by a sample of adult and employed people. Should patience be a unidimensional construct, we would expect that all items indicative of patience should be positively correlated with it. Otherwise, we would expect items to load on a number of factors, indicative of different types of patience. To shed light on these issues we have performed an empirical, questionnaire-based study which is presented in the following chapter. After this we discuss major results of this study in the third chapter. In the fourth chapter, this is followed by a discussion of our conclusions. Limitations of the study which might be considered in future research are presented in the fifth chapter.
2. Organization of the Study
We developed a questionnaire which offered a 5-point Likert scale to the respondents to express their agreement or disagreement with 19 statements or items. These can be considered as identifications of patience which are supposed to be positively correlated with self-evaluations of patience. The items are based on the studies by Dudley [10], and the works by Blount and Janicik [4,5]. In addition to these items we asked for a self-evaluation of patience. Furthermore, we asked for an imagined evaluation of patience by a friend of the respondent’s. This question was included because it could have triggered a deeper reflection on the self-evaluation. Gender and age were used as controls. The questionnaire was sent out in November 2014 to 247 professors, research assistants and administrators of a leading business school in Germany. In total, 98 responses were received (response rate 39.7%). No rewards were offered for answering the questionnaire. Answers could have been made anonymously.
more sophisticated techniques like multiple imputation. However, in order to retain as large as possible a sample, we tried to fill missing data gaps by the itemized mean values. It turned out that this did not lead to an overall improvement of the results. For this reason we rejected this approach, and we accepted the fact that the number of observations in the multivariate statistics can be substantially lower than the number of respondents.
Situational aspects were covered by items referring to private life, to professional live, and to reactions in both areas. The items (numbers in brackets refer to the tables or figures) referring to the professional life are:
It is difficult for me to listen to professional conversations on topics which do not immediately concern me (4).
I tend to inquire repeatedly if an order-process is not terminated (9).
I tend to inquire repeatedly if a task delegated is not terminated (10).
I tend to inquire repeatedly if a governmental decision is pending (11).
The response to questions I asked to my colleagues is in most cases not fast enough (13).
I love to work through piles of material to prepare myself for decisions (17).
After deletion of the one item mentioned above there remains one item referring to private life:
It is difficult for me to listen to private conversations on topics which do not immediately concern me (3). No specific situational aspect is addressed by the following items:
Waiting for restaurant services is difficult for me (1). Waiting in a telephone-line is difficult for me (2). Waiting causes physical reactions for me (5). Even without further appointments I get angry to
encounter transfer times when changing planes (6). Even without further appointments I try to avoid
longer rail travel (7).
Even without further appointments I try to circumvent traffic jams on highways (8).
Frequently I switch waiting-lines in front of counters (14).
Frequently I switch lanes on highways when traffic is dense (15).
I like to decide spontaneously (16). I like to be meticulous (18).
I dislike long-winding arguments (19).
As mentioned, the theoretical reasoning by Blount and Janicik [4, 5] and by Dudley [10] provided a starting point for the choice of items: Item 1 is almost identically used by Dudley [10, p. 82, item 58; p. 91, item 24). Items 2, 14 and 15 refer to similar situations in Dudley [10, p. 82, item 81; p. 91, items 2, 32). Item 5 was introduced to possibly cover patient behavior as different from patient emotions covered by other items [10, p. 16 et seq.]. Items 3 and 4 are merged into one
item in Dudley [10, p. 83, item 98; p. 92, item 38], which is also addressed by item 19. Items 9, 10, 11 and 13 describe a situation where a person tries to “control things that are beyond (his/her) control” [10, p. 83, item 42; p. 91, item 19] or “to hurry others” [10, p. 83, item 14]. Item 16 is almost opposite to item 17 and 18, and both are addressed in Dudley [10, p. 82, item 51: “I tend to plan ahead”]. Being stuck in traffic is used by Blount and Janicik [10, p. 21]. Here, we cover the situation by item 8, which could be related to items 6 and 7.
We have not included items which evaluate situations of delay or which try to identify whether the reason for a delay is laid on others or on the respondent. Furthermore, it is not investigated whether the respondent is under strong time pressure or not. This explains the relatively short list of items. However, it is important to note that the items identified stem from theories which were outlined before.
The self-evaluation of impatience was appropriately re-coded to meet the expectation of positive correlation with the different items.
The questionnaire was pre-tested in German language with a convenience sample of five people. This led to minor rephrasing of statements. Respondents of the final version did not report on any difficulties to understand the items or to find answers. To provide anonymity no individual distribution of results was promised. Still, a substantial number of respondents identified themselves, and asked for the results.
3. Results
In total, 38 male and 60 female respondents participated. The data was analyzed by use of Stata13 software. The average age is 34.6 years for the male respondents, and 40.7 years for the female respondents. The overall average age is 38.3 years. The overall self-evaluation of patience is 2.89 (s.d.=1.26), and the imagined evaluation of a friend is 2.61 (s.d.=1.24). Both evaluations are strongly correlated (r=.71, p=.01). In 39% of all cases the evaluations were identical, in 53% the imagined evaluation of the friend was thought to judge the respondent to be more patient than the person himself or herself, in the remaining 8% of the cases it is the other way round. Thus, there is only little difference in these two measures.
Considering the average of the self-evaluation, we find no significant difference of patience between male and female respondents (µ=2.86 vs. µ=2.91). With respect to age, only the group of respondents who are 50 years or older appear to be significantly more patient (µ=2.2) than the respondents under the age of 30 (µ=3.2), or in the age group of 30 to 49 (µ=2.8). This is consistent with earlier findings of non-significant differences in groups with relatively small age differences [29].
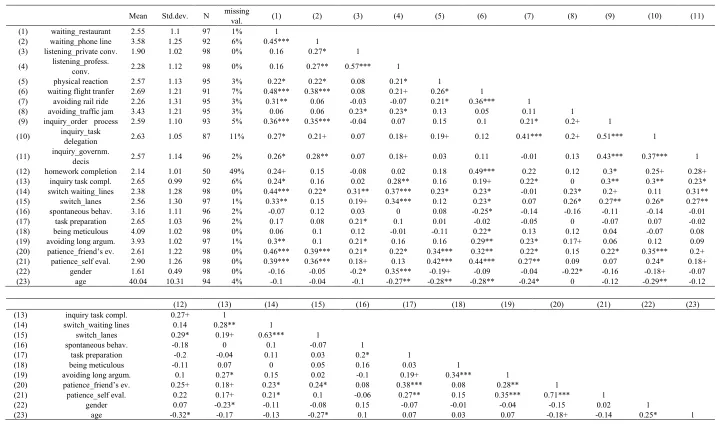
Table 1. Descriptive statistics of items.
Mean Std.dev. N missing val. (1) (2) (3) (4) (5) (6) (7) (8) (9) (10) (11)
(1) waiting_restaurant 2.55 1.1 97 1% 1
(2) waiting_phone line 3.58 1.25 92 6% 0.45*** 1
(3) listening_private conv. 1.90 1.02 98 0% 0.16 0.27* 1
(4) listening_profess. conv. 2.28 1.12 98 0% 0.16 0.27** 0.57*** 1
(5) physical reaction 2.57 1.13 95 3% 0.22* 0.22* 0.08 0.21* 1
(6) waiting flight tranfer 2.69 1.21 91 7% 0.48*** 0.38*** 0.08 0.21+ 0.26* 1
(7) avoiding rail ride 2.26 1.31 95 3% 0.31** 0.06 -0.03 -0.07 0.21* 0.36*** 1
(8) avoiding_traffic jam 3.43 1.21 95 3% 0.06 0.06 0.23* 0.23* 0.13 0.05 0.11 1
(9) inquiry_order process 2.59 1.10 93 5% 0.36*** 0.35*** -0.04 0.07 0.15 0.1 0.21* 0.2+ 1
(10) inquiry_task delegation 2.63 1.05 87 11% 0.27* 0.21+ 0.07 0.18+ 0.19+ 0.12 0.41*** 0.2+ 0.51*** 1
(11) inquiry_governm. decis 2.57 1.14 96 2% 0.26* 0.28** 0.07 0.18+ 0.03 0.11 -0.01 0.13 0.43*** 0.37*** 1
(12) homework completion 2.14 1.01 50 49% 0.24+ 0.15 -0.08 0.02 0.18 0.49*** 0.22 0.12 0.3* 0.25+ 0.28+
(13) inquiry task compl. 2.65 0.99 92 6% 0.24* 0.16 0.02 0.28** 0.16 0.19+ 0.22* 0 0.3** 0.3** 0.23*
(14) switch waiting_lines 2.38 1.28 98 0% 0.44*** 0.22* 0.31** 0.37*** 0.23* 0.23* -0.01 0.23* 0.2+ 0.11 0.31**
(15) switch_lanes 2.56 1.30 97 1% 0.33** 0.15 0.19+ 0.34*** 0.12 0.23* 0.07 0.26* 0.27** 0.26* 0.27**
(16) spontaneous behav. 3.16 1.11 96 2% -0.07 0.12 0.03 0 0.08 -0.25* -0.14 -0.16 -0.11 -0.14 -0.01
(17) task preparation 2.65 1.03 96 2% 0.17 0.08 0.21* 0.1 0.01 -0.02 -0.05 0 -0.07 0.07 -0.02
(18) being meticulous 4.09 1.02 98 0% 0.06 0.1 0.12 -0.01 -0.11 0.22* 0.13 0.12 0.04 -0.07 0.08
(19) avoiding long argum. 3.93 1.02 97 1% 0.3** 0.1 0.21* 0.16 0.16 0.29** 0.23* 0.17+ 0.06 0.12 0.09
(20) patience_friend’s ev. 2.61 1.22 98 0% 0.46*** 0.39*** 0.21* 0.22* 0.34*** 0.32** 0.22* 0.15 0.22* 0.35*** 0.2+
(21) patience_self eval. 2.90 1.26 98 0% 0.39*** 0.36*** 0.18+ 0.13 0.42*** 0.44*** 0.27** 0.09 0.07 0.24* 0.18+
(22) gender 1.61 0.49 98 0% -0.16 -0.05 -0.2* 0.35*** -0.19+ -0.09 -0.04 -0.22* -0.16 -0.18+ -0.07
(23) age 40.04 10.31 94 4% -0.1 -0.04 -0.1 -0.27** -0.28** -0.28** -0.24* 0 -0.12 -0.29** -0.12
(12) (13) (14) (15) (16) (17) (18) (19) (20) (21) (22) (23)
(13) inquiry task compl. 0.27+ 1
(14) switch_waiting lines 0.14 0.28** 1
(15) switch_lanes 0.29* 0.19+ 0.63*** 1
(16) spontaneous behav. -0.18 0 0.1 -0.07 1
(17) task preparation -0.2 -0.04 0.11 0.03 0.2* 1
(18) being meticulous -0.11 0.07 0 0.05 0.16 0.03 1
(19) avoiding long argum. 0.1 0.27* 0.15 0.02 -0.1 0.19+ 0.34*** 1
(20) patience_friend’s ev. 0.25+ 0.18+ 0.23* 0.24* 0.08 0.38*** 0.08 0.28** 1
(21) patience_self eval. 0.22 0.17+ 0.21* 0.1 -0.06 0.27** 0.15 0.35*** 0.71*** 1
(22) gender 0.07 -0.23* -0.11 -0.08 0.15 -0.07 -0.01 -0.04 -0.15 0.02 1
(23) age -0.32* -0.17 -0.13 -0.27* 0.1 0.07 0.03 0.07 -0.18+ -0.14 0.25* 1
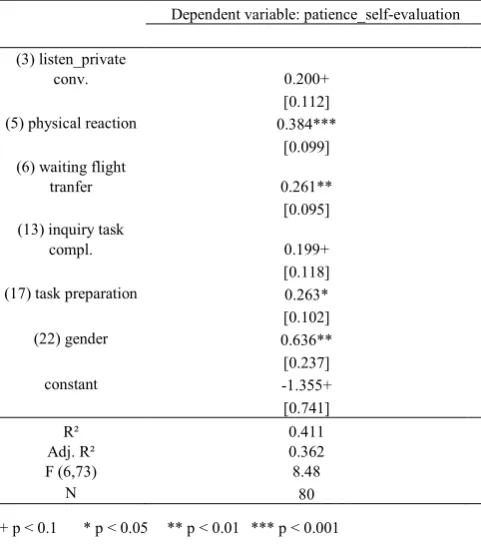
[image:4.842.68.787.88.513.2]Substantial inter-variable correlation speaks against a linear regression analysis with all items. Therefore, a step-wise deletion of items was performed (Table 2). This resulted in a solution with gender as a control, and five items. All items have the expected positive sign. Two of the five items do not meet the 5% significance level, namely “the response to questions I asked to my colleagues is in most cases not fast enough (13)” and “it is difficult for me to listen to private conversations on topics which do not immediately concern me (3)”. Three items have significant regression coefficients: “Waiting causes physical reactions for me (5), even without further appointments I am angry to encounter transfer times when changing planes (6), the response to questions I asked to my colleagues is in most cases not fast enough (13)”. There is little inter-item correlation. These items refer to professional and to private situations. Male respondents perceive themselves as less patient than female respondents. Interestingly, the majority of the items do not enter the regression procedure, although they refer to different situations of delay requiring tolerance. This indicates that these theory-based items are mostly independent from the self-evaluation of patience.
Table 2. Regression results of a step-wise item deletion.
Dependent variable: patience_self-evaluation
(3) listen_private
[image:5.595.57.298.376.649.2] [image:5.595.314.550.423.647.2]conv. 0.200+
[0.112]
(5) physical reaction 0.384***
[0.099] (6) waiting flight
tranfer 0.261**
[0.095] (13) inquiry task
compl. 0.199+
[0.118]
(17) task preparation 0.263*
[0.102]
(22) gender 0.636**
[0.237]
constant -1.355+
[0.741]
R² 0.411
Adj. R²
F (6,73) 0.362 8.48
N 80
+ p < 0.1 * p < 0.05 ** p < 0.01 *** p < 0.001
We cannot know whether the items which regress on the self-evaluation of patience represent constructs which are eliminated because of their inter-item correlation. To understand this better, we performed an exploratory factor analysis with the intention to regress the stable factors on the self-evaluation of patience. As the number of observations was too small to accommodate all 18 items simultaneously (after the elimination of item 12 for lack of observations in 50 cases, as mentioned above), we eliminated further three
items which had unsatisfying correlations with both the self-evaluation of patience as well as the imagined evaluation of patience by a friend. These were the items 8 (avoiding traffic jams by taking detours), 16 (spontaneous decision making) and 18 (being meticulous). Before conducting the factor analysis we performed the Shapiro-Francis test for normality of the variables [27]. Only one item (7) of the remaining items was not normally distributed at the 5% level. Since normality is not a necessary condition for performing an exploratory factor analysis but merely enhances the solution, we decided against dropping the item [30]. The Kaiser-Meyer-Olkin measure of sampling adequacy is .70, and thus at an acceptable level [14]. Bartlett’s test for sphericity is significant at p<.001, which suggest that the data is suitable for a factor analysis [2]. We start with five factors and eliminate items in six steps which have an unsatisfactorily low (<.5) factor loading (item 5: waiting causing physical reactions) or which load on more than one of the factors (items 14 (switching waiting lines), 7 (avoiding rail travel), 13 (response to questions asked to colleagues) and 15 (switching lanes on highways) in this order). The scree-plot of the final factor analysis does not show a clear breaking point (Figure 1). In identifying a solution with four factors we follow the Kaiser-Meyer-Olkin criterion with eigenvalues greater than one, on which 10 items load (Table 3). Overall Cronbach’s alpha is .72.
Table 3. Results of the exploratory factor analysis (Principal-component analysis, orthogonal varimax).
Factor (1) (2) (3) (4) Communality
Eigenvalue 2.01 1.81 1.58 1.36
waiting_restaurant 0.734 0.726
waiting_phone
line 0.607 0.554
listening_private
conv. 0.850 0.782
listen_profess.
conv. 0.855 0.756
waiting flight
transf. 0.885 0.787
inquiry_order
process 0.822 0.724
inquiry_task
deleg. 0.744 0.594
inquiry_govern.
dec. 0.766 0.615
task preparation 0.849 0.728
avoiding long arg. 0.644 0.501
N 72
(blanks represent abs. loading < 0.4)
Convergent
validity CR AVE Factor 1 Factor 2 Factor 3 Factor 4
Factor 1 0.707 0.455 0.675
Factor 2 0.700 0.446 0.492 0.668
Factor 3 0.748 0.616 -0.073 0.186 0.785
Figure 1. Scree plot of eigenvalues after factor analysis
Factor 1 loads on items 9, 10 and 11. All items refer to the expected termination of processes, which are not under control of the respondent. These refer to the professional life of the respondents. The factor describes a desire to control or to follow up on processes. The items describe activities. Cronbach’s alpha is .70.
Factor 2 loads on items 1, 2 and 6. These items represent difficulties to accept waiting for services, be that in a restaurant, a telephone line or during a flight transfer. None of these can be immediately influenced by the respondent. The items describe passive waiting. The situations are not specific to either professional or private life. Cronbach’s alpha is again .70.
Factor 3 loads on items 3 and 4. Both items refer to the difficulty to listen to conversations of no or only remote interest. This occurs in private as well as in professional life. The items indicate an interest in others beyond self-interest or, if negatively interpreted, a strong focus of interest. Cronbach’s alpha is .72.
Factor 4 loads on items 17 and 19. Item 17 is typical for well-organized or well-prepared decision making, particularly in the professional environment. Item 19 has no specific environmental connotation. The respondents get angry if arguments do not hit the point or are long-winding. One of the items seems to represent a physical activity, while the other is indicative of a cognitive process. At first sight, both seem to be related to each other. Thus, the items describe a desire for definiteness. However, Cronbach’s alpha is unsatisfactorily low .32. The low value might reflect that one of the items represents a behavior, while the other one represents a cognition.
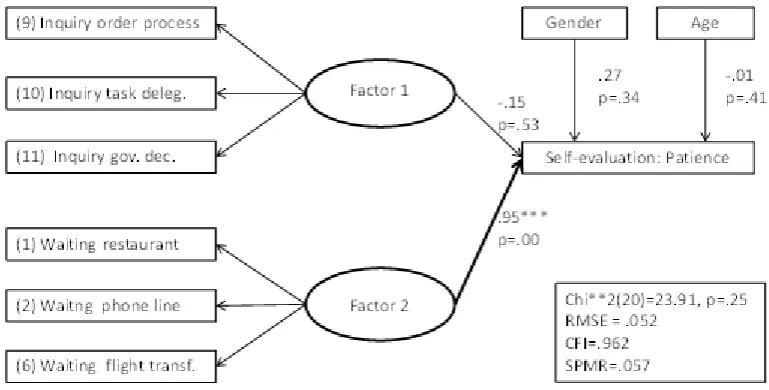
Except for the third factor, all factors are positively correlated with the individual’s self-evaluation of patience. However, Factor 3 seems to indicate that interest in others is more a matter of gender, being more expressed among male respondents. Therefore, we do not regress this Factor on the self-evaluation of patience. The same applies to the fourth factor because of its low Cronbach’s alpha. Thus, only Factors 1 and 2 together with the control variables are included in a structural equation model with the self-evaluation of patience as the variable to be explained. As a result, only Factor 2 shows a significant result.
Compared with the result of the step-wise regression this is even more astonishing (Figure 2). Only three of the 18 items which load on Factor 2 are significantly and positively related with the self-evaluation. As before, the question arises whether the excluded items represent different types of patience or whether they have no relation to patience, although they were derived from a theoretical background. It should be recognized that in accumulating items to factors we lose information, as well as by the reduction of observations as a consequence of missing observations. Therefore, the results based on factors are not immediately comparable with the earlier regression analysis.
Figure 2. The exporatory factor model for self-evaluation of patience
0
1
2
3
E
ige
nv
alu
es
0 2 4 6 8 10
[image:6.595.111.496.518.713.2]4. Discussion
Our results are puzzling, particularly if the general acceptance of a unidimensional measure of patience tied to self-evaluation or interest rate is considered. As postulated in our main hypothesis, our study indicates that patience should be considered as a multi-dimensional construct. When strong correlations between self-evaluated patience and interest rates occur, this may refer to only particular dimensions of patience. These dimensions are represented by the items which enter the regressions either directly or indirectly via an analysis of factors.
The items considered in this study were chosen on a broad theoretical base described by Blount and Janicik [4, 5]. The fact that only few of them load on factors and that only a subset of them can be regressed on self-evaluated patience can have three reasons. Either it sheds doubts on the underlying theories which led to the item selection or it questions the operationalizations of the items or it strengthens our view of a concept of patience which is multi-dimensional.
We observe that Factor 3 (interest in others) seems to be related more to gender than directly to patience. We wonder whether this could be manipulated, and what consequences should be drawn from the differences for communication. For instance, if substantiated, it could suggest including female and male participants in situations which involve the use of patience. However, our analysis as well as other empirical studies, set out to measure patience at an individual level. It would be fruitful to analyze how the interaction of individuals in a group is reflected in individual and group measures of patience.
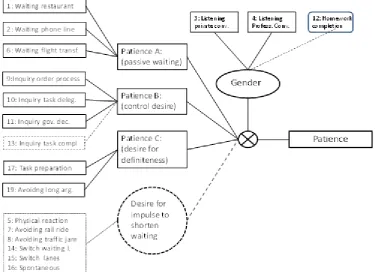
Based on our empirical results we derive a multi-dimensional concept of patience and its measurement which is summarized in Figure 3. We propose that there exist various types of patience. These might be different manifestations of an overall concept of patience.
The self-evaluations seem to represent only one of these types of patience. We have labeled this Patience A. It is characterized by passive waiting and the frustration which is caused by this. The relation of Patience A to the items or to the overall concept of patience appears to be moderated by gender as a control variable. Gender itself represents the interest in others beyond self-interest, as already captured by Factor 3. Had it been possible to include the item describing the patience in supervising children’s homework, we would have expected it to be included at this stage. This is indicated by a dotted line in Figure 3.
A second type of patience (patience B) is related to Factor 1. The desire for control processes involves activities. This indicates a major difference from patience A. We had expected that item 13 would have loaded on the same factor because it reflects a similar desire. Because we have no empirical evidence we again use dotted lines to indicate our presumption.
[image:7.595.115.491.470.742.2]Patience C is largely explained by Factor 4. The factor describes a desire for definiteness. One of the items refers to a behavior which requires patience, the other item refers to a passive feeling which identifies impatience. In our conceptual thinking item 18 might also play a role here, however, it is not correlated with any of the other items. This could mean that it does not have to do with patience in any of its possible forms.
Then, we have a number of items which are singular. The items 5, 7, 8, 14, 15, and 16 measure different types of impulses to cope with a waiting situation. All items indicate some activities. For instance, item 5 could be observed by trembling fingers, restless legs, walking back and forth etc. Whether all of these represent different types of patience or whether further studies will prove that they load on one or more factors or whether these studies prove them to be irrelevant for a measurement of patience needs further research. As can be seen in Table 1 only the behavior of switching waiting lines and of changing lanes on highways are strongly correlated. Five of the remaining 14 correlations among these items are relatively small, the remainder is spurious. At present this leaves us with five candidate items to expand the types of patience. Because of the lack of strong empirical evidence at this point we use dotted lines to depict the relationships, as before.
Figure 3 proposes a concept for a multidimensional representation of patience and its measurement. Patience related to desires for active behaviors or patience related to passiveness seems to be different types of patience. Furthermore, patience observed in professional environments could be different from patience in a private environment.
A differentiation of types of patience could contribute to specifically explain particular situations. We have mentioned above that patience is correlated with particular behaviors. Anecdotal evidence suggests that patience might be related to influencing innovation processes, change processes and business results in general. We suggest that a multidimensional measure of patience could be regressed on business results. We assume that very little patience as well as extremely high patience might be attributed to non-optimal results, and the optima of patience could be different for passive and for active types of patience. If so, the question arises whether decision makers can be instructed to identify their level of patience and whether this can be manipulated to achieve better results. Our study does not suggest that it should be necessary in this case to measure patience at the individual level exclusively with reference to a professional task environment.
5. Limitations
Our study is suggestive, but it has many limitations. The questionnaire we used asked to self-evaluate a person’s patience and to also imagine a friend’s evaluation. The correlation of both measures is r=0.71 (p=.01). The latter is not an external validation of the evaluation measure. A true external evaluation might lead to different results. One might study whether self-evaluations or true external evaluations of patience are more relevant in explaining behavior. Differences might be important in explaining team decisions. Also, we do not know whether there exist two separate scales to measure different degrees of impatience reaching
from high impatience to low impatience, and from high patience to low patience or whether patience and impatience are the endpoints of a single continuum from low patience (indicative at the same time of high impatience) to high patience (indicative of low impatience). In case of two scales these might not be completely independent of each other. It might be valuable to design a study which would shed light on this question. Indeed, Blount and Janicik [4,5] seem to have had two scales in mind, one scale measuring impatience and another one measuring patience. Two scales are explicitly imagined in a recent statement by Federal Reserve chief Yellen with respect to future monetary policy: “Just because we removed the word patience from the statement doesn’t mean we’re going to be impatient” [19]. Patience C in this study hints at different perceptions of patience and of impatience.
Many empirical studies on measuring patience were performed with students. Our study was performed with employees. If one intends to use patience as an influencing factor to explain business decisions it seems advisable to test the concept with business professionals. The opportunity cost of time could be different between both groups, and this could interact with the self-evaluations of patience. The multidimensional character of patience which was brought about in the analyses could mean that substantial differences exist between social groups with respect to their respective typical types of patience.
Our study did not relate to any particular situations for decision making. In other studies [4, 8, 29] particular waiting situations were used to deal with the participants. We do not know whether particular decision situations are correlated with types of patience. However, the difference between tolerance and postponement indicates that this could be relevant. Also, whether more short-term decisions or more long-term decisions initiate different levels or types of patience is not known to us. In studies regressing interest rates on patience the temporal decision space might range from seconds (as in the behavior towards videos or television advertising) to hours or even months (as in the experimental studies which promise higher rewards for the postponement of consumption). On the background of a multidimensional measure of patience we would assume that the appropriate measure varies according to the situational conditions.
Cluster 3 with 37.68% of the respondents shows almost average patience with respect to Factor 4 but substantially smaller than average values of patience for the remaining three factors. Collecting personality characteristics corresponding to the Type A and Type B individuals together with a multi-dimensional scale for patience might be of substantial interest.
Furthermore, our results as well as many others in this field concentrate on individuals. It is not clear how different levels of patience influence group decisions.
In spite of the limitation, our exploratory study shows that patience is a multi-dimensional construct. More empirical research could help to broaden our knowledge on the dimensions of patience. This, in turn, might be useful to better understand behavioral consequences of patience.
Acknowledgements
We would like to thank Professor Dieter Frey, University of Munich, for his helpful remarks and encouragement.
REFERENCES
Z. Akin, Intertemporal decision making with present biased [1]
preferences, Journal of Economic Psychology, 33(1), 30-47, 2012.
M. Bartlett, Properties of Sufficiency and Statistical Tests, [2]
Proceedings of the Royal Statistical Society, Series A, 160, 268-282, 1937.
E. Bettinger, R. Slonim, Patience among Children, Journal of [3]
Public Economics, 91(1-2), 343-363, 2007.
S. Blount, G.A. Janicik, Comparing social accounts of [4]
patience and impatience, unpubl. manuscript, Univ. of Chicago, 1999.
S. Blount, G.A. Janicik, What makes us patient? The role of [5]
emotion in sociotemporal evaluation, unpubl. Manuscript, Univ. of Chicago, 2000.
E. v. Böhm-Bawerk, The Positive Theory of Capital, London: [6]
Macmillan & Co. 1891.
K. Brockhoff, N. Dobberstein, Zapping: Zur Umgehung von [7]
TV-Werbewahrnehmung, Marketing ZFP, 11(1), 27 – 40, 1989.
X. Dai, A. Fishbach, When waiting to choose increases [8]
patience, Organizational Behavior and Human Decision Processes, 121, 256-266, 2013.
L. Delaney, O. Doyle, Socioeconomic differences in early [9]
childhood time preferences, Journal of Economic Psychology, 11(2), 237-247, 2012.
K.C. Dudley, Empirical Development of a Scale of Patience, [10]
PhD Diss., West Virginia University, Morgantown, WV. 2003.
I. Fisher, Theory of Interest, as determined by impatience to [11]
spend income and opportunity to invest it, (Reprint: Clifton (1974): Augustus Kelley) 1930.
M. Friedman, Type A Behavior: Its Diagnosis and Treatment. [12]
New York: Plenum Press (Kluwer Academic Press) 1996. W. T. Harbaugh, K. Krause, L. Vesterlund, Risk Attitudes of [13]
Children and Adults: Choices over Small and Large Probability Gains and Losses, Experimental Economics, 5 (1), 53-84, 2002.
H. F. Kaiser, An Index of Factorial Simplicity, [14]
Psychometrika, 39 (1), 31-36, 1974.
T.M. Kashner, Present-Future Gratification Tradeoffs: Does [15]
Economics Validate Psychometric Studies? Journal of Economic Psychology, 11 (2), 247-268, 1990.
A.S. Krishnan, R.K. Sitaraman, Video Stream Quality [16]
Impacts Viewer Behavior: Inferring Causality Using Quasi-Experimental Designs, in: Byers, J. W., Kursoe, J., Mahajan, R., Proceedings of the 12th ACM SIGCOM
Conference on Internet Measurement, IMC ’12, Boston, MA: Internet Measurement Conference, 2012.
D. Laibson, Golden Eggs and Hyperbolic Discounting, The [17]
Quarterly Journal of Economics, 112 (2), 443-477, 1997. I. P. Levin, S. S. Hart, J. A. Weller, L. A. Harshman, [18]
Stability of Choices in a Risky Decision-Making Task: A 3-Year Longitudinal Study with Children and Adults, Journal of Behavioral Decision Making, 20 (3), 241-252, 2007.
marketwatch, 2015, [19]
marketwatch.com/story/highlightsoftheYellenpressconferenc e (downloaded March 21, 2015).
St. Meyer,Ch. Sprenger, Ch., Present-Biased Preferences and [20]
Credit Card Borrowing, American Economic Journal: Applied Economics, 2(1), 193-210, 2010.
C. Müßgens, Reeder in Not, Frankfurter Allgemeine Zeitung, [21]
December 23rd, p. 26, 2014.
J. Noor, Hyperbolic Discounting and the Standard Model: [22]
Eliciting Discount Functions, Journal of Economic Theory, 144 (5), 2077-2083, 2009.
D. Prelec, Decreasing Impatience: A Criterion for [23]
Non-Stationary Time Preference and ‘Hyperbolic’ Discounting, Scandinavian Journal of Economics, 106 (3), 511-532, 2004.
K. I. M. Rohde, Decreasing relative impatience, Journal of [24]
Economic Psychology, 30 ( ), 831-839, 2009.
A. Rubinstein, Economics or Psychology? The case of [25]
hyperbolic discounting, International Economic Review, 35 (2), 185-199, 2003.
P. A. Samuelson, A note on measurement of utility, The [26]
Review of Economic Studies, 4 (2), 155-161, 1937.
S. S. Shapiro, R. S. Francia, Approximate Analysis of [27]
Variance Tests for Normality, Journal of the American Statistical Association, 67, 215-216, 1972.
T. Shavit, M. Rosenboim, Y. Shani, Time preference before [28]
M. Sutter, M. Kocher, M., S. Glätzle-Rützler, S. Trautmann, [29]
Impatience and Uncertainty: Experimental decisions predict adolescents‘ field behavior, American Economic Review, 103 (1), 510-531, 2013.
B. G. Tabachnik, S. Fidell, Multivariate Statistics, 5th ed.,
[30]
Boston: Allyn and Bacon, 2007.
T. Vischer, et al., Validating an ultra-short measure of [31]