Journal of Chemical and Pharmaceutical Research, 2012, 4(9):4289-4295
Research Article
CODEN(USA) : JCPRC5
ISSN : 0975-7384
Comparison of RNA isolation from FFPE tissue on two different platforms
Suphasarang Sirirattanakul
1, Tewin Tencomnao
2, Pongsak Wannakrairot
3,
Rachana Santiyanont
2*
1
Graduate program in Clinical Biochemistry and Molecular Medicine, Department of Clinical
Chemistry, Faculty of Allied Health Sciences, Chulalongkorn University, Bangkok 10330,
Thailand
2
Center for Excellence in Omics-Nanomedical Technology Development Project, Department of
Clinical Chemistry, Faculty of Allied Health Sciences, Chulalongkorn University, Bangkok
10330, Thailand
3
Department of Pathology, Faculty of Medicine, Chulalongkorn University, Bangkok 10330,
Thailand
_____________________________________________________________________________________________
ABSTRACT
Formalin-fixed paraffin embedded (FFPE) tissue is a tissue obtained from dissection of the patients’ lesion and is well preserved as a paraffin block. This specimen is regarded as a wealthy resource for RNA studies in various diseases for the advantages of not only diagnosis and prognosis, but also treatment. The aim of our study was to demonstrate that amplifiable RNA could be recovered from FFPE tissues using paramagnetic bead-based isolation technique. RNA isolated on manual and automated platforms was compared for their integrity, yield and purity. Expression of three housekeeping genes from the isolated RNA products was used as a tool to confirm amplificability of the isolated RNA of different amplicon sizes. The results showed that RNA could be successfully recovered from a 10 µm FFPE tissues of 20 samples. The manual platform gave better result for A260/A280 absorbance ratio (1.93±0.009 vs 1.82 ±0.007; p<0.05), whereas the automated platform showed better result with regard to quantity (19.31±2.530 vs 8.87 µg ±1.468 µg). Using reverse transcription polymerase chain reaction (RT-PCR), isolated RNA obtained from both platforms could be achieved with amplicon size up to 656 bp. In this study, we successfully isolated RNA from FFPE tissues using manual and automated platforms under the paramagnetic bead-based scheme with good quality and quantity of the RNA products. Noteworthy, the results also showed longer length of amplified product derived from isolated RNA of FFPE than any other previous reports.
Keywords: Formalin-fixed paraffin embedded, FFPE, RNA isolation, paramagnetic bead-based, manual platform,
automated platform
_____________________________________________________________________________________________
INTRODUCTION
Low quality of RNA is a problematic feature in downstream RNA-based analysis such as a commonly used method for gene expression analysis, reverse transcription polymerase chain reaction (RT-PCR). Formalin-fixed paraffin embedded (FFPE) tissue, a valuable RNA source, is challenging regarding to RNA degradation, RNA cross-linking with other molecules due to chemical modifications, and limited amount of samples available, which considerably affects its use in downstream applications. Formalin fixation modifies RNA by adding mono-methylol (N–CH2OH)
groups to amino group of all four bases, and also forms methylene bridge between neighboring bases (N-CH2-N)
isolated RNA from FFPE is usually fragmented resulting in size limitation in PCR amplification [5, 6]. Hence, various principles for nucleic acid isolation were developed such as phenol-chloroform method, adsorption method, and density gradient centrifugation method [7]. According to currently available principle, an adsorption method along with magnetic particles was chosen for this study. There are many advantages of using magnetic bead-based separation. Firstly, the particles are possibly separated under magnetic field, thus avoiding a centrifugation step, which often leads to the degradation of nucleic acid. Secondly, commercial kits for numerous sample sources such as tissues, blood samples, cultured cells using the immobilized affinity of magnetic bead to target nucleic acid are accessible. Moreover, due to the easy and achievable magnetic bead-based method, commercial kits are available in both manual and automated platforms [8].
RNA quality is usually defined in terms of RNA purity and RNA integrity, which are accepted as an important concern to ensure reliability and reproducibility of downstream applications. According to a spectrophotometric viewpoint, RNA purity is represented by absorbance ratios of A260/A280, A260/A230, and also A260/A240 [9].The high A260/A280 ratio reflects RNA with little protein contamination. The greater A260/A230 ratio is considered as less residual organic compound contamination such as phenol and alcohol. The A260/A240 ratio less than 1.4 indicates too much salt in sample. However, determination of RNA purity using only the absorbance values and absorbance ratios may not be reliable [10]. These values and ratios provide no information about RNA degradation and sizes of amplifiable amplicons. The 28s/18s ribosomal RNA proportional band is commonly used to define rRNA integrity, thus reflecting mRNA integrity. Though, this approach may be inappropriate for highly degraded RNA from FFPE, which is normally found less than 300 bp in size, and may provide no information on the ability of the isolated RNA to be amplified through RT-PCR. It still remains to be determined whether the extracted RNA can be used as the starting material for the downstream applications [11, 12].
FFPE tissue has been used routinely in clinical diagnosis for decades. We believe that the use of expression profiling based on archival FFPE tissue for identifying new molecular will not only aid diagnosis, but also guide treatment of cancer. For example, estrogen receptor 1 mRNA from FFPE was shown as a prognostic factor in ovarian carcinoma (Darb-Esfahani et al., 2009). Expressions of miRNA in FFPE rectal cancer tissues were found to be predictors of response to neoadjuvant chemoradiation therapy (Kheirelseid et al., 2012). Thymidylate synthase and dihydropyrimidine dehydrogenase mRNA levels on FFPE specimens were considered as predictors for distant recurrence of rectal cancer treated with preoperative chemoradiotherapy (Tanaka et al., 2012). In addition, using FFPE samples, the human epidermal growth factor receptor (HER) family mRNA expression was evaluated for the prognostic ability in breast cancer and for the predictive value with respect to treatment with paclitaxel (Koutras et al., 2008). Therefore, in this study, we tested two platforms of the commercially available RNA extraction kits for their ability to purify amplifiable RNA; the first one was manual platform using FormaPure kit, and another one was automated platform using SPRI-TE FFPE NA extraction kit.
EXPERIMENTAL SECTION
FFPE tissue samples
In this study, 20 different FFPE blocks of breast cancer tissues obtained from patients at King Chulalongkorn Memorial Hospital, who have been previously diagnosed as having breast cancer based on their histopathologic results, were used. The study was approved by the Institutional Review Board (IRB), Faculty of Medicine, Chulalongkorn University (COA No. 111/2012). All samples were collected as anonymous and without clinical data or patient related information. From each sample block, we collected 4 consecutive 10 µ m sections. In particular, the first two were used for manual extraction, while the other two were for automated extraction. Since there was one block containing 5 consecutive sections, we had 81 sections totally. Each section was placed into an individual 1.5 ml sterilized microcentrifuge tube, and stored at 4°C until extraction was performed (about 2 weeks).
RNA extraction
The automated platform was performed on SPRI-TETM Nucleic Acid Extractor with SPRI-TE FFPE NA Extraction Kit (Nucleic acid extraction from formalin fixed, paraffin embedded tissue). Paraffin melting and digestion steps were manually processed with chemicals provided in the extraction kit, while other steps including binding, washing and elution were performed using SPRI-TETM Nucleic Acid Extractor. Final volume was set to 50 µl, and the product was kept at -80°C until further analyses.
Figure 1. Schematic principle for FFPE extraction using magnetic beads-based method; practical time as stated by manufacturer for a round of manual platform (6 tubes) is 2 h 42 min, and for a round of automated platform (10 tubes) is 2 h 37 min.
RNA measurement
Isolated RNAs were quantified by UV absorption (Thermo Scientific NanoDrop™ 1000 spectrophotometer, Wilmington, DE, USA). The absorbance was measured at 260 nm, 280 nm, 240 nm and 230 nm. Absorbance ratios of A260/A280 and A260/A230 should be very close to 2.00 to determine RNA purity, whereas A260/A240 should be around 1.4 [13].
Recovery of RNA fragments
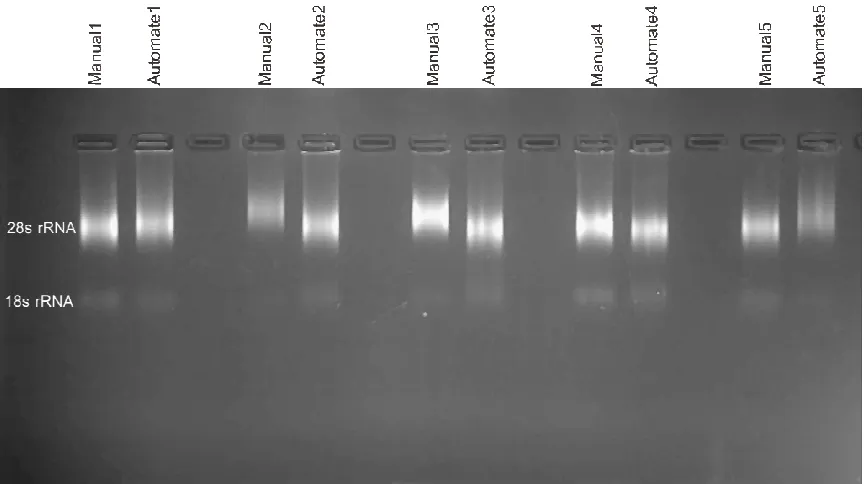
The isolated RNAs from both platforms (n=5) were randomly selected for electrophoresis on denaturing agarose gel that was 1% agarose gel prepared using formaldehyde denaturing condition with MOPS (morpholinopropanesulphonic acid) buffer, followed by ethidium bromide (EtBr) staining. Samples were loaded onto the gel and electrophoresed. The proportion of 28s rRNA and 18s rRNA bands were observed under UV light of gel documentation system and analyzed by GeneTools software 3.08 (SynGene, Cambridge, UK). The intensity of 28s rRNA nearly 2 times above 18s rRNA was normally accepted as an intact RNA [14].
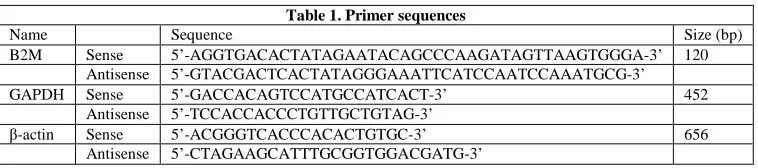
Table 1. Primer sequences
Name Sequence Size (bp)
B2M Sense 5’-AGGTGACACTATAGAATACAGCCCAAGATAGTTAAGTGGGA-3’ 120
Antisense 5’-GTACGACTCACTATAGGGAAATTCATCCAATCCAAATGCG-3’
GAPDH Sense 5’-GACCACAGTCCATGCCATCACT-3’ 452
Antisense 5’-TCCACCACCCTGTTGCTGTAG-3’
β-actin Sense 5’-ACGGGTCACCCACACTGTGC-3’ 656
Antisense 5’-CTAGAAGCATTTGCGGTGGACGATG-3’
Reproducibility of gene expression analysis using RT-PCR method
[image:3.595.118.497.497.581.2](Tris-acetate-EDTA) buffer on 2% agarose gel for GAPDH and β-actin, and 3% agarose gel for B2M, then visualized by ethidium bromide (EtBr) staining using gel documentation system, and ribosomal integrity was analyzed by GeneTools software 3.08 (SynGene, Cambridge, UK).
STATISTICAL ANALYSIS
SigmaPlot version 10 software (Systat Software, Inc., San Jose, CA, USA) and Microsoft Office Excel 2007 were used for statistical analysis. Means, medians, SDs, SEs and 95%CIs were calculated. Statistical significant difference between manual and automated platform was compared using Student t-test (p < 0.05).
RESULTS
The assessment of RNA integrity
[image:4.595.101.515.302.396.2]According to RNA measurement using NanoDrop™ 1000 spectrophotometer, RNA purity and yield under UV absorption were shown in Table 2. Absorbance ratio for 260/280 was significantly different between the two platforms (p < 0.05); manual platform gave better result with average ratio 1.93 (±0.009 SEM) vs 1.82 (±0.007 SEM) of the automated platform. However, both platforms provided good result for RNA purity (average ratio greater than 1.8). The automated platform was significantly better than the manual platform in term of quantity (p < 0.05). While total RNA obtained from automated platform can be seen up to 19.31 µg (±2.530 SEM), yield from manual method was 8.87 µg (±1.468 SEM).
Table 2. RNA measurement using NanoDrop™ 1000 spectrophotometer
Method of extraction
Manual method (n=20) Automated method (n=41) p value
mean SD SE 95%CI mean SD SE 95%CI
A260/A280 1.93 0.04 0.01 0.02 1.82 0.04 0.01 0.01 0.000*
A260/A230 1.77 0.49 0.11 0.23 1.59 0.35 0.05 0.11 1.22E-01
A260/A240 1.47 0.15 0.03 0.07 1.39 0.19 0.03 0.06 7.95E-02
RNA concentration (ng/µl) 177.41 131.27 29.35 61.44 386.15 323.95 50.59 102.25 7.62E-03*
Amount (µg) 8.87 6.56 1.47 3.07 19.31 16.20 2.53 5.11 7.62E-03*
*Student t-test (p < 0.05) was used to determine statistically significant difference between two extraction methods.
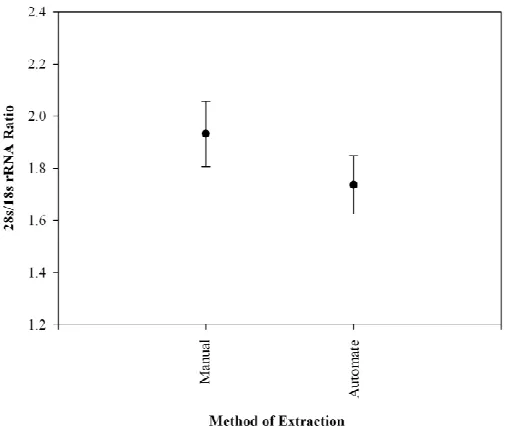
RNA on denaturing gel was observed in Figure 2a. The proportion of ribosomal RNA (28s/18s) was analyzed, and no significant difference between two platforms was observed (p>0.05). An estimated ratio was 1.93 ±1.257 and 1.74 ±0.1116 for manual and automated platforms, respectively (Figure 2b).
[image:4.595.89.522.467.710.2]Figure 2b. RNA integrity were expressed as mean ± SE of 28s/18s rRNA ratio which were 1.93 ± 1.257 and 1.74 ± 0.112 for manual and automatic platforms respectively.
RNA reproducibility
The reversely transcribed RNA was amplified during PCR process; B2M (Figure 3a), GAPDH (Figure 3b) and β -actin (Figure 3c) were chosen for different product sizes as targets. None of them was expressed significantly different between 2 platforms (p<0.05, n=5). However, not only the amplifiable products from RNA were found, but the products from genomic DNA were also observed. As seen in Figure 3b, the genomic DNA amplicons were created at the length of 557 bp.
DISCUSSION
Total RNAs were isolated from 61 FFPE sections using manual (FormaPure kit) and automated platforms (SPRI-TETM Nucleic Acid Extractor and SPRI-TE FFPE NA extraction kit) with the similar principle. Analytical and performance characteristics of the two platforms were compared including purity of isolated RNA, RNA integrity, RNA reproducibility and practicability.
For the manual platform, magnetic field is formed under magnetic separators, which are designed to held tubes of various sizes. The 6-tubes stand is designed for 1.5-1.7 ml tubes, while the 96-wells stand is designed for 0.2 ml microtubes. A variety of designed magnetic separators are appropriate to separate magnetic particles from different ranges of volume. The magnetic field for automated platform referred to SPRI-TETM Nucleic Acid Extractor is formed under magnetic bar, and the holders are restricted to 2 ml tubes (available in commercial kit). RNA isolation can be performed in10 tubes at the same time with the automated platform. Paraffin melting, nucleic acid de-crosslinking and tissue digestion steps are needed to perform manually in both platforms. Time spent for these steps is about 2 h 2 min. Time for binding, washing, separation and elution processes are about 40 min for 6 tubes under manual platform and around 35 min for 10 tubes using automated platform (Figure 1). As a result, both platforms are useful. The drawback of the automated platform is a costly machine, while the manual platform needs only simple apparatus such as water bath or heat block. It is of course time-consuming and laborious with respect to the manual one.
Figure 3. The PCR products were visualized by EtBr staining under gel documentation.
a. An expected product size of B2M from cDNA was 120 bp, and b. an expected product size of GAPDH was 452 bp, both of them were found at the expected size. c. However, β-actin was seen at the expected size of 656 bp in some samples.
The 28s/18s ribosomal RNA ratios were 1.93±1.257 and 1.74±0.112 for manual and automated platform, respectively, which was not significantly different (p>0.05), although it seemed to be higher in the manual platform. RT-PCR is used to demonstrate RNA-based downstream application. Three housekeeping genes: B2M, GAPDH and β-actin were tested, and intron-spaning primers were used to minimize genomic DNA interference. An expected amplicon sizes for B2M, GAPDH and β-actin were 120, 452, and 656 bp, respectively. All of them were successfully reversely transcribed and amplified by PCR (Figure 2a and 2b). Nevertheless, the length of 656-bp for β-actin was hardly seen in certain samples (Figure 3). The size of amplicons from this study seemed to be better than an average length of amplicons ever reported in previous works in which RNA recovered from FFPE tissues were around 200-300 bp [2, 17-19].
manual platform seemed to be better at the amplified short length (B2M), whereas, at amplified long length (GAPDH, and β-actin) were slightly better in RNAs isolated from the automated platform (data not shown).
In summary, RNA isolation from FFPE tissues is normally encountered with recovery and amplification ability. In this study, total RNA can be recovered from all FFPE samples via manual and automated platforms. Both platforms had given appropriate RNA in terms of yield, integrity, reproducibility and longer RNA fragments, thus serving as an alternative technique for RNA isolation.
Acknowledgements
This research work was financially supported by the 90th anniversary of Chulalongkorn University Fund (Ratchadaphiseksomphot Endowment Fund) and the Chulalongkorn University Centenary Academic Development Project. This study was financially supported by research grants from Chulalongkorn University Centenary Academic Development Project. Suphasarang Sirirattanakul received research assistant fellowship and teaching assistant fellowship from the Graduate School and the Faculty of Allied Health Sciences, Chulalongkorn University, respectively.
REFERENCES
[1] N Masuda, T Ohnishi, S Kawamoto, M Monden, K Okubo, Nucleic Acids Res. 1999, 27(22), 4436-4443. [2] S von Ahlfen, A Missel, K Bendrat, M Schlumpberger, PLoS One. 2007, 2(12), e1261.
[3] SM Hewitt, FA Lewis, Y Cao, RC Conrad, M Cronin, KD Danenberg, et al., Arch Pathol Lab Med. 2008, 132(12), 1929-1935.
[4] JY Chung, T Braunschweig, R Williams, N Guerrero, KM Hoffmann, M Kwon, et al., J Histochem Cytochem.
2008, 56(11), 1033-1042.
[5] SM Farragher, A Tanney, RD Kennedy, D Paul Harkin, Histochem Cell Biol. 2008, 130(3), 435-445. [6] S Bonin, F Petrera, B Niccolini, G Stanta, Mol Pathol. 2003, 56(3), 184-186.
[7] I Vomelova, Z Vanickova, A Sedo, Folia Biol (Praha). 2009, 55(6), 243-251. [8] S Berensmeier, Appl Microbiol Biotechnol. 2006, 73(3), 495-504.
[9] RE Farrell Jr. Chapter 6 - Quality Control for RNA Preparations. RNA Methodologies (4th Edition), Academic Press, San Diego, 2010, 139-154.
[10] JA Glasel, Biotechniques. 1995, 18(1), 62-63.
[11] S Imbeaud, E Graudens, V Boulanger, X Barlet, P Zaborski, E Eveno, et al., Nucleic Acids Res. 2005, 33(6), e56.
[12] NA Skrypina, AV Timofeeva, GL Khaspekov, LP Savochkina, R Beabealashvilli, J Biotechnol. 2003, 105(1-2), 1-9.
[13] RE Farrell Jr. Chapter 6 - Quality Control for RNA Preparations. RNA Methodologies (4th Edition), Academic Press, San Diego, 2010, 139-154.
[14] RE Farrell Jr. Chapter 9 - Electrophoresis of RNA. RNA Methodologies (4th Edition), Academic Press, San Diego, 2010, 179-219.
[15] CS Divya, MR Pillai, Mol Carcinog. 2006, 45(5), 320-332.
[16] S Fisker, B Hansen, J Fuglsang, K Kristensen, P Ovesen, H Orskov, et al., Eur J Endocrinol. 2004, 150(6), 773-777.
[17] U Lehmann, H Kreipe, Methods. 2001, 25(4), 409-418.