© 2015, IRJET ISO 9001:2008 Certified Journal
Page 33
Model Simulation System Dynamic Relating to the Availability
of Green Open Space in Medan City-Indonesia
Darwin Parlaungan Lubis
1, Alvi Syahrin
2, Budi Utomo
3, Delvian
41
Graduate school
, University of Sumatera Utara, Medan, Indonesia
2Faculty of Law, University of Sumatera Utara, Medan, Indonesia
3, 4Faculty of Agriculture, University of Sumatera Utara, Medan, Indonesia
---***---Abstract -
O
bjective of this research is to develop a
model of green open space management aimed at
development of green cities in Medan city which is
operationally elaborated with a view to: (1).
Establishing and simulating dynamic models which
relate physical, social, and economic factors to the
availability of a green open space in Medan City (2).
Formulating recommended policy strategies for green
urban development in Medan City.The findings of this
research suggest that: (1). In the dynamic analysis
model, there is a relationship among the biophysical,
social, and economic components. The simulation
results suggest that a decline occurs in the area of
green open spaces throughout the simulation year
period, i.e. from 10,830.06 Ha (2003) to 4,411.28 Ha
(2028); the total population during the simulation
year period which formerly was equal to 1,993,602
inhabitants (2003) will have increased to 2,620,700
inhabitants (2028); while the temperature from
27.80
oC (2003) increases to 28.50
oC (2028); and
finally, GDRB during the simulation year period which
formerly was equal to IDR 28,670.91 billion (2003)
increases to IDR 406,880.37 billion (2028). (2). There
are two strategies for green city development in
Medan City, namely: 1. The population policy strategy
by means of controlling population growth in the
downtown area as well as directing the population
growth toward the area outside the downtown,
namely towards the districts whose population density
is relatively still very low. 2. The policy strategy in the
form of green open spaces for the public, which is
undertaken by improving The the quantity and quality
of green open spaces for city parks and city forests.
Key Words:
Green Open Spaces, Dynamic Systems,
Medan City
1. Introduction
Development in Medan City is a series of sustainable development efforts which covers all the aspects of life. Medan City is a very attractive place for people to develop their social and economic life. The social and economic life affects population growth both naturally and by ways of migration, causing uncontrolled residential development and residential neighborhood in Medan City [1]. Whether it is realized or not, the population of Medan City has the very basic needs for the environment such as: healthy air, soil water availability, and space to facilitate social
interactions [1]. Therefore, it is necessary to have a space which is often called a green open space to facilitate such interactions which also serves as a public space. Rapid changes in land use in Medan City have evicted a green open space and developed it into built areas without any maximum control so as to marginalize the concept of a green city as a whole city ecological system [2].
The area of the built space in Medan City will continue to increase along with the development of the city. The analysis results of the landsat image map in 2009 reveal that the built area in Medan City increases to 14,096.46 Ha, which is quite large compared to that in 2005 with an area differential by approximately 347.16 Ha. If the annual increase is calculated starting from 2005, then it is estimated that the total built area increases by 86.79 Ha per year throughtout this period. This is due to the development of Medan City and therefore development of the region is done on a massive scale. Moreover, pressure in terms of land requirement for settlements of the hinterland population is also very high in this period and development of the Mebidang areas (which are comprised of Medan, Binjai and Deli Serdang) [1].
In general, the impacts resulting from urban management marginalization can be classified into two, namely the ecological impact and the socio-economic impact [3]. The rapid land conversion phenomenon by marginalization of the area of green open spaces has ecologically caused difficulties for Medan City to realize or maintain the protected area as an area designated for hydrological preservation, biodiversity development as well as the area to create microclimate and to reduce pollution [4].
© 2015, IRJET ISO 9001:2008 Certified Journal
Page 34
areas lack vegetation. As for the lowest temperature, it isfound in the vegetation land cover, specifically campus parks and zoos, which is equal to 27°C due to the dense vegetation cover.
2. Probem Formulation
Medan City has a strong determination to be an eco-friendly green city, which is characterized by the proportional existence of green areas. The difficulty of finding alternative green open space management in urban areas is resulted from the absence of specific research describing the characteristics or patterns and the carrying capacity of the green open space areas as well as the resulting implications, particularly the model to develop the green open space areas. Consequently, pragmatic efforts to solve a variety of problems relating to urban environments which practitioners continue to undertake often reach an impasse.
So far, studies of urban areas focus more on the economic improvement and studies urban designs [5,6]. While the research on environmental issues and the availability of green open space areas and the implications have not received much attention. Therefore, various studies should be conducted to develop models to develop the area of green open spaces in Indonesia in order that the pragmatic efforts to solve the problems in urban areas in Indonesia are not simply stuck using the theories of the West which are not necessarily appropriate to be applied in Indonesia [7]. This research aims to formulate the basic thoughts and the priority scale in an attempt to develop an approach to sustainable green city management
3. Establishing and Simulating Dynamic Models
Relating to the Availability of a Green Open
Space by Taking into Account the Physical,
Social, and Economic Factors
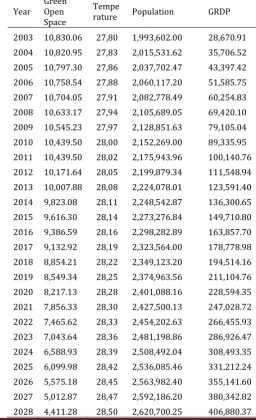
The basic concept for the model developed in this research is a dynamic model which is comprised of three sub main systems, namely (1) Biophysical, (2) Social and (3) Economic. Simulation was undertaken for these three sub systems in accordance with a predetermined scenario. The biophysical components are comprised of swamp forests, mixed forests, paddy fields, dry land, and open land significantly determine increases in the area of green open spaces in Medan City. Results of the simulation for the sub-model of green open space areas in Medan City, the beginning of the simulation year (in 2003) was equal to 10,830.06 Ha, a decline at the end of the simulation year (in 2028) into 4,411.28 Ha. Likewise, the same trend also applies for the temperature in Medan City, the beginning of the simulation year (in 2003) reached 27.8°C, at the end of the simulation year (in 2028) the temperature will have increased to 35.65°C. Results of the simulation in terms of the social sub-model (population) indicate an increasing
trend of the population number in Medan City, which at the beginning of the simulation year (in 2003) was equal to 1,993.602 inhabitants while at the end of the simulation year (in 2028) the population number increases into 2,605.558 inhabitants. Land for settlements in Medan City, at the beginning of the simulation year (in 2003), land for settlements reached 14,134.58 Ha and at the end of the simulation year (in 2028), it increases to 17,196.88 Ha. (Table 1).
Based on the results of the simulation of the GRDP sub-model, indicate an increasing trend in the amoun in which at the beginning of the simulation year (in 2003) amounted to IDR 28,670.91 billion and at the end of 2023 until the end of the simulation year, it increasing to IDR 406,880.37 billion.
Table 1. The Existing Simulation Results for the Dynamic System Model of Green Open Spaces, Total Population and Total GRDP Years 2003-2028
Year Green Open Space
Tempe
rature Population GRDP
2003 10,830.06 27,80 1,993,602.00 28,670.91
2004 10,820.95 27,83 2,015,531.62 35,706.52
2005 10,797.30 27,86 2,037,702.47 43,397.42
2006 10,758.54 27,88 2,060,117.20 51,585.75
2007 10,704.05 27,91 2,082,778.49 60,254.83
2008 10,633.17 27,94 2,105,689.05 69,420.10
2009 10,545.23 27,97 2,128,851.63 79,105.04
2010 10,439.50 28,00 2,152,269.00 89,335.95
2011 10,439.50 28,02 2,175,943.96 100,140.76
2012 10,171.64 28,05 2,199,879.34 111,548.94
2013 10,007.88 28,08 2,224,078.01 123,591.40
2014 9,823.08 28,11 2,248,542.87 136,300.65
2015 9,616.30 28,14 2,273,276.84 149,710.80
2016 9,386.59 28,16 2,298,282.89 163,857.70
2017 9,132.92 28,19 2,323,564.00 178,778.98
2018 8,854.21 28,22 2,349,123.20 194,514.16
2019 8,549.34 28,25 2,374,963.56 211,104.76
2020 8,217.13 28,28 2,401,088.16 228,594.35
2021 7,856.33 28,30 2,427,500.13 247,028.72
2022 7,465.62 28,33 2,454,202.63 266,455.93
2023 7,043.64 28,36 2,481,198.86 286,926.47
2024 6,588.93 28,39 2,508,492.04 308,493.35
2025 6,099.98 28,42 2,536,085.46 331,212.24
2026 5,575.18 28,45 2,563,982.40 355,141.60
2027 5,012.87 28,47 2,592,186.20 380,342.82
[image:2.595.300.557.342.763.2]© 2015, IRJET ISO 9001:2008 Certified Journal
Page 35
Directions in terms of the allocation of green open spaceareas directed towards establishment of a green city in Medan City have already required improvement with fundamental management related to the biophysical sub-model, the social sub-model and the economic sub-model. Based on the test results and the verification in terms of the simulation and historical proximity, then strategic policy can be used in the next step as one of the standards for the model of green open space management towards the establishment of a green city in Medan City.
4. Formulation of the Directions for the Strategy
of Green City Development Policies in Medan
City
Green cities are defined as an eco-friendly city which effectively and efficiently utilizes water resources and energy, reduces waste, implements an integrated transportation system, ensures environmental health, synergizes between the natural environment and the artificial environment, based on the urban planning and design consistent with the principles of sustainable development.
Green city development in Medan City requires joint efforts from all the stakeholders. It also requires both fundamental (from practices until values) and massive changes/ innovations/ initiatives. The Law No. 26 of 2007 concerning spatial planning expressly specifies that 30% of the total area of a city shall be designated for a green open space, which is comprised of a public green open space by 20% and a private green open space by 10%. This green open space allocation by 30% is set forth in the Regional Regulation concerning the Regional Spatial Planning at the City and Regency Levels.[8].
To formulate the master plan of a green open space in Medan City, it is necessary to have a priority scale to indicate the program of green open space provision in Medan City. This should be based on the condition of public green open space requirements which are still insufficient and by predicting the very high developmental pressure, then it is necessary to carry out anticipatory management in order that the need for a green open space can be met and utilized properly. There are 2 (two) strategies to establish Medan City into a green city, namely:
4.1. The Population Policy Strategy :
The current population in Medan City are not evenly-distributed and generally concentrated in downtown areas such as Medan Kota District, Medan Perjuangan District, Medan Maimun District, Medan Area District and Medan Tembung District. In line with the trend of physical development of the city, currently the development of the
settlement begins to move to the South. Such a phenomenon where the settlement begins to move to the South should be controlled given the region is a conservation area. Therefore, in the near future it should be directed to the North, such as in Medan Marelan District and Medan Labuhan District.
Some considerations to determine the directions of the population distribution are:
a. The population growth in several periods indicates an
increasing trend. In 1980 to 1990, the population growth increased by 1.5% per year on average while in 1990 to 2000, the population growth increased by 1.8% per year, and in 2003 to 2013, the population growth reached 2% per year. Population growth control is carried out by restricting the number of births (birth control) and migration. Birth control is undertaken by intensifying the family planning program while restrictions on migration are implemented by controllling the economic activity and making a plan for the allocation of facilities.
b. The availability of land for developmental purposes for
the population in each district varies, in districts located in the downtown area, it is estimated that the number of the population will not increase as this area has been quite densely populated and there is no vacant land for development and even there is a tendency that the residential areas change their function into commercial areas.
c. The existence of growth centers such as secondary
centers to be developed is among the factors causing the development of residential areas to move the region. Medan Marelan District and Medan Amplas District are areas with the highest level of population growth. In there areas, many new housing complexes are built.
d. The plan to build new development centers for
economic and commercial activities will lead to the development of such residential areas, such as the primary center in the North (Medan Labuhan District and Medan Marelan District).
Based on the above considerations and the conditions of each district, then the directions for the development and the strategies for the distribution of the population in Medan City are elaborated as follows:
1. To control population growth in the downtown area
© 2015, IRJET ISO 9001:2008 Certified Journal
Page 36
new houses in certain areas or increasing taxes for landand buildings; and
2. To direct population distribution to areas outside the downtown areas, namely areas whose levels of population density and land use are still relatively low such as:
- southern areas: Medan Johor District, Medan
Tuntungan District, Deli Tua District and Pancur Batu District (Deli Serdang Regency);
- western areas: Medan Sunggal District and Sunggal District (Deli Serdang)
- Medan Tembung District, Percut Sei Tuan District and
Tembung District (Deli Serdang).
The appropriate strategies to cope with the population growth rate in Medan City are:
1. to create an adequate economic balance between
the outskirts and the downtown area;
2. to reduce the rate of population growth through poverty alleviation programs in the outskirts; and 3. to provide basic infrastructure/ facilities (streets,
utility networks and social facilities as well as public facilities) in each district in Deli Serdang Regency.
4.2. The Strategy in the Form of the Public Green
Open Space Policy
Strategies to meet the needs of public green open spaces by 5,217.7 Ha (19.68%) are undertaken by increasing the quantity and quality of the following green open spaces to be developed in Medan City:
1. Green Open Spaces in the Form of City Parks
Green open spaces in the form of city parks are parks intended to serve the inhabitants of a city or an area of the city. These parks serve a minimum of 480,000 inhabitants with a minimum standard of 0.3 m2 per city inhabitant,
with an area of a park by at least 144,000 m2. These parks
may be in the form of a green open space (a green field), equipped with recreational and sports facilities, and a sports area with a green open space by at least 80 to 90%.
City parks in Medan City are built in areas with a green open space of less than 30 percent, such as Medan Amplas District, Medan Area District, Medan Barat District, Medan Baru District, Medan Deli District, Medan Denai District, Medan Helvetia District, Medan Johor District, Medan Kota District, Medan Maiumun District, Medan Perjuangan District, Medan Petisah District, Medan Polonia District, Medan Sunggal District, Medan Tembung District, and Medan Timur District.
2. Green Open Spaces in the Form of City Forests
Currently, Medan has 7 (seven) green open spaces in the form of city forests, namely in Medan Baru District, Medan Johor District, Medan Polonia District, Medan Tuntungan District and Medan Labuhan District. The details are presented in Table 2 below.
Table 2. Distribution of City Forests in Medan City
No. Name of the City Forest Location District
1. Banyan Forest Medan Baru
2. The Scout Campground
“Cadika” Medan Johor
3. City Forest “CBD
Polonia” Medan Polonia
4. Zoo Medan Tuntungan
5. Deli River Channel Medan Johor
6. City Forest Medan Labuhan
7. City Forest Medan Tuntungan
Source: The Regional Development Planning Agency (Bappeda) of Medan City Year 2008
The low proportion of city forests in Medan City compared with its total area implies the need to increase the areas of city forests in order to improve the microclimate and the aesthetic value of the city. City forests in Medan City should be built in areas with green open spaces which fall into the high category (greater than 30 percent), such as in Medan Belawan District, Medan Marelan District, Medan Selayang District, Medan Tuntungan District, and Medan Labuhan District.
Green open spaces are among the fundamental building blocks of an urban space or an urban area which
play an important role in supporting (biofiltering),
controlling (biocontrolling) and repairing (bioengineering) quality of the environment of an urban area [9]. The existence of the urban conditions with all the challenges has to be able to remain ensuring that both the protected area and the cultivated area are in a balanced proportion. Therefore, green open urban spaces are deemed as part of the functional space which can improve the physical and non-physical quality of the city face.
© 2015, IRJET ISO 9001:2008 Certified Journal
Page 37
Sustainable green city is a city built by continuouslyfostering all the assets including the people, the built environment, the natural resources, the environment and the quality of urban infrastructure. Such a city also adapts to and mitigates the climate change. Green City Development also refers to the development of urban people which have the initiative and cooperate to strive for changes and joint movement. Green City Development in Indonesia requires joint efforts from all the stakeholders. It also requires both fundamental (from practices until values) and massive changes/ innovations/ initiatives. As part of the efforts to establish a green city, it is necessary to plan and design an environmentally friendly city intended for the general public, with an emphasis on the quality, the social and cultural activities as well as the green space therein.
The green city development program which has been initiated by the Ministry of Public Works c.q. the Directorate General of Spatial Planning is one of the concrete step of the central government along with the provincial government and the city/municipality government to meet the provisions specified in the Act on spatial planning, particularly related to the fulfillment of green open spaces in urban areas as well as to address the challenges arising from the climate changes in Indonesia. The green city development program is an innovation of the program to establish urban green open spaces [10].
5. CONCLUSIONS
In the dynamic analysis model, there is a relationship among the biophysical, social, and economic components. The simulation results suggest that a decline occurs in the area of green open spaces throughout the simulation year period, i.e. from 10,830.06 Ha (2003) to 4,411.28 Ha (2028); the total population during the simulation year period which formerly was equal to 1,993,602 inhabitants (2003) will have increased to 2,620,700 inhabitants
(2028); while the temperature from 27.80oC (2003)
increases to 28,50oC (2028); and finally, GDRB during the
simulation year period which formerly was equal to IDR 28,670.91 billion (2003) increases to IDR 406,880.37 billion (2028). (2). There are two strategies for green city development in Medan City, namely: 1. The population policy strategy by means of controlling population growth in the downtown area as well as directing the population growth toward the area outside the downtown, namely towards the districts whose population density is relatively still very low. 2. The policy strategy in the form of green open spaces for the public, which is undertaken by improving the quantity and quality of green open spaces for city parks and city forests.
REFERENCES
[1] Pane, E. 2011. Analisis Struktur Ruang Dalam
Pengembangan Infrastruktur Hijau Di Kota Medan.
Thesis. Sekolah Pascasarjana USU Medan
[2] Purba, C. 2010. Analisis Spasial Hubungan
Penggunaan Lahan dengan Suhu Udara di Kota Medan. Thesis. Sekolah Pascasarjana USU Medan
[3] Briassoulis, H. 1999. Analysis of Land Use Change:
Theoretical and Modelling Approaches.
http://www.rri.wvu.edu/web.Book/Briassoulis/ contens.htm[10 April 2009].
[4] Suwarli, 2011. Land use change dynamics and
Green Open Space (GOS) Allocation strategy based on environmentally soud regional budgeting (a case study of Bekasi City). Dissertation. Postgraduate, Bagor Agricultural University.
[5] Graham, S. & Marvin, S. (2001), Splintering
Urbanism: Networked Infrastructures,
Technological Mobilities and the Urban Condition, London: Routledge.
[6] Veron, J. (2006), L’urbanisation du Monde,
Collection reperès, Paris: la Découverte.
[7] Budimanta, 2005. Memberlanjutkan Pembangunan
di Perkotaan melalui Pembangunan Berkelanjutan
dalam Bunga Rampai Pembangunan Kota
Indonesia dalam Abad 21. Lembaga Penerbit FEUI
[8] Badan Perencanaan Pembangunan Daerah Kota
Medan, 2008. Laporan Akhir/Buku Rencana.
Pekerjaan Penyusunan Penyempurnaan Rencana Tata Ruang Wilayah (RTRW) Kota Medan Tahun 2008-2028
[9] Nurisyah S. 1997. Manfaat dan Perencanaan
Ruang Terbuka Hijau Kawasan Perkotaan. Jakarta: Makalah Lokakarya Upaya Pengembangan dan Pembinaan Ruang Terbuka Hijau Perkotaan di Masa Datang.
[10] Directorate General of Spatial Planning and Development, Ministry of Public Works (2011),
The Green City Development Program, Jakarta: Directorate General of Spatial Planning and
Development, Ministry of Public Works.
© 2015, IRJET ISO 9001:2008 Certified Journal
Page 38
BIOGRAPHIES
Darwin Parlaungan Lubis Graduate school, University of
Sumatera Utara, Medan, Indonesia
Prof.Dr.Alvi Syahrin, SH, MS Department Criminal, Faculty of Law ,University of SumateraUtara,
Medan, Indonesia
Dr. Budi Utumo, SP, MP Senior Lecturer , Department Forestry , Faculty of Agriculture,
University of Sumatera Utara, Medan, Indonesia
Dr. Delvia, SP, MP Senior Lecturer , Department Forestry , Faculty of Agriculture,