© 2016, IRJET ISO 9001:2008 Certified Journal Page 975
An improvised algorithm for automatic shot segmentation and
summarization
Jay A. Patel
1, Viral B. Thakar
21
Student, E.C. Department, Atmiya Institute of Technology and Science, Rajkot-Gujarat, India
2
Professor, E.C. Department, Atmiya Institute of Technology and Science, Rajkot-Gujarat, India
---***---Abstract -
The video shot boundary detection (SBD) is a region, where many practices and techniques have been suggested and have requested to perform consistently on the videos like talk shows , different sports events & news telecast. Large videos like movies have a large amount of visual material changing in random manner; it needs a highly dynamic technique for automatic shot boundary detection. The key goal of this research is to develop an adaptive & strong algorithm for segmentation & classification of movie videos. In this paper, we described a novel tactic for SBD. which is totally adaptive & changes the threshold value as per the information variation. We have definite the new feature which can uniquely define color as well as edge & frequency details of a frame. It is able to detect not only abrupt transitions like hard cuts but also special effects like wipes, fades, and dissolves as well in different videos like movies.Key Words: Shot boundary detection(SBD), Sudden
changeover, Special effects, Single feature, Adaptive approach
.
1. INTRODUCTION
This The evolution in growing the amount of the multimedia data is all because of the enhancements in data gaining, data storage, and various communication technologies, maintained by enhancements in processing of audio as well as video signals. Now a days the rising use of multimedia streams demands the expansion of more efficient and effective algorithm for handling and admittance of the databases which are having that audio and video information. Today, a typical end-user of a multimedia system is usually perturbed with collections of video data, facing the problem of organizing data so that they are easily available. As per the statistics given by CISCO in [6], it will take more time around 6 million years to watch the large amount of video data that will cross the worldwide IP networks in 2016. By the use of such spacious multimedia data resources, we can develop new tangible and efficient video database systems. Which are highly demanded to enable efficient searching, browsing and retrieval. In spite of, the previous and old video indexing methods, which are totally dependent on human interface, are take a long time, absence the speed of automation and are deviate by so much human intimacy. Therefore, more progressive methods are needed to support automatic indexing and retrieval directly based on video content, which provide efficient search with pleasing responses to the scenes and objects that the user
seeks [12]. In this paper is systematized following sections. 2: the brief idea about the literature review. Section-3: projected algorithm is clarified and discussed. Section-4: performance analysis & results. Section-5: conclusion part.
2. LITERATURE REVIEW
From the study of the various materials we can say that there are mainly two types of evolution in any video sequence, regarding the automatic video segmentation: Abrupt & Gradual. In the abrupt transition CUT transition are includes, while in gradual transition fades are includes and wipe & dissolve kind of special effects.
An abrupt transition defines a extreme rise or rapid change in the current frame compare to the previous frame. Mostly researcher concluded that the cut transition as one single task but we would like to describe it in two various types of cuts: Strong Cuts & Weak Cuts. Where strong cuts are the cuts which are similar to the conventional type of cuts used for SBD. In other hand weak cuts are the cuts which are used for SBD and also used to recognize that whether consecutive shots are part of same scene or not. So that Weak cuts are having more importance and they also represent that the consecutive shots are generated by changing position of the camera. Figure-1and 3 shows the same example of these types of effects.
Now the other type of transition called gradual transition is also called as Special Effects because the different Linear & Nonlinear combination of the consecutive frames of two different shots generates the same. Mostly movie videos include following types of Special effects: wipe, fade and dissolves. Figure-6 and 9 shows the example of these types of effects.
FADE effect: it can be recognized by a gradual transition between a shot and constant image or vice versa. Mostly in all the cases the pure black image is used as a constant image. To identify the shot boundary we have to detect that constant or monotone image.
© 2016, IRJET ISO 9001:2008 Certified Journal Page 976 When we analyze the literature for the recent bias for video
SBD some generally used methods shows up like edge detection, motion vector difference, color histogram, standard deviation based approach etc.
In [8] & [9], they brief about used χ2 histogram and color histogram based approach for CUT detection which shows decent results. But in other side of it, this approach for gradual transition is not that much effective for dissolves. In [10], they brief about used similarity analyses which again perform efficiently for cut detection. But in other side of it, this approach for gradual transitions are not that much impressive.
In [11], they brief about used a single new feature for SBD. This single feature reduces the threshold parameters and also reduces the total calculation time. We have tried to develop such type of algorithm by using most regularly used features.
In [5] & [7], they have mentioned various features for the video SBD. We have used these documents to understand the advantages & disadvantages of various features.
So by reviewing the work done in [2, 5, 7, 8-10, 11], we conclude that all the recent well-known methods are pretty good efficient for cut detection but in other side their response towards gradual transition is not that much impressive. Also the other methods which shows higher performance index are found bungling for large visual information and their random variations like movie videos. We also analyze that most of the algorithms developed for Automatic SBD are not adaptive and also giving more efficient outputs for only some specific video inputs.
For the upgrading of the SBD we have come with an adaptive process which extract the various features of an image and using them calculate a single feature which can specially define the image. By comparing the values of it for consecutive images we can discriminate the cuts, fades and dissolves.
3. PROPOSED ALGORITHM
To inspect and recognize the appropriateness of various types of shot detection algorithms with regard to the detection of hard cuts and special effects like fades, dissolves and wipes at least any one characteristic of each main approach was executed and verified on a large diversity of sequences. Based on these tentative results several SBD approaches were selected to be mutual.
Various approaches have considered various features like histogram, χ2 histogram, color histogram to examine the color based feature of image. The key downside of it is not effective for the dissolves and fades. DCT method has also been consider as a single feature to consider the change in frequency domain but it also not that much efficient. So we
have considered all this separate features to generate a single feature which comprises all the information about image like its frequency, color and texture domain transformation.
3.1 CUT Detection Method
As mentioned in previous section a CUT is considered as an sudden change in the frame sequence. We have measured the following separate features for each frame to identify the Strong or Hard Cuts and Weak Cuts.
Discrete Cosine Transform Method:
The DCT represents an image as a summation of sinusoids of varying frequencies and magnitudes. In our method the standardize frame is converted into gray color space, it is similarly separated into non-overlapped 8 x 8 blocks. The DCT works on an X block of N x N image examples and creates Y, which is an N x N block of coefficients. The exploit of the DCT can be defined in terms of a transform matrix A. The forward DCT is specified by Y = AXAT, where X = a matrix of samples, Y= a matrix of coefficients, and A = an N x N transform matrix. The elements of A are
(1)
i = 0
Where Ci =
i> 0
So the DCT can be written as
(2)
HSV Histogram Method:
First of all a histogram is a one type of function that computes the number of observations or explanations that drop into all of the separate categories known as bins. Thus, if we take n be the total number of explanations and k be the total number of bins, the histogram mi sees by given following conditions
(3)
© 2016, IRJET ISO 9001:2008 Certified Journal Page 977 (4)
Edge Change Ratio (ECR) Method: The ECR is clear as follow. Let’s take σn= the number of edge pixels in frame n, Xnin = the number of entering pixels in the frame and Xn-1out = the number of exiting pixels in the frame, now calculating equation (5) will give the value of ECR in between 0 and 1.
(5)
Separately from these both main features we have also measured grey image correlation as two supporting features and grey level histogram for our algorithm. This separate features is not so much effective so we do the combination of them to describe our new difference index which outperformed all other methods.
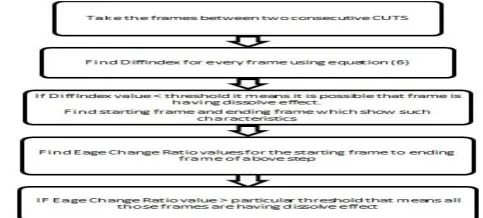
Now the difference index of two consecutive frames is calculated as
(6)
Where DCTcorr, Histogramcorr and Greycorr are the correlations for two successive frames. Figure 2 and 4 displays the some examples of strong/hard cuts & weak cuts detected through above demonstrated approach.
The adaptive threshold for the above mentioned difference index is calculated using the following method.
All the frames are dividing in fix size of group. (Windowing Or Clustering technique).
Calculate Standard & mean deviation of the DiffIndex for every group.
By the use of equation (7) we can calculate the threshold value for CUT detection.
(7)
Where a = integer constant.
If for a specific frame DiffIndex is larger than threshold announce it as CUT.
By separating the total frames into different groups of frames we are reducing the quantity of false positives compare to calculating a global threshold for entire video. This clustering based adaptive approach shows very hopeful results for the CUT detection method.
3.2 Fade Detection Method
For detecting the fade in or fade out effect we have to using the Entropy as a feature. As clarified in the previous section fade is generated or fade ends in a monotone image. Now entropy is define by the statistical measure of randomness of the image. Entropy is represent by following equation.
(8)
Where p = histogram count.
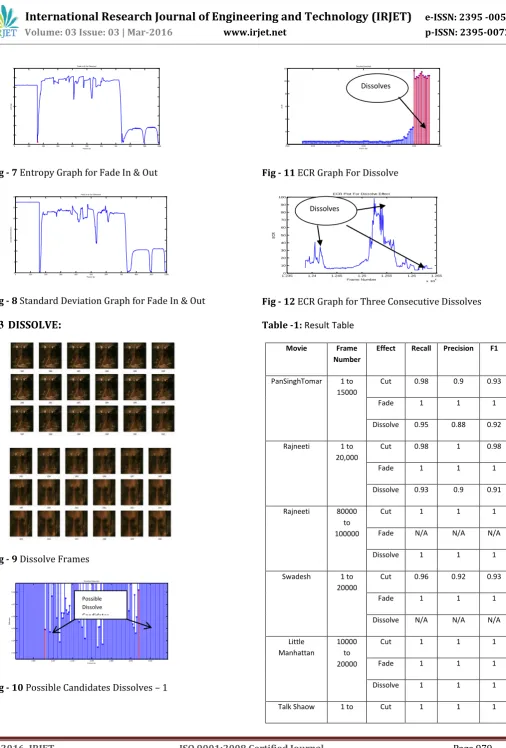
The entropy value of a monotone image very near to zero. So by using entropy equation we can easily identify the shot boundary for the fade in or fade out very simply and efficiently. Figure 7 display the graph of Entropy for the fade in and fade out effects for the same video sequence. We have also calculated the standard deviation of each frame. By combination of these two results of standard deviation and entropy we can precisely find the monotone frame which performance as a main parameter for fade in or fade out detection technique. Figure 8 displays the standard deviation graph for the same frames which we have considered for entropy.
We have used the same approach defined earlier to calculate the adaptive threshold value for fade detection.
3.3 Dissolve Detection Method
As we defined previous dissolves are generated by linear combination of two dissimilar shots. It is observed that for the efficiency of SBD algorithm the detection of dissolve shots is very difficult. We have observed that dissolve is combination of fade in and fade out effects, in which one shot is fade in while other is fade in at the same time. So we have to using the same Entropy of image as single feature to detect the gradual transition of frames.
Another main quality of it is that during dissolve type of transition the superiority of frames is slowly decreasing relate to the last frame until the next shot is completely mastered the last one. So the frames which are affected by the dissolve effects contain two different images overlapping on each other. To identify this overlapped area we have organized following algorithm.
[image:3.595.309.551.477.586.2]The Figure 9 displays the example frames of dissolve effect. Figure 10 displays the graph of correlation for all the frames between two successive cuts for above example. It also displays the start point and end point of the dissolve section. Figure 11 displays the graph of ECR for those frames, which obviously displays the dissolve effect. The main benefit of this method is it can very efficiently find the number of successive dissolves also. Figure 12 shows the result for single unusual case of three dissolves effect of movie Rajneeti.avi.
4. RESULTS
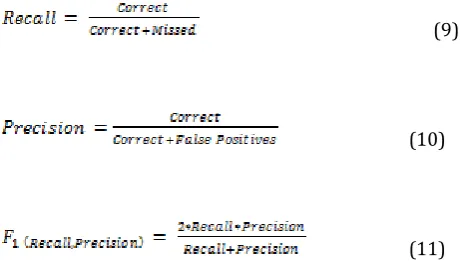
© 2016, IRJET ISO 9001:2008 Certified Journal Page 978 percentage of desired items that are retrieved is called as
Recall. And getting the percentage of retrieved items that are desired items is called as Precision.
(9)
(10)
(11)
The projected algorithm for video SBS is assessed on various movie videos which have variation in size and nature, like video of a talk show and on an animated video. In the table we can shows the values of recall, precision and F1 for every video input.
4.1.
CUT DETECTION:
A) Strong Cuts::
4155.jpg 4156.jpg 4536.jpg 4537.jpg
[image:4.595.310.475.90.349.2]5406.jpg 5407.jpg 5995.jpg 5996.jpg
Fig - 1 Strong or Hard Cuts.
0 1000 2000 3000 4000 5000 6000 7000 8000 9000 10000 0
5 10 15
Frame No
D
if
fIn
de
x
Graph Of DiffIndex For PanSingh Tomar
X: 5.98e+003 to 6.03e+003 Y: 3.23 to 3.43
Fig - 2 Difference Index for Strong Cuts
B) WEAK CUTS:
5069.jpg 5070.jpg 5279.jpg 5280.jpg
[image:4.595.35.269.150.283.2]5334.jpg 5335.jpg 5574.jpg 5575.jpg
Fig - 3 Weak Cuts
4500 5000 5500 6000 6500
0 0.5 1 1.5 2 2.5 3 3.5
Frame No
D
if
fI
nd
ex
Graph Of DiffIndex For PanSingh Tomar
Fig - 4 Difference Index for Weak Cuts
0 10 20 30 40 50 60
0 1000 2000 3000 4000 5000 6000 7000 8000 9000 10000
CUT No
F
ra
m
e
N
o
Total Cuts Detected
Fig - 5 Total Cuts Detected
4.2
FADE IN & OUT:
Fig - 6 Fade In & Fade Out
STRONGCUTS
[image:4.595.331.483.529.733.2]© 2016, IRJET ISO 9001:2008 Certified Journal Page 979
0 100 200 300 400 500 600 700 800 900 1000 0
1 2 3 4 5 6 7
8 Fade In & Out Detected
Frame No
en
tro
py
Fig - 7 Entropy Graph for Fade In & Out
0 100 200 300 400 500 600 700 800 900 1000 0
2 4 6 8 10 12
14 Fade In & Out Detected
Frame No
s
ta
n
da
rd
D
ev
ia
ti
[image:5.595.46.553.39.788.2]on
Fig - 8 Standard Deviation Graph for Fade In & Out
4.3
DISSOLVE
:
Fig - 9 Dissolve Frames
2100 2120 2140 2160 2180 2200 2220 0.23
0.24 0.25 0.26 0.27 0.28
Frame No
D
iffI
n
de
x
Dissolve Detection
Fig - 10 Possible Candidates Dissolves – 1
21000 2120 2140 2160 2180 2200 2220
20 40 60 80 100 120
Frame No
E
CR
Dissolve Detected
Fig - 11 ECR Graph For Dissolve
1.235 1.24 1.245 1.25 1.255 1.26 1.265 x 10⁴ 0
10 20 30 40 50 60 70 80 90 100
Frame Number
EC
R
[image:5.595.316.556.377.776.2]ECR Plot For Dissolve Effect
[image:5.595.53.221.382.581.2]Fig - 12 ECR Graph for Three Consecutive Dissolves
Table -1: ResultTable
Movie Frame Number
Effect Recall Precision F1
PanSinghTomar 1 to
15000
Cut 0.98 0.9 0.93
Fade 1 1 1
Dissolve 0.95 0.88 0.92
Rajneeti 1 to
20,000
Cut 0.98 1 0.98
Fade 1 1 1
Dissolve 0.93 0.9 0.91
Rajneeti 80000
to 100000
Cut 1 1 1
Fade N/A N/A N/A
Dissolve 1 1 1
Swadesh 1 to
20000
Cut 0.96 0.92 0.93
Fade 1 1 1
Dissolve N/A N/A N/A
Little Manhattan
10000 to 20000
Cut 1 1 1
Fade 1 1 1
Dissolve 1 1 1
Talk Shaow 1 to Cut 1 1 1
Dissolves
Dissolves
© 2016, IRJET ISO 9001:2008 Certified Journal Page 980
10000 Fade 1 1 1
Dissolve 1 1 1
Tom & Jerry 1 to 7257
Cut 1 0.94 0.96
Fade 1 1 1
Dissolve 0.9 0.92 0.905
Medonna_4 Mins
1 to 7000
Cut 1 1 1
Fade 1 1 1
Dissolve N/A N/A N/A
Cricket Match 1 to 20000
Cut 1 1 1
Fade 1 1 1
Dissolve 0.8 0.73 0.76
5.
CONCLUSIONS
In this paper we have introduced a unique feature based adaptive approach for the video SBD. We have defined a single unique feature for strong or hard cut and weak cut finding by which we can increase the computation speed and the effective detection of dissimilar types of cuts. In adaptive manner the fade in & fade out effects are noticed by the entropy and standard deviation of frames. The introduced method for the dissolve finding displays very improved results. New results of various types and size of videos display that the introduced approach gives very proper study and finding of video shot boundary.
REFERENCES
[1] A. Hanjalic, Shot-boundary detection: unraveled and
resolved?, Circuits and Systems for Video Technology, IEEE Transactions on 12 (2) (2002) 90–105.
[2] A novel shot boundary detection framework
Wujieheng∗ Jinhui Yuan, Huiyi Wang, Fuzong Lin and Bo
Zhang.
[3] Costas Cotsaces “Video Shot Boundary Detection and
Condensed Representation: A Review” Student Member, IEEE, Nikos Nikolaidis, Member, IEEE,andIoannis Pitas, Senior Member, IEEE.
[4] Comparison of Automatic Shot Boundary Detection
Algorithms by Rainer Lienhart1, Microcomputer Research Labs, Intel Corporation, Santa Clara, CA 95052-8819 [email protected]
[5] Advanced and Adaptive Shot Boundary Detection A.
Miene, A. Dammeyer, Th. Hermes, and O. Herzog
[6] http://www.cisco.com/en/US/solutions/collateral/ns3
41/ns525/ns537/ns705/ns827/white_paper_c11-481360_ns827_Networking_Solutions_White_Paper.html.
[7] Comparison of video shot boundary detection
techniques John S. Boreczky Lawrence A. Rowe
[8] Analysis and Verification of Shot Boundary Detection in
Video using Block Based χ2 Histogram Method
by 1Naimish.Thakar, 2Prof.P.I.Panchal, 3Upesh Patel, 4Ketan Chaudhari, 5Santosh.Sangada in International Journal of Advances in Electronics Engineering
[9] HYBRID APPROACH FOR SHOT BOUNDARY DETECTION
FROM UNCOMPRESSED VIDEO STREAM 1Ketan Chaudhari, 2Santosh Sangada, 3Upesh Patel, 4Prof.J.P. Chaudhari, 5Prof.P.I.Panchal in International Journal of Advances in Electronics Engineering
[10] Shot boundary detection via similarity analysis by
Matthew Cooper∗ Jonathan Foote, John Adcock, and
SandeepCasi FX Palo Alto Laboratory Palo Alto, CA USA http://www.fxpal.com
[11] SVM-based shot boundary detection with a novel
feature by kazunorimatsumotomasakinaitokddir&d laboratories, inc. 2-1-15 ohara, fujimino-shi, saitama
356-8502, japan {matsu, hoashi, naito,
fsugaya}@kddilabs.jpkeiichirohoashifumiakisugaya
[12] Seung-Hoon Han, Kuk-Jin Yoon, and In So Kweon,
2000. ”A new technique for shot detection and key frames selection in histogram space.”12th Workshop on Image Processing and Image Understanding, pp 475-479
BIOGRAPHIES
Mr. Jay A. Patel has completed
his graduation with
specialization in Electronics & Communication form the
esteemed Gujarat
Technological University,
Rajkot. He is pursuing his post-graduation from the Gujarat Technological University in the field of Communication System
Engineering. His current
research focuses on the field of Image and Video Retrieval & Wireless Sensor Networks.
Mr. Viral B. Thakar has completed his graduation with specialization in Electronics &Communication form the
esteemed Saurashtar
University, Rajkot. He has pursued his postgraduation from the Charotar University of Science & Technology, Changa in the field of
Communication System
Engineering. His current