© 2016, IRJET | Impact Factor value: 4.45 | ISO 9001:2008 Certified Journal
| Page 2355
DETERMINATION OF BLAST LOAD PARAMETERS FOR A MULTI STOREY
STRUCTURE
E.HANUMAIAH 1, K.PRAFULLA DEVI2
1. PG Student (Structural engineering), Gudlavalleru Engineering college, Gudlavalleru, A.P, India.
2. Asst.professor (Structural engineering), Gudlavalleru Engineering college, Gudlavalleru, A.P, India.
ABSTRACT
Blast resistant analysis explores non linear Two Dimensional dynamic responses of tall building (G+10) storey. Tall reinforced concrete structural buildings have been designed for normal loads like dead, live, and wind. As all of us are aware that in today’s world terrorist's attacks are common and not a single country is completely safe. High-Explosive detonations propagate blast energy in all directions, causing extensive damage to both the target structure and nearby buildings. These blast loads are of high intensity and these loads acts on the structure for short durations. Hence blast loading is nothing but impulsive loading. These loads are analyzed by TM-5 1300. In there comes the major challenge for civil engineers to design the structure for blast loads. In the Impact from the blast loads damages the target structure as well as the surrounding structures. Hence the structure should be designed for the blast loads along with normal loads, so that can be resist shock waves due to blast (impact) loading. The blasting energy releases high intensity pressure waves which are called as incident pressure waves. Then the incident waves affect the surrounding structures along with target structure. Those waves touches the structure and rebounds to the source after which they gets combined with the incident waves forming high intensity waves called reflected pressure waves. With that the reflected pressure waves a mach front is formed with the summation of the both incident pressure as well as reflected pressure. The dynamic blast loads are needed to be carefully calculated just like wind loads and earthquake loads. In this paper the blast load parameters are calculated for 2-D G+10 structural frame which is done manually. Columns are key load bearing elements in the frame structure.
Key Words:Blasting, tall structure, Dplot, TM-5 1300, terrorist activities.
1.
INTRODUCTION
© 2016, IRJET | Impact Factor value: 4.45 | ISO 9001:2008 Certified Journal
| Page 2356
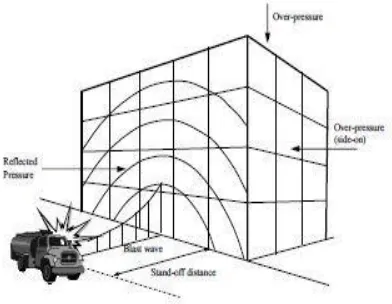
[image:2.612.209.405.258.410.2]structure is designed for abnormal loads (charge weights). In air burst blast wave propagation is in spherical shape, but as we have considered the surface burst where the wave propagation is in hemispherical shape, explosion materials will propagate waves in different directions. In the present work TM-5 1300 code and the analysing tool Dplot graphs are used. Figure 1 shows that reflected pressures, and incident pressures, and arrival time which is obtained from incident waves. Pressure intensities depend on the bomb sizes or charge weights and also with standoff distance between blast source and impacted (2D frame) structure (target). The main aim of this paper is to understand how the pressure varies from floor to floor with the help of Dplot application for the 2D G+10 structural building with positive front face of the structure (nothing but target)
Figure 1: Blast loading on structure
A.
Methodology:
Determination of the blast wave parameters
Determining the blast wave parameters we can study about the surface burst. The loads due to Explosion are huge applied in different directions for small durations. Utmost damage is occurred when charge weight (bomb weight) is more. Explosive materials (bomb) release shockwaves in different directions. These waves are reflected pressure waves, which travels through surface, touches the building then the waves are distributed to the entire building. All thes pressure waves are merged with the incident wave at the point of detonation to form a single wave; these waves are in hemispherical shape.
B.
Procedure for field wave blast parameters of a surface burst:
Reflected Pressure PrSelect point of interest on the ground relative to the charge. Determine the
Charge weight and ground distance RG.
Apply 20% safety factor to the charge weight.
© 2016, IRJET | Impact Factor value: 4.45 | ISO 9001:2008 Certified Journal
| Page 2357
Determine free field blast wave parameters from figure for corresponding scaled distance ZG.Hear: Peak positive incident pressure Pso
Shock front velocity U
Reflected Pressure Pr
Scaled unit Positive incident impulse is/w1/3
Scaled positive phrase duration to/w1/3
Scaled arrival time tA/w1/3
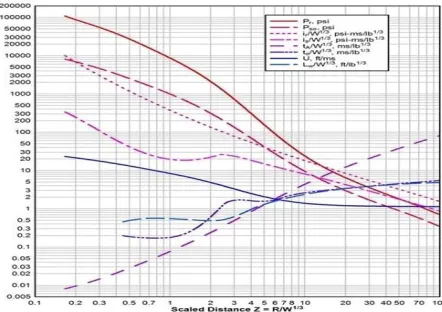
[image:3.612.197.418.385.541.2]Multiply scaled values by W1/3 to obtain absolute values.
Figure 2: positive phase shock wave parameters for hemispherical TNT i.e. surface burst
C. Brief over view of structure
A G+10 storied building consisting of each story height 5m and the total height of thebuilding frame is 50m. The present project is proposed to study the blast wave pressures of the multi-story 2-D building frame using TM-5 1300 plots in UFC (Unified Facilities Criteria). The following structure is considered, for determining the pressures which are induced due to TNT charge weights.
© 2016, IRJET | Impact Factor value: 4.45 | ISO 9001:2008 Certified Journal
| Page 2358
Figure 3: facade of 2D tall structure
D. Analysis results of blast loads
Table 1: blast load parameters for 15m distance charge wt:- 700kg tnt
Floor Scaled Distance (m/Kg1/3) Pr (Kg/m2 ) Pso (Kg/m2 ) tA (ms) ta+to(ms)
G Floor 4.00 209352.00 48848.80 8.78 28.53
1st Floor 4.22 209350.60 44243.06 10.23 29.50
2nd Floor 4.81 209347.11 31891.29 14.11 32.09
3rd Floor 5.66 125605.61 23307.86 18.99 38.00 4th Floor 6.67 62789.54 16259.67 25.26 46.48 5th Floor 7.78 41843.18 11959.16 31.72 56.24
6th Floor 8.95 27847.30 8962.70 42.31 69.64
7th Floor 10.17 17422.27 6202.26 54.40 85.26
8th Floor 11.41 13584.92 5631.15 66.92 98.73
9th Floor 12.66 10935.15 5055.43 79.55 112.32
© 2016, IRJET | Impact Factor value: 4.45 | ISO 9001:2008 Certified Journal
| Page 2359
Table 2: blast load parameters for 15m distance charge wt:- 1500kg tntFloor Scaled Distance (m/Kg1/3) Pr (Kg/m2 ) Pso
(Kg/m2 ) Ta (ms) Ta + To(ms) G Floor 3.10 488487.86 114794.70 7.32 33.43 1st Floor 3.27 488487.51 102338.20 8.02 33.9
2nd Floor 3.73 48848674 68632.56 9.93 35.17 3rd Floor 4.39 209350.04 40684.07 14.28 38.07 4th Floor 5.18 111652.58 26657.49 20.59 43.19 5th Floor 6.04 62804.50 20656.06 26.58 51.56 6th Floor 6.94 62783.73 14375.50 34.05 61.52 7th Floor 7.88 41839.69 11703.06 40.63 71.91 8th Floor 8.85 27854.28 9218.81 52.03 86.16
9th Floor 9.82 20820.75 6740.29 64.97 102.03 10th Floor 10.81 17332.94 5907.49 76.63 116.1
[image:5.612.165.440.443.574.2]E. Velocity of blast wave.
Table 3: Blast wave velocity for 500Kg TNT charge weight
Floor Arrival time (tA)
ms Time of decay
(to) ms
Velocity (U) m/ms
Ground level at 0.0m
8.7816 19.7581 1.0468
Roof level at 50.00m 92.4791 33.7635 0.5531
© 2016, IRJET | Impact Factor value: 4.45 | ISO 9001:2008 Certified Journal
| Page 2360
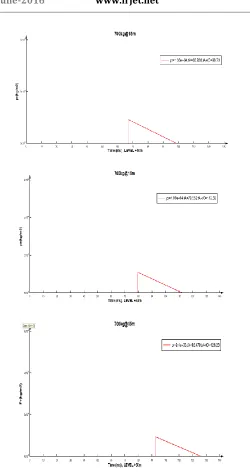
[image:6.612.206.445.110.255.2]F. Graphs for incident pressure
Figure 4: Incident pressure for 700K TNT
[image:6.612.239.412.335.433.2]@15, 30, 45, 60 and 75m distances
Figure 5: Incident pressure for 1500Kg TNT @15, 30, 45, 60 and 75m distance
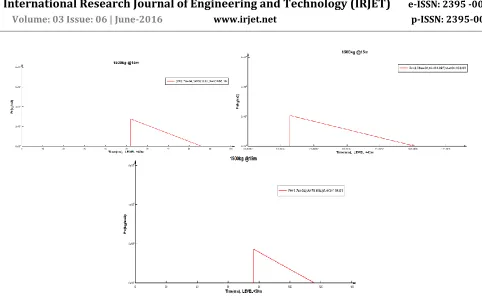
G. Graphs for reflected pressure
[image:6.612.246.403.474.604.2]© 2016, IRJET | Impact Factor value: 4.45 | ISO 9001:2008 Certified Journal
| Page 2361
Figure 7: Reflected pressure for 1500Kg TNT @15, 30, 45, 60 and 75m distancesFor analysis approach 700, 1500, 2500, 3500 and 4500 Kg’s TNT charge weights are considered with the respect to different distances 15m, 30m, 45m, 60m and 75m. The graphs are shown above for 700Kg, 2500Kg TNT @15, 30, 45, 60 and 75 m. As the bomb size increases, then the intensity of pressure (incident and reflected) increases. Maximum incident and reflected pressures are occurred at the ground floor is 48.848×103,2.09×105 for the 700Kg TNT Charge
weight at 15m distance and for 1500Kg TNT charge weights pressures are represented in table from graphs. For further height of the building i.e. 50m (roof level) pressures are decreased. Similarly reflected pressures are the more intensity pressures when compared with the incident pressure waves, because as mentioned earlier when the shock waves touches the structure and rebounds to detonation position they combine with the incident pressures.
H. Graphs for impulsive peak
pressure
© 2016, IRJET | Impact Factor value: 4.45 | ISO 9001:2008 Certified Journal
| Page 2362
© 2016, IRJET | Impact Factor value: 4.45 | ISO 9001:2008 Certified Journal
| Page 2364
© 2016, IRJET | Impact Factor value: 4.45 | ISO 9001:2008 Certified Journal
| Page 2366
© 2016, IRJET | Impact Factor value: 4.45 | ISO 9001:2008 Certified Journal
| Page 2367
Figure 9: Impulse graphs for variations of 1500Kg TNT charge weight @ 15m distance.From results i.e. impulse graphs of 700Kg, 1500Kg TNT Charge weights at 15m distance shown in above at the ground floor peak reflected impulse for 700Kg, 2500Kg @15m distance are 2.09×10⁵, 4.88×10⁵ respectively. When the time of decay is
started peak reflected pressure values are reduced at roof level to 9.44×10³, 1.73×10⁴, hence from these graphs peak impulse
is reduced when time decay is started and reaching the total time duration peak impulsive value may be negligible.
2. Results and discussion
I. The 2-D tall structural frame (G+10) subjected to five charge weights 700, 1500, 2500, 3500 and 4500 Kg TNT. II. The study aimed on external short time blast loads on facade of the structure by using
the TM-5 1300 over the front face of the structure(positive phase 2D frame is considered). III. Reflected pressure Pr, reflective impulse Ir, time of arrival ta and also finding the
positive phase time duration for reflected pressure tr.
IV. In this analysis twenty five combinations of ground distances and charge weights are considered for the determination of the blast Pressures.
V. The TNT charge is in the shape
of hemispherical for all frames of the structure. VI. Above mentioned frame is simulation
for five blast load combinations 15m range 700, 1500, 2500, 3500and 4500Kg TNT Charge weights. VII. Similarly 30m, 45m, 60m, 75m, to
© 2016, IRJET | Impact Factor value: 4.45 | ISO 9001:2008 Certified Journal
| Page 2368
CONCLUSION
[1]. The explosions near to the structure can cause damage surrounding to the buildings.
[2]. Blasting over the facade of tall structural two dimensional frame analysis gives distribution of reflected pressure is in decreasing order with the height of structure.
[3]. Distribution is approximately uniform for shorter ranges, and this assumption is in not valid.
[4]. Because as the structure first collapse locally then distributed to entire structure, the response in the structure is more, in the case of lower ranges.
[5]. The reflected pressure at the top of the structure is observed in the case of 15m range and more in 30, 45, 60 and 75m range for all charge weights 700 to 4500Kg TNT.
[6]. This is due to angle of incidence which is varying at high range as in the case of 15m and 75m respectively.
[7]. For 15 m range, the factor of the reflected pressures and for charge weights 4500 kg TNT to 2500 kg TNT and 2500 kg TNT to 700 kg TNT increased in between third and fifth floors i.e. in between 350 to 600 angle of incident.
[8]. This is due to the peak incident over pressure and angle of incidence.
[9]. If the shock front approaches the structure at the incident angle then the peak reflected pressure will be a function of the peak incident over pressure and the incident angle between the front and the facade of the structure. [10]. Starting at an angle of incidence of approximately 400, TM 5 – 1300,depending on the static condition.
[11]. From the above observation reflected impulsive pressure is more in the case of ground (bottom) floors, low in roof level (top) floors for different charge weights.
[12]. From figure 4, 5, 6 and 7 reflected peak impulse is uniform for different charge weights 700 to 4500Kg TNT. [13]. The time of arrival (tA ) and the sum of time of arrival and time of positive phase time duration of reflected pressure (tA+tO) are in increasing order with increase in range and decrease in charge weight.
[14]. The variation in the above times and (tA, tA+tO) with height is nonlinear at the lower levels and approximately
linear in the upper levels, this is due to the expansion of the shock front from the point of explosion and the incident pressure decreases up to ambient Pressure with the distance from the Point of explosion.
[15]. Because of the decay in the incident Pressure, the positive phase time duration of reflected pressure will increase.
4. REFERENCES
[1]. A. Khadid et al. (2007), “ Blast loaded stiffened plates” Journal of Engineering and Applied Sciences,Vol. 2(2) pp. 456-461.
[2]. The University of Melbourne, AustraliaKoccaz Z. (2004) Blast Resistant Building Design,MSc Thesis,Istanbul
© 2016, IRJET | Impact Factor value: 4.45 | ISO 9001:2008 Certified Journal
| Page 2369
[3]. T. Ngo, P. Mendis, A. Gupta & J. Ramsay Blast Loading and Blast Effects on Structures – An Overview.
[4]. Numerical Analysis of Steel Building Under blast Loading By Mohammad M. Abdallah, Bashir H. Osman College of Civil and Transportation Engineering,Hohai Univ, Civil Eng. Department–Sinnar – Sudan.
[5]. Mays, G. C.; Smith, P. D; Blast Effects on Buildings – Design of Buildings to Optimize Resistance to Blast.
[6]. Koccaz Z. (2004) Blast Resistant Building Design,MSc Thesis,Istanbul Technical University, Istanbul, Turkey.