RESEARCH OF A CONTROL VALVE CHARACTERISTICS
TEST
1YUDONG XIE, 2YANJUN LIU, 3YONG WANG
1,2,3Key Laboratory of High-efficiency and Clean Mechanical Manufacture at School of Mechanical
Engineering, Shandong University, Ministry of Education, Jinan, Shandong, China
E-mail: [email protected] , 2corresponding author [email protected] , [email protected]
ABSTRACT
Control valves are commonly found in modern process plants. The control valve reliability is critical to the control quality and safety of a plant. Whether a control valve meets the challenge of the control requirement depends on its response characteristics. To obtain the characteristics of the control valve, an experiment test system is developed to assess the performances of the control valve, the graphical description for the performances of the control valve is proposed, and the test method is presented.
Keywords: Test Technology, Control Valve, Process Control, Response Characteristics
1. INTRODUCTION
The market demands for higher quality products have increased the need for reduced process variation [1]-[3]. One factor in the quality of the final end product is the improvement of the control loop performance. A critical component in the loop is the control valve [4]-[5]. Whether the control valve meets the challenge of the control requirement depends on its response performances [6]-[7]. The static performance indexes of the control valve mainly include intrinsic error, repeatability error, reproducibility error, rated travel deviation, dead band, start error, stop error, etc. The dynamic performance indexes usually contain response rise time, response peak time, step-response regulating time, step-step-response overshoots, etc. In order to get the static and dynamic characteristics of the control valve, we need to build a test system and establish the test method.
In this paper, section 2 presents the design of the test system which is used to obtain the performances of the control valve. Section 3 proposes the graphical description and the test method for the performances of the control valve. Section 4 gives conclusions to the whole paper.
2. DESIGN OF THE TEST SYSTEM
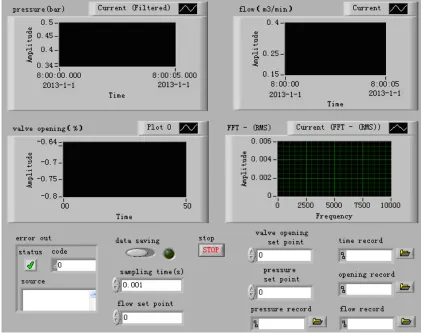
The schematic diagram of the performance test system of the control valve is shown in Fig. 1. The controller is a computer controller. The signal of pressure or flow measured using the pressure or
flow meter is compared with the signal of the desired pressure or flow by the controller. The
controller output accordingly adjusts the
opening/closing actuator of the control valve in order to maintain the actual pressure or flow close to the desired pressure or flow.
The communication between the PC and the peripherals is realized by the PCI-6238 data acquisition card which is produced by the National Instruments Company of the United States. The main technical parameters of PCI-6238 are as follows:
(1) 60V Isolated (Analog Current: 8 Analog Inputs, 2 Analog Outputs, Digital 30V: 6 Inputs, 4 Sourcing Outputs).
(2) For the analog input, the sampling rates is 250 kS/s, the resolution is 16 bits, the maximum input current is in the range of -20mA ~ + 20mA,
precision scope is 18.8
μA
, and the range ofsensitivity is 0.24
μA
.(3) For the analog output, the update rate is 500 kS/s, the resolution is 16 bits, the maximum current range is in the range of 0-20mA, and the precision
scope is 52.3
μA
.(4) For the digital channels, the input voltage is in the range of 0-30 V, the output voltage is in the range of 0-30 V.
position transducer
pipe
actuator
flange flange pressure
sensor
wiring card
data acquisition card PCI-6238
pipe pressure pipe
sensor pipe
flow sensor
fluid
PC controller computer control
system
control valve
[image:2.612.93.520.70.322.2]throttle regulator
Fig. 1 Schematic Diagram Of The Performance Test System
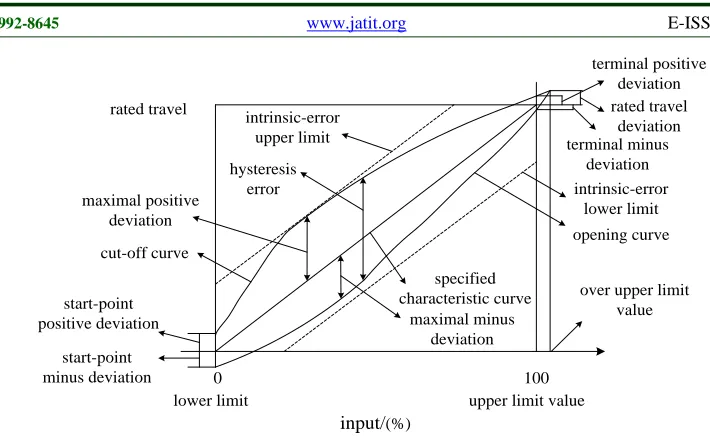
[image:2.612.95.518.355.688.2]terminal positive deviation terminal minus deviation rated travel deviation start-point positive deviation start-point minus deviation maximal positive deviation maximal minus deviation specified characteristic curve opening curve intrinsic-error upper limit cut-off curve intrinsic-error lower limit hysteresis error input/(%) 0 100
lower limit upper limit value
[image:3.612.120.475.70.290.2]over upper limit value rated travel
Fig. 3 Graphic Description For The Static Performance
3. TEST METHOD
According to the relevant test standard, the control valve is in no-load condition for the static performance test. In the test, we should input the slowly changing signal successively in the positive direction and the negative direction, so as to make the actuator of the control valve operate continuously and smoothly in the whole travel. When test the travel, we should regard the position where the core of the control valve is totally close as the test reference. Fig.3 shows the graphic description for the static performance of the control valve [8].
After the test, we can get the static performance indexes of the control valve according to the following method.
(1) intrinsic error
In the specified reference conditions, the calculation formula of the intrinsic error can be written as
in t s 100%
e
l l
l
δ = − × (1)
where lt denotes the test travel value of the test
point, lsexpresses the specified travel value of the
test point, and le is the rated travel of the control
valve.
(2) repeatability error
The calculation formula of repeatability error can be described by
re i j 100%
e
l l
l
δ = − × (2
)
where li is the maximum travel measurement of the
test point, and lj denotes the minimum travel
measurement of the test point (in the condition of test input signals in the same direction for many times).
(3) reproducibility error
The reproducibility error can be expressed as
rc m n 100%
e
l l
l
δ = − × (3)
where lm is the maximum travel measurement of
the test point with valve open signals, and ln
expresses the minimum travel measurement of the test point with valve close signals.
(4) start error、stop error
The start error and the stop error can be written, respectively, as 100% d sa e l l
δ = × (4)
100% g e so e l l l
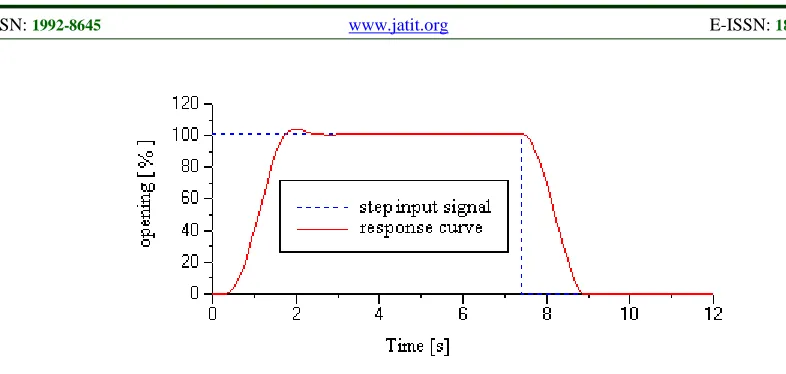
Fig. 4 Step Response
where δsa expresses the start error, δso is the stop
error, ld is the travel measurement when the input
signal is in the lower limit, and lg is the travel
measurement while the input signal is in the upper limit.
(5) rated travel error
The rated travel error can be described by
100%
a e
ra e
l l
l
δ = − × (6)
where lais the travel measurement when the input
signal is in the over upper limit.
(6) hysteresis error
The hysteresis error can be written as
100%
b c
hy e
l l
l
δ = − × (7)
where lbdenotes the tralve measurement of the test
point with the valve open signal, and lcis the travel
measurement of the test point with valve close signal.
As shown in Fig. 4, we can obtain the dynamic characteristics through step response test.
4. CONCLUSIONS
Control valves are generally present whenever fluid flow regulation is required. The control valve characteristics are critical to the control quality and safety of a plant. By means of the test technique, the characteristics of the control valve can be obtained. In this paper, an experiment test system is
developed to assess the performances of the control valve and the test method is presented.
ACKNOWLEDGEMENTS
This work was supported by Special Funds for Postdoctoral Innovative Projects of Shandong Province (No. 201103033), Independent Innovation Foundation of Shandong University (IIFSDU No. 2011GN045), and Key Laboratory of High-efficiency and Clean Mechanical Manufacture at Shandong University of Education Ministry.
REFRENCES:
[1] K. Yonezawa, R. Ogawa and K. Ogi,
“Flow-induced Vibration of a Steam Control Valve”,
Journal of Fluids and Structures, Vol. 35,
2012, pp. 76-88.
[2] M.A. Mohammad and B. Huang,
“Compensation of Control Valve Stiction
Through Controller Tuning”, Journal of
Process Control, Vol. 22, No. 9, 2012, pp.
1800-1819.
[3] M. Potter and M. Bacic, “Design and Control
of Hardware-in-the-loop Simulations for Testing Non-return-valve Vibrations in Air
Systems”, IEEE Transactions on Control
Systems Technology, Vol. 20, No. 1, 2012, pp.
98-110.
[4] YS. Tverskoi, N.A. Agafonova and E.D.
Marshalov, “Diagnosing the Characteristics of Control Valves used in Power Unit Control
Systems”, Thermal Engineering, Vol. 59, No.
2, 2012, pp. 139-146.
[5] Y.D Xie, Y.J. Liu and Y. Wang, “Prediction
Advanced Materials Research, Vol. 605-607, 2013, pp. 1345-1349.
[6] D. Bottazzi, F. Franzoni and M. Milani,
“Metering Characteristics of a Closed Center Load-Sensing Proportional Control Valve”, SAE International Journal of Commercial Vehicles, Vol. 2, No. 2, 2010, pp. 66-74.
[7] J. Ruan, R. Burton and P. Ukrainetz, “An
Investigation into the Characteristics of a 2D
Flow Control Valve”, American Society of
Mechanical Engineers, The Fluid Power and Systems Technology Division, Vol. 7, 2000, pp. 127-133.
[8] Y.Q. He, X.Z. Qiu and J. Yang: “Design and
Application of Control Valve”, Chemical