www.impactjournals.com/oncotarget/ Oncotarget, Vol. 6, No. 27
Molecular characterization of patients with pathologic complete
response or early failure after neoadjuvant chemotherapy
for locally advanced breast cancer using next generation
sequencing and nCounter assay
Kyunghee Park1,*, Moon Ki Choi2,*, Hae Hyun Jung3, In-Gu Do4, Kwang Hee Lee5,
TaeJin Ahn1, Won Ho Kil6, Seok Won Kim6, Jeong Eon Lee6, Seok Jin Nam6,
Duk-Hwan Kim7, Jin Seok Ahn2, Young-Hyuck Im2,3 and Yeon Hee Park2,3
1 Samsung Genomic Institute, Samsung Biological Research Institute, Samsung Medical Center, Sungkyunkwan University School of Medicine, Seoul, Korea
2 Division of Hematology-Oncology, Department of Medicine, Samsung Medical Center, Sungkyunkwan University School of Medicine, Seoul, Korea
3 Biomedical Research Institute, Samsung Medical Center, Sungkyunkwan University School of Medicine, Seoul, Korea 4 Center of Companion Diagnostics, Innovative Cancer Medicine Institute, Samsung Medical Center, Seoul, Korea 5 Life Science Solutions Group, Thermo Fisher Scientific Corporation, Seoul, Korea
6 Department of Surgery, Samsung Medical Center, Sungkyunkwan University School of Medicine, Seoul, Korea
7 Department of Molecular Cell Biology, Samsung Biomedical Research Institute, Sungkyunkwan University School of Medicine, Suwon, Korea
* These authors have contributed equally to this work
Correspondence to: Yeon Hee Park, email: [email protected]
Keywords: neoadjvant chemotherapy, pathologic complete response, breast cancer, refractory
Received: March 10, 2015 Accepted: May 02, 2015 Published: May 12, 2015
This is an open-access article distributed under the terms of the Creative Commons Attribution License, which permits unrestricted use, distribution, and reproduction in any medium, provided the original author and source are credited.
ABSTRACT
Neoadjuvant chemotherapy (NAC) has the added advantage of increasing breast conservation rates with equivalent survival outcomes compared with adjuvant chemotherapy. A subset of breast cancer patients who received NAC experienced early failure (EF) during the course of therapy or within a short period after curative breast surgery. In contrast, patients with pathological complete response (pCR) were reported to have markedly favorable outcomes. This study was performed to identify actionable mutation(s) and to explain refractoriness and responsiveness to NAC. Included in this analysis were 76 patients among 397 with locally advanced breast cancer for whom a preoperative fresh-frozen paraffin-embedded tumor block was available for next-generation sequencing using AmpliSeq. The incidence of missense mutations in KRAS was much higher in patients with EF than in other groups (p < 0.01). In contrast, polymorphisms of the cMET gene were found in patients with pCR exclusively (p < 0.01).
INTRODUCTION
Neoadjuvant chemotherapy (NAC) has the added advantage of increasing breast conservation rates with similar disease-free and overall survival compared with adjuvant chemotherapy [1, 2]. In addition, the neoadjuvant setting is a formidable research tool to unveil
higher rate of pathologic complete response (pCR) [1, 3]. In particular, standard polychemotherapy results in pCR in more than 20% of patients [4, 5], and this response is considered a surrogate of increased survival compared with patients without pCR [6]. pCR to NAC indicates an extremely chemotherapy-sensitive tumor and heralds excellent long-term cancer-free survival [7]. Thus, it is currently acknowledged as a surrogate end point for
therapeutic benefit, especially in HER2-positive BC and
TNBC [8].
In contrast, a subset of patients who receive NAC experiences early failure (EF) during the course of therapy or within a short period after curative breast surgery. Recently, we conducted a retrospective analysis to determine the incidence and predictors of EF after NAC, with the ultimate aim of identifying patients who
may not benefit from NAC. We reported that 9.6 % of
the breast cancer patients who received NAC in our study developed EF within 1 year, and that the post-failure survival period of this group was shorter than that of
the late-failure group [9]. Patients who had HER2+ BC
or TNBC and the presence of lymphovascular invasion had a high risk of EF after controlling for other clinical
and demographic variables [9]. There are no established
biological predictors of EF in locally advanced breast
cancer (LABC) patients who receive NAC compared with pCR.
This study was performed to identify candidate actionable mutation(s) to explain pCR and EF or refractoriness to chemotherapy in BC patient groups that
may benefit to a greater extent, or not benefit from NAC.
RESULTS
Patient cohort
Recently, we reported data from 397 patients
who received NAC regarding the evaluation of the clinicopathologic feature of patients with early failure as well as pCR. These data were from the electronic database of the Department of Medicine at the Samsung Medical Center and from retrospectively reviewed records of 433
patients who were diagnosed with histologically confirmed
invasive breast cancer and received NAC at the Samsung
Medical Center from January 2005 to December 2011 [9].
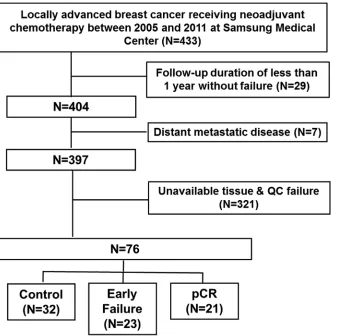
[image:2.612.155.493.366.702.2]Among these populations, 76 patients who had available tissue for next generation sequencing (NGS) and nCounter assay were included in this analysis (Figure 1).
Clinicopathological characteristics of the 76 patients with NAC
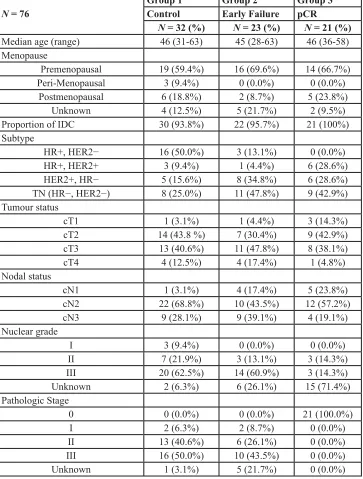
The median age at diagnosis of the 76 patients was 46 years (range, 28–63 years; Table 1). Among the 76 patients, 23 patients showed EF, 21 patients had pCR, and the remaining 32 patients were regarded as controls. The subtype distributions was as follows: patients with EF
were more likely to have HER2+ BC (39.1%) or TNBC (47.8%). Patients with HR+ BC (ER+ and/or PgR+ and HER2−) had no pCR, and HER2+ patients represented 57.2% of the pCR group. TNBC was present in 42.9% of
the patients in the pCR group.
Next generation sequencing using Ampliseq with > 1% for mutations with low allele fraction
Figure 2A shows the number of patients with mutations in 50 genes among 76 patients. Fifty-one of the 76 patients (67.1%) harbored at least one mutation (Figure 2; MAF < 0.01). A total of 532 mutations were detected in samples from 76 patients. Genes in which somatic mutations were detected frequently included TP53 (50 cases, 65.8%), APC (33 cases, 43.4%), RB1 (25
[image:3.612.126.489.69.548.2]cases, 32.9%), SMAD4 (21 cases, 27.6%), KIT (20 cases, 26.3%), MET, (20 cases, 26.3%), PIK3CA (20 cases, 26.3%), ALK (16 cases, 21.1%), EGFR (15 cases, 19.7%),
Table 1: Patients’ characteristics.
N = 76
Group 1 Group 2 Group 3
Control Early Failure pCR
N = 32 (%) N = 23 (%) N = 21 (%) Median age (range) 46 (31-63) 45 (28-63) 46 (36-58) Menopause
Premenopausal 19 (59.4%) 16 (69.6%) 14 (66.7%)
Peri-Menopausal 3 (9.4%) 0 (0.0%) 0 (0.0%)
Postmenopausal 6 (18.8%) 2 (8.7%) 5 (23.8%)
Unknown 4 (12.5%) 5 (21.7%) 2 (9.5%)
Proportion of IDC 30 (93.8%) 22 (95.7%) 21 (100%)
Subtype
HR+, HER2− 16 (50.0%) 3 (13.1%) 0 (0.0%)
HR+, HER2+ 3 (9.4%) 1 (4.4%) 6 (28.6%)
HER2+, HR− 5 (15.6%) 8 (34.8%) 6 (28.6%)
TN (HR−, HER2−) 8 (25.0%) 11 (47.8%) 9 (42.9%)
Tumour status
cT1 1 (3.1%) 1 (4.4%) 3 (14.3%)
cT2 14 (43.8 %) 7 (30.4%) 9 (42.9%)
cT3 13 (40.6%) 11 (47.8%) 8 (38.1%)
cT4 4 (12.5%) 4 (17.4%) 1 (4.8%)
Nodal status
cN1 1 (3.1%) 4 (17.4%) 5 (23.8%)
cN2 22 (68.8%) 10 (43.5%) 12 (57.2%)
cN3 9 (28.1%) 9 (39.1%) 4 (19.1%)
Nuclear grade
I 3 (9.4%) 0 (0.0%) 0 (0.0%)
II 7 (21.9%) 3 (13.1%) 3 (14.3%)
III 20 (62.5%) 14 (60.9%) 3 (14.3%)
Unknown 2 (6.3%) 6 (26.1%) 15 (71.4%)
Pathologic Stage
0 0 (0.0%) 0 (0.0%) 21 (100.0%)
I 2 (6.3%) 2 (8.7%) 0 (0.0%)
II 13 (40.6%) 6 (26.1%) 0 (0.0%)
III 16 (50.0%) 10 (43.5%) 0 (0.0%)
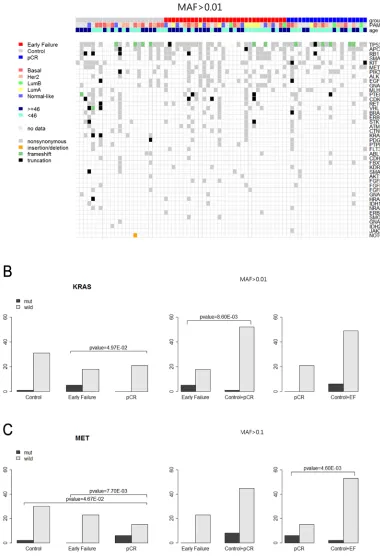
Figure 2: Frequency of mutations in 76 patients for Ampliseq (MAF>0.01). A. Total patients (n = 76). B. Control (n = 32). C.
GNAQ (14 cases, 18.4%), MLH1 (14 cases, 18.4%),
PTEN (14 cases, 18.4%), CDKN2A (13 cases, 17.1%),
RET (10 cases, 15.8%), and VHL (10 cases, 15.8%), as shown in Figure 2A. Figure 2B-2D shows the number of samples and mutation proportions among the three groups, respectively.
Figure 3A depicts the heat map of the mutations detected in the 76 patients. Frameshift mutations in the TP53 gene were observed more frequently in patients with pCR than in those with EF (23.8% vs. 17.4%). Most of the mutations were nonsynonymous.
KRAS alterations were found in six cases (7.9%) among the 76 samples: five of those were detected in patients with EF. However, there were no KRAS mutations
in patients with pCR (Table 2A, 2B; Figure 3B).
> 10% variants for polymorphism
To seek polymorphisms, variants were collected and are shown in Supplementary Figures 1A, 1B, 1C, 1D
and 2. Met alterations were significantly more frequent in
patients with pCR than they were in those with EF (Table 2C, 2D; Figure 3C).
nCounter assay using NanoString including PAM50 and IHC (Table 3, Figure 4)
Figure 4A shows the distribution of the intrinsic
subtypes classified by PAM50 using the NanoString
[image:5.612.57.560.264.733.2]nCounter assay. This analysis was performed in 62 patients who were available for further nCounter assay using RNA
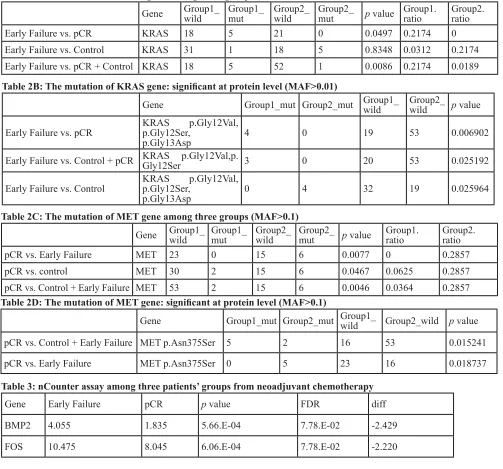
Table 2A: The mutation of KRAS gene among three groups (MAF>0.01)
Gene Group1_wild Group1_mut Group2_wild Group2_mut p value Group1.ratio Group2.ratio
Early Failure vs. pCR KRAS 18 5 21 0 0.0497 0.2174 0
Early Failure vs. Control KRAS 31 1 18 5 0.8348 0.0312 0.2174
Early Failure vs. pCR + Control KRAS 18 5 52 1 0.0086 0.2174 0.0189 Table 2B: The mutation of KRAS gene: significant at protein level (MAF>0.01)
Gene Group1_mut Group2_mut Group1_wild Group2_wild p value
Early Failure vs. pCR KRAS p.Gly12Ser, p.Gly12Val,
p.Gly13Asp 4 0 19 53 0.006902
Early Failure vs. Control + pCR KRAS p.Gly12Val,p.Gly12Ser 3 0 20 53 0.025192
Early Failure vs. Control KRAS p.Gly12Ser, p.Gly12Val,
p.Gly13Asp 0 4 32 19 0.025964
Table 2C: The mutation of MET gene among three groups (MAF>0.1)
Gene Group1_wild Group1_mut Group2_wild Group2_mut p value Group1.ratio Group2.ratio
pCR vs. Early Failure MET 23 0 15 6 0.0077 0 0.2857
pCR vs. control MET 30 2 15 6 0.0467 0.0625 0.2857
pCR vs. Control + Early Failure MET 53 2 15 6 0.0046 0.0364 0.2857 Table 2D: The mutation of MET gene: significant at protein level (MAF>0.1)
Gene Group1_mut Group2_mut Group1_wild Group2_wild p value
pCR vs. Control + Early Failure MET p.Asn375Ser 5 2 16 53 0.015241
pCR vs. Early Failure MET p.Asn375Ser 0 5 23 16 0.018737
Table 3: nCounter assay among three patients’ groups from neoadjuvant chemotherapy
Gene Early Failure pCR p value FDR diff
BMP2 4.055 1.835 5.66.E-04 7.78.E-02 -2.429
extracts after NGS. In contrast with the control group, the HER2-enriched and basal-like subtypes were composed of mainly of patients with EF and pCR. Compared with the pCR group, the basal-like subtype was found predominantly in the EF group. The IHC distribution
of the four subtypes (ER+/HER2-, ER+/HER2+, ER-/ HER2+, and triple negative) among the three patient
[image:6.612.106.486.139.695.2]groups receiving NAC (control, EF, and pCR) ia shown in Figure 4A and 4B. The heat map of PAM50 genes detected among the three groups is shown in Supplementary Figure
Figure 3: A. Heatmap of the mutations found in 76 patients (MAF>0.01). B. KAS mutation among three patients’ groups (MAF >0.01).
3.
An expression analysis of 257 genes among the three groups showed that FOS gene expression was
significantly higher in patients with EF than it was in those
with pCR (Figure 4C). Table 3 shows the list of genes
that exhibitedsignificant fold changes among the groups
[image:7.612.163.460.122.699.2]of patients. In addition, the heat map of fold changes in the 257 genes among the three groups is shown in Supplementary Figure 4.
Figure 4: nCounter assay of 62 patients who were available tissue for RNA analysis. A. PAM50 genes. B. Immunohistochemistiry.
DISCUSSION
Paradoxically, our results showed that the distribution of intrinsic subtypes, as assessed using IHC, between the patients with pCR or EF appeared to be similar even though they had a completely different
prognosis. In addition, the PAM50 gene set confirmed
this similarity between pCR or EF. Most of the patients
with pCR or EF were TNBC and HER2+ subtypes. This
represents the extreme tumor heterogeneity of breast
cancer, especially in patients with TNBC and HER2+
tumors. Obviously, characterizing pCR is of immense importance and has clinical implications for patients with LABC. For the same reasons, characterizing EF is crucial because of its dismal prognosis in spite of its curable
clinical setting, as described in our previous report [9].
Thus, the development of useful predictors for prognostic evaluation or for predicting chemotherapeutic response
is urgently needed and will have significant clinical
implications.
Therefore, proper treatment strategies for patients with extreme different prognosis could be differentiated after the characterization of pCR and EF in advance using multi-omics on pre-chemotherapy biopsy tissues.
Our results showed that KRAS mutation was
enriched in patients with EF compared with pCR and pCR plus control (21.7% vs. 0%, 21.7% vs. 1.8%) (Table
3A; Figure 3A, 3B). Patients with KRAS codon 12 and
13 mutations seemed to present a worse prognosis with chemotherapy refractoriness and aggressive clinical course, in spite of the curative clinical setting (Table 3A, 3B). The proportion of EF detected in this study
was classified as a deeply peculiar clinical setting with significant implications. This result was compatible with
another recent study that reported possible prognostic
and predictive significance of KRAS alteration together
with MYC mutation [10], which was not included in this panel (Supplementary Table 1). This marker may help the
clinical stratification of NAC in patients with BC. The
predominance of frameshift mutations of TP53 in patients with pCR is compatible with a recent mutational analysis of patients with NAC (Figure 3A) [11].
The other significant finding of this study was the
presence of MET gene alterations in patients with pCR (Table 3C, 3D; Figure 3C). Table 3C and D showed that MET gene alterations were driven mainly in patients with pCR. No patients with EF had MET gene alterations (MAF > 0.1). In fact, this alteration was found while searching for polymorphisms that contribute to responsiveness to chemotherapy. This alteration contributes to the loss
of c-MET affinity to its ligand, HGF, which has been identified as a phantom ligand of MET [12-14]. Lung
cancer cells expressing this mutation have been reported to be less sensitive to c-MET inhibition by SU11274. This mutation has been further characterized as a polymorphism because of its increased frequency within
general population and its lack of transforming abilities
[15, 16]. These findings are supported by recent reports that the HGF/c-MET axis drives cancer aggressiveness
[12, 17]. Interestingly, PAM50 analysis using surrogate IHC subtyping showed an even distribution of each subtype between EF and pCR: HER2-enriched and basal-like subtypes were distributed between EF and pCR evenly (Figure 4A, 4B). c-MET mutation may be a plausible explanation for this paradox. MET polymorphism in tumors of the HER2-enriched and basal-like subtype may contribute to responsiveness or refractoriness to NAC even in the same intrinsic subtypes. Moreover, FOS expression appeared to be higher in patients with EF; however, this
finding warrants validation in future research.
CONCLUSION
KRAS gene mutation and c-MET gene
polymorphism were associated with EF and pCR in this analysis. Our results support the contention that targeted sequencing using a cancer panel may function to identify actionable targets that are associated with responsiveness or refractoriness to NAC among patients with LABC.
MATERIALS AND METHODS
Patients
Seventy-six patients among 397 with LABC
(cT2-4N0-3) for whom a preoperative FFPE tumor block was available for NGS were included in this analysis,
excluding 22 patients whose fresh-frozen paraffin-embedded (FFPE) blocks were not qualified for AmpliSeq. pCR was defined as the absence of residual tumor both in
breast and axillary lymph nodes. The presence of ductal
carcinoma in situ was included in pCR. EF was defined
as the development of an inoperable state caused by
locoregional and/or systemic progression during NAC,
or relapse after curative surgery within 1 year after the initiation of NAC. Patients who developed recurrence after 1 year from the start of NAC or exhibited no failure during
the follow-up period were defined as controls in this study.
Thus, our cohort was composed of three groups: pCR, EF, and control. The clinicopathological characteristics and disease courses of the patients whose disease progressed within 1 year of receiving neoadjuvant chemotherapy were analyzed, for comparison with the other patients. A total of 76 patients with LABC who received NAC and had an available preoperative tumor tissue were included in this analysis. The institutional review board of Samsung
Medical Center, Seoul, Korea approved our study protocol
Immunohistochemical staining
Two experienced pathologists reviewed all pathology specimens to determine the following tumor characteristics: histological and nuclear grades, primary tumor size, presence of lymphovascular invasion, multiplicity, and IHC staining for ER, PgR, and HER2.
ER and PgR positivity were defined using Allred scores
ranging from 3 to 8 based on IHC using antibodies to the ER (Immunotech, Marseille, France) and PgR (Novocastra Laboratories Ltd., Newcastle upon Tyne,
UK). HER2 status was evaluated using a specific antibody (Dako, Glostrop, Denmark) and/or fluorescence in situ
hybridization (FISH). Grades 0 and 1 for HER2, as
assessed by IHC, were defined as a negative result, and grade 3 was defined as a positive result. Amplification of HER2 was confirmed by FISH if HER2 was rated as 2+ by IHC. Ki67 IHC analyses were evaluated by both
independent semiquantitative and quantitative methods
(Dako). “Triple negativity” was defined as a lack of
expression of ER, PgR, and HER2. Our pathologists also reviewed all core biopsies from referring institutions, including IHC performed at the time of the initial referral,
and findings for all surgical specimens, without knowledge
of the NanoString results or the treatment outcome. The institutional review board of the Samsung Medical Center,
Seoul, Korea approved our study protocol for informed
consent waiver and the use of archival tissues with retrospective clinical data.
DNA extraction
Tissue sample with tumor cell percentage with more than 75% (from 4 mm unstained sections) were dissected under a microscope by comparison with an H&E-stained slide, and genomic DNA was extracted from 76 patients with LABC using a Qiagen DNA FFPE
Tissue Kit (Qiagen, Hilden, Germany) according to the manufacturer’s instructions. After extraction, we measured DNA concentration as well as 260/280 and 260/230 nm
ratios using a spectrophotometer (ND1000; NanoDrop
Technologies, Thermo Fisher Scientific, Waltham, MA, USA). Each sample was then quantified using a Qubit fluorometer (Life Technologies, Carlsbad, CA, USA).
Genomic DNA with a quantity > 10 ng, as measured on the
Qubit fluorometer, was subjected to library preparation.
RNA extraction
Areas containing representative invasive breast carcinoma were outlined on the slide. Total RNA
was extracted from 2-4 sections of 4-μm thick, FFPE
sections. Nontumor elements were removed by manual microdissection before transfer to the extraction tube,
guided by hematoxylin and eosin stained slides. Then, total RNA was extracted using the High Pure RNA
Paraffin kit (Roche Diagnostics, Mannheim, Germany).
RNA yield and purity were assessed using a NanoDrop ND-1000 Spectrophotometer (NanoDrop Technologies,
Rockland, DE, USA). One sample with less than 50 ng/uL
of total RNA , even after concentration using a SpeedVac
concentrator (Thermo Scientific™, Waltham, MA, USA)
was excluded from downstream analysis, because 200 ng of input RNA in a volume of 5 uL volume needed to be hybridized with 20 uL of probe set master mix.
NanoString® nCounter Assay using 250 genes
probe including PAM50 genes
Gene expression was measured on the NanoString nCounter Analysis System (NanoString Technologies,
Seattle, WA, USA). The system measures the relative
abundance of each mRNA transcript of interest using a multiplexed hybridization assay and digital readouts
of fluorescent bar-coded probes that are hybridized to
each transcript [18]. An nCounter CodeSet (NanoString Technologies) containing a biotinylated capture probe for 252 target genes, including 50 PAM50 genes and
five housekeeping genes (Supplementary Table 2) and
reporter probes attached to color-barcode tags-according
to the nCounter™ code-set design-was hybridized
in solution to 200 ng of total RNA for 18 h at 65 °C,
according to the manufacturer’s instructions. Hybridized
samples were loaded onto the nCounter Prep Station for posthybridization processing. On the deck of the Prep
Station, hybridized samples were purified and immobilized
in a sample cartridge for data collection, followed by
quantification of the target mRNA in each sample using the nCounter Digital Analyzer. Quantified expression data were analyzed using NanoString’s nSolver Analysis
Software. After performing image quality control using a
predefined cutoff value, we excluded the outlier samples
using a normalization factor based on the sum of positive control counts greater than threefold. The counts of the probes were then normalized using the geometric mean
of the five housekeeping genes and log2-transformed for
further analysis. In total, 62 patients with LABC and 252 genes were used in the statistical analyses.
Next generation sequencing (NGS) using Ion torrent ampliseq cancer panel v2
constructed using the Ion AmpliSeq Panels pool (Life Technologies) and 10 ng of DNA sample per pool. The amplicons were then ligated to Ion Xpress Barcode
Adapters and purified. Next, multiplexed bar-coded libraries were enriched by clonal amplification using
emulsion PCR on Ion Sphere particles (Ion PGM Template
OT2 200 Kit, Life Technologies) and loaded onto an Ion
316 Chip. Massively parallel sequencing was carried out
on the Ion PGM using the Ion PGM Sequencing 200 Kit
v2. The Ion AmpliSeq Cancer Hotspot Panel v2 (www. lifetechnologies.com) covered hot-spot regions of 50 oncogenes and tumor suppressor genes.
The primary filtering process was carried out using
the Torrent Suite v3.6.0 and the Ion Torrent Variant Caller v3.6 software. The pipeline includes signaling processing, base calling, quality score assignment, adapter trimming,
read alignment to human genome 19 references, mapping
QC, coverage analysis, and variant calling. For variant detection, a minimum coverage of 100 reads must be achieved, and at least 5% of mutant reads were selected for variants. Variant calls were further analyzed using
the ANNOVAR, which included variant filtering and
annotation using the COSMIC database, dbSNP build 137, and amino acid change information.
Bioinformatic and statistical analysis for ampliseq and nCounter assay
Variant calls from Ion AmpliSeq were further
evaluated to reduce potential false-positives. We
considered coverage ( > 100) and quality score ( > 30)
as filtering criteria. In addition, a minimum threshold
of mutant allele fraction (MAF) was taken into account for convincing variants as real: > 1% for mutations with a low allele fraction and > 10% for polymorphisms. For
the statistical analysis of final variants, read alignments
were manually investigated using the Integrative
Genomic Viewer (http://www.broadinstitute.org/igv/). We also discarded the Korean-specific germ-line variants rs1042522 in TP53 and rs1870377 in KDR. Among the variants that satisfied the filtering criteria described above,
variants causing amino acid changes and frameshifts were
finally chosen for statistical analysis. Fisher’s exact test
was used for the analysis of mutations and polymorphic variants separately, to discover variants that were enriched in the patients with a favorable outcome. P-values < 0.05
were considered significantly different.
For gene expression data from the NanoString
nCounter assay, filtering of samples using quality
control (QC) criteria was performed according to the
manufacturer’s recommendations. Raw counts of QC-passed samples were normalized using five reference
genes as internal controls (GUSB, PUM1, TBP, TFRC, and TUBB). The QC and normalization mentioned above were performed using the nSolver Analysis Software
v2.0 (NanoString Technologies) [19]. Data were
log2-transformed and used for further analysis. To compare
normalized expression values between groups classified
according to clinical outcomes, a t test was used. P-values were adjusted using the FDR correction for multiple comparisons [20]. FDRs less than 0.1 were considered as
significantly different.
Intrinsic subtypes classification was performed
by using the PAM50 predictor, as described in Parker et al. [21]. To obtain more consistent results, we merged microarray expression data of TCGA breast cancers with our NanoString data after adjusting for batch effects using ComBat algorithm [22], and applied nearest PAM50
centroid algorithm Bioclassifier to predict PAM50
subtypes [21]. All statistical tests, plots and PAM50 subtype prediction were conducted using R version 3.0.2
(http://www.R-project.org/).
REMARK guidelines
In reporting our study, we have adhered to the guidelines of an important methodological paper from 2005 entitled “Reporting recommendations for tumor
marker prognostic studies (REMARK guidelines).” [23,
24]. To decrease any potential bias arising in a review of
the medical records, we included ‘Patient Cohort’ analysis to fulfill these criteria (Figure 1).
ACKNOWLEDGMENTS
This work was supported by the Samsung Biomedical Research Institute Grant, No. SBRI SMO1131861.
AUTHORS’ CONTRIBUTIONS
YH.P. and YH.I. conceived of the project. MK.K., WH.K., SW.K., JE.L., JS.A. and SJ.N. performed clinical
data analyses with technical support from HH.J. and
DH.K.; TJ.A. and K.P performed all of the bioinformatics and statistical analyses with technical support from KH.L.; HH.J. and DH.K. performed expression profiling and NGS with technical support from TJ.A. and K.P. IG.D. provided
pathology review. YH.I. provided intellectual input. YH.P.,
K.P. and TJ.A. wrote the manuscript. All authors reviewed
and revised the manuscript.
CONFLICTS OF INTEREST
The authors declare no potential conflicts of interest.
REFERENCES
Kahlenberg MS, Paik S, Soran A, Wickerham DL, et al. Sequential preoperative or postoperative docetaxel added to preoperative doxorubicin plus cyclophosphamide for operable breast cancer:National Surgical Adjuvant Breast and Bowel Project Protocol B-27. J Clin Oncol. 2006; 24: 2019-2027.
2. van der Hage JA, van de Velde CJ, Julien JP, Tubiana-Hulin M, Vandervelden C and Duchateau L. Preoperative chemotherapy in primary operable breast cancer: results from the European Organization for Research and Treatment of Cancer trial 10902. J Clin Oncol. 2001; 19: 4224-4237.
3. Rastogi P, Anderson SJ, Bear HD, Geyer CE, Kahlenberg MS, Robidoux A, Margolese RG, Hoehn JL, Vogel VG, Dakhil SR, Tamkus D, King KM, Pajon ER, et al. Preoperative chemotherapy: updates of National Surgical Adjuvant Breast and Bowel Project Protocols B-18 and B-27. J Clin Oncol. 2008; 26: 778-785.
4. Liedtke C, Mazouni C, Hess KR, Andre F, Tordai A, Mejia JA, Symmans WF, Gonzalez-Angulo AM, Hennessy B, Green M, Cristofanilli M, Hortobagyi GN and Pusztai L. Response to neoadjuvant therapy and long-term survival in patients with triple-negative breast cancer. J Clin Oncol. 2008; 26: 1275-1281.
5. Carey LA, Dees EC, Sawyer L, Gatti L, Moore DT, Collichio F, Ollila DW, Sartor CI, Graham ML and Perou CM. The triple negative paradox: primary tumor chemosensitivity of breast cancer subtypes. Clin Cancer Res. 2007; 13: 2329-2334.
6. von Minckwitz G, Untch M, Blohmer JU, Costa SD, Eidtmann H, Fasching PA, Gerber B, Eiermann W, Hilfrich J, Huober J, Jackisch C, Kaufmann M, Konecny GE, et al. Definition and impact of pathologic complete response on prognosis after neoadjuvant chemotherapy in various intrinsic breast cancer subtypes. J Clin Oncol. 2012; 30: 1796-1804.
7. Kuerer HM, Newman LA, Smith TL, Ames FC, Hunt KK, Dhingra K, Theriault RL, Singh G, Binkley SM, Sneige N, Buchholz TA, Ross MI, McNeese MD, et al. Clinical course of breast cancer patients with complete pathologic primary tumor and axillary lymph node response to doxorubicin-based neoadjuvant chemotherapy. J Clin Oncol. 1999; 17: 460-469.
8. Cortazar P, Zhang L, Untch M, Mehta K, Costantino JP, Wolmark N, Bonnefoi H, Cameron D, Gianni L, Valagussa P, Swain SM, Prowell T, Loibl S, et al. Pathological complete response and long-term clinical benefit in breast cancer: the CTNeoBC pooled analysis. Lancet. 2014; 384: 164-172.
9. Choi MK, Park YH, Kil WH, Lee JE, Nam SJ, Ahn JS and Im YH. Clinicopathological features of early failure of neoadjuvant chemotherapy in locally advanced breast cancer. Cancer Chemother Pharmacol. 2014; 74: 521-529. 10. Pereira CB, Leal MF, de Souza CR, Montenegro RC, Rey
JA, Carvalho AA, Assumpcao PP, Khayat AS, Pinto GR,
Demachki S, de Arruda Cardoso Smith M and Burbano RR. Prognostic and predictive significance of MYC and KRAS alterations in breast cancer from women treated with neoadjuvant chemotherapy. PLoS One. 2013; 8: e60576. 11. Sikov WM, Barry WT, Hoadley KA, Pitcher BN, Singh
B, Tolaney SM, Kuzma CS, Pluard TJ, Somlo G, Port ER, Golshan M, Berry DA, Hahn OM, et al. Impact of intrinsic subtype by PAM50 and other gene signatures on pathologic complete response (pCR) rates in triple-negative breast cancer (TNBC) after neoadjuvant chemotherapy (NACT) +/- carboplatin (Cb) or bevacizumab (Bev): CALGB 40603/150709 (Alliance). 2014 San Antonio Breast Cancer Symposium; 2014 Dec 11; San Antonio, TX.
12. Mizuno S and Nakamura T. HGF-MET Cascade, a Key Target for Inhibiting Cancer Metastasis: The Impact of NK4 Discovery on Cancer Biology and Therapeutics. Int J Mol Sci. 2013; 14: 888-919.
13. Bottaro DP, Rubin JS, Faletto DL, Chan AM, Kmiecik TE, Vande Woude GF and Aaronson SA. Identification of the hepatocyte growth factor receptor as the c-met proto-oncogene product. Science. 1991; 251: 802-804.
14. Higuchi O, Mizuno K, Vande Woude GF and Nakamura T. Expression of c-met proto-oncogene in COS cells induces the signal transducing high-affinity receptor for hepatocyte growth factor. FEBS Lett. 1992; 301: 282-286.
15. Tengs T, Lee JC, Paez JG, Zhao X, LaFramboise T, Giannoukos G and Thomas RK. A transforming MET mutation discovered in non-small cell lung cancer using microarray-based resequencing. Cancer Lett. 2006; 239: 227-233.
16. Krishnaswamy S, Kanteti R, Duke-Cohan JS, Loganathan S, Liu W, Ma PC, Sattler M, Singleton PA, Ramnath N, Innocenti F, Nicolae DL, Ouyang Z, Liang J, et al. Ethnic differences and functional analysis of MET mutations in lung cancer. Clin Cancer Res. 2009; 15: 5714-5723. 17. Mariani M, McHugh M, Petrillo M, Sieber S, He S,
Andreoli M, Wu Z, Fiedler P, Scambia G, Shahabi S and Ferlini C. HGF/c-Met axis drives cancer aggressiveness in the neo-adjuvant setting of ovarian cancer. Oncotarget. 2014; 5: 4855-4867.
18. Sohn I, Kim J, Jung SH and Park C. Gradient lasso for Cox proportional hazards model. Bioinformatics. 2009; 25: 1775-1781.
19. Beard RE, Abate-Daga D, Rosati SF, Zheng Z, Wunderlich JR, Rosenberg SA and Morgan RA. Gene expression profiling using nanostring digital RNA counting to identify potential target antigens for melanoma immunotherapy. Clin Cancer Res. 2013; 19: 4941-4950.
20. Benjamini Y and Hochberg Y. Controlling the false discovery rate - a practical and powerful approach to multiple testing. J Royal Statist Soc B (Methodological). 1995; 57: 289-300.
JF, Stijleman IJ, Palazzo J, et al. Supervised risk predictor of breast cancer based on intrinsic subtypes. J Clin Oncol. 2009; 27: 1160-1167.
22. Johnson WE, Li C and Rabinovic A. Adjusting batch effects in microarray expression data using empirical Bayes methods. Biostatistics. 2007; 8: 118-127.
23. McShane LM, Altman DG, Sauerbrei W, Taube SE, Gion M and Clark GM. Reporting recommendations for tumor marker prognostic studies. J Clin Oncol. 2005; 23: 9067-9072.