Text Independent Speech Recognition
Aniruddha Mohanty
Abstract— Voice is one of the well-researched biometrics for speaker authentication. So, in the literature a number of techniques have been proposed which make use of speaker’s voice to verify their identity, control access to services, utilize information services, voice mailing, security control for confidential information areas, and remote access to computers. Speaker recognition is the task of automatically recognizing the speaker among several reference speakers using speaker-specific information embedded in speech waves. The extraction of this information is termed as features, and matching process are implemented right after the pre-processing of the signal. In literature, techniques have been proposed where Mel-Frequency Cepstral Coefficients (MFCCs) are taken as features for modeling by the Gaussian Mixture Model (GMM) during the identification process. The GMM algorithm is one of the clustering algorithms employed for the text independent speaker recognition. In this context, by adopting the idea of hierarchical clustering and GMM, an adaptive clustering algorithm, i.e., AGMM that can determine the number of optimal clusters automatically has been proposed. Numerical experiments demonstrate that the AGMM achieves better performance than the traditional GMM where the number of clusters is fixed.
Key words: GMM, MFCCs, LPC, FFT, DFT, FT
I. INTRODUCTION
A. Unique Characteristics of Personal Identity
Human beings have many characteristics that distinguish one individual from another. Some characteristics can be perceived very readily such as facial features and vocal qualities and behavior. Others such as finger prints, iris patterns and DNA structure, are not readily perceived and require measurements. In recent years biometrics has emerged as an applied scientific discipline with the objective of automatically capturing personal identifying characteristics and utilizing those we can go for the measurements of security, surveillance and forensic applications. In military applications, one of the important problem area is to detect and track a suspected target among a set of other persons. The task is to compare this sample with a database of similar measurements from known individuals to find a match. Many personal identifying characteristics are based on physiological properties, others on behavior, and some combine physiological and behavioral properties.
Voice is an example of a biometric that combines physiological and behavioral characteristics. Voice is attractive as a biometric for many reasons. It can be captured conveniently with simple transducers and recording devices. It is particularly useful for remote-access transactions over telecommunication networks. Speech variability is especially problematic due to variations in background noise, transmission and recording characteristics.
B. Speech Analysis
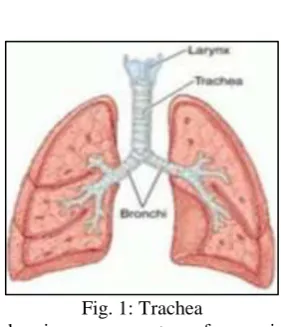
[image:1.595.357.498.81.245.2]Excitation is produced by airflow from the lungs and carried by the trachea through the vocal folds
Fig. 1: Trachea
Trachea is a common term for an airway through which respiratory air passes in organisms. In vertebrates, it is held open by up to 20 C-shaped rings of cartilage, and may also be known as the “windpipe.”
[image:1.595.306.528.343.518.2]The larynx (plural larynges), commonly called the voice box. It manipulates pitch and volume. The larynx houses the vocal folds, which are an essential component of phonation. Sound is generated in the larynx, and that is where pitch and volume are manipulated.
Fig. 2:
Fine manipulation of the larynx is used to generate a source sound with a particular fundamental frequency, or pitch. This source sound is altered as it travels through the vocal tract, configured differently based on the position of the tongue, lips, mouth, and pharynx. The process of altering a source sound as it passes through the filter of the vocal tract creates the many different vowel and consonant sounds of the world’s languages as well as tone, certain realizations of stress and other types of linguistic prosody.
[image:1.595.325.532.622.756.2]The vocal folds, also known commonly as vocal cords, are composed of twin in folding of mucous membrane stretched horizontally across the larynx. They vibrate, modulating the flow of air being expelled from the lungs during phonation. Open during inhalation, closed when holding one’s breath, and vibrating for speech or singing. The larynx is a major source of sound in speech, generating sound through the rhythmic opening and closing of the vocal folds. The perceived pitch of a person’s voice is determined by a number of different factors, not least of which the fundamental frequency of the sound is generated by the larynx. The fundamental frequency is influenced by the length, size, and tension of the vocal folds. In an adult male, this frequency averages about 125 Hz, adult females around 210 Hz, in children the frequency is over 300 Hz. The vocal folds generate a sound rich in harmonics. The harmonics are produced by collisions of the vocal folds with themselves, by recirculation of some of the air back through the trachea, or both. Men and women have different vocal fold sizes. Adult male voices are usually lower pitched and have larger folds. The male vocal folds are between 17.5 mm and 25 mm (approx 0.75” to 1.0”) in length. The female vocal folds are between 12.5 mm and 17.5 mm (approx 0.5” to 0.75”) in length.
II. SPEECH SIGNAL ACQUISATION
Signal processing of speech signal is done in the digital domain. The sound pressure wave is converted to an analog signal with the aid of a microphone or telephone handset. The resulting analog signal is filtered with an anti-aliasing filter in order to limit the signal bandwidth to approximately the Nyquist rate before sampling the signal by an analog to digital converter to obtain a digital signal. The sampling frequency used for speech processing is usually between 8 KHz and 16 KHz.
A perceptual view classifies speech containing low-level and high-low-level kinds of information. Low-low-level features are associated with spectral correlates such as formant locations and bandwidths, pitch periodicity, and segmental timings. High-level features include the perception of words and their meaning, syntax, prosody, dialect and idiolect.
It is not easy to extract stable and reliable formant features explicitly from the speech signal. In most instances it is easy to carry out short-term spectral amplitude measurements that capture low-level speaker characteristics implicitly by windowing technique of 20-30ms. Advancing the time window every 10ms enables the temporal characteristics of individual speech sounds to be tracked and 30ms analysis window is usually sufficient to provide good spectral resolution of these sounds and short enough to resolve significant temporal characteristics
III. SPEAKER REORGANIZATION
Speaker recognition is the process of automatically recognizing who is speaking based on unique characteristics contained in speech waves. This technique makes it possible to use the speaker’s voice to verify their identity and control
computers. All speaker recognition systems at the highest level contain two modules, feature extraction and feature matching. Feature extraction is the process of extracting unique information from voice data that can later be used to identify the speaker. Feature matching is the actual procedure of identifying the speaker by comparing the extracted voice data with a database of know speakers and based on this a suitable decision is made.
IV. CLASSIFICATION OF SPEAKER RECOGNIZATION
Speaker recognition can be classified into speaker identification and speaker verification. Speaker identification is the process of determining from which of the registered speakers a given utterance comes. Speaker verification is the process of accepting or rejecting the identity claimed by a speaker. Most of the applications in which voice is used to confirm the identity of a speaker are classified as speaker verification.
In the speaker identification task, a speech utterance from an unknown speaker is analyzed and compared with speech models of known speakers. The unknown speaker is identified as the speaker whose model best matches the input utterance. In speaker verification, an identity claimed by an unknown speaker, and an utterance of this unknown speaker is compared with a model for the speaker whose identity is being claimed. If the match is good enough, that is, above a threshold, the identity claim is accepted. A high threshold makes it difficult for imposters to be accepted by the system, but with the risk of falsely rejecting valid user. Conversely, a low threshold enables valid user to be accepted consistently, but with the risk of accepting imposters. To set the threshold at the desired level of customer rejection (false rejection) and imposter acceptance (false acceptance), data showing distributions of customer and imposter scores are necessary.
The fundamental difference between identification and verification is the number of decision alternatives. In identification, the number of decision alternatives is equal to the size of the population, whereas in verification there are only two choices, acceptance or rejection, regardless of the population size. Therefore, speaker identification performance decreases as the size of the population increases, whereas speaker verification performance approached a constant independent of the size of the population, unless the distribution of physical characteristics of extremely biased.
V. SPEAKER RECOGNIZATION METHODS
phoneme or syllable, it generally achieves higher recognition performance than the text-independent method.
A. Text-Independent Speaker Recognization
Basically, a wide range of possibilities exist for parametrical representing the speech signal for speaker recognition task, such as Linear Prediction Coding (LPC), Mel-Frequency Cepstral Coefficients (MFCC) and others.
B. MEL-Frequency Cepstral Coefficents
[image:3.595.312.545.68.231.2]MFCC processor is to mimic the behavior of the human ears.
Fig. 4: MEL-Frequency Cepstral Coefficents 1) Pre-Processing
Signal processing of speech signal is done in the digital domain. The sound pressure wave is converted to an analog signal with the aid of microphone or telephone handset.
This resulting analog signal is filtered with an anti-aliasing filter in order to limit the signal bandwidth to approximate the Nyquist rate before sampling the signal by an analog to digital converter to obtain a digital signal. The sampling frequency used for speech processing is usually between 8 KHz to 16 KHz.
This step processes the passing of signal through a filter which emphasizes higher frequencies. This process will increase the energy of signal at higher frequency. Let’s consider a = 0.95, which make 95% of any one sample is presumed to originate from previous sample.
𝑦[𝑛] = 𝑥[𝑛] − 0.95𝑥[𝑛 − 1]
2) Frame Blocking
Due to the quasi-stationary nature of the speech, it is processed as a series of isolated stationary signal fragment signals known as frames. In this step the sampled speech signal is blocked into frames of N samples, with adjacent frames being separated by M (M < N). The first frame consists of the first N samples. The second frame begins M samples after the first frame, and overlaps it by N-M samples. Similarly, the third frame begins 2M samples after the first frame, and this process continues until all the speech is accounted for within one or more frames. Typical values for N and M are N=256 i.e, Equivalent to 30ms windowing and M=100. Overlapping of the frames is used to smooth frame to frame transition.
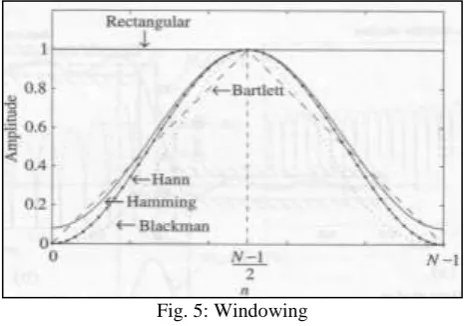
3) Windowing
A window function is a mathematical function that is zero-valued outside of some chosen interval. Applications of window functions include spectral analysis, filter design, and beam forming. Here, windowing is used to reduce spectral distortion and it ensures that all parts of the signal are recovered.
Fig. 5: Windowing 4) Fast Fourier Transformation (FFT)
The Fast Fourier Transform (FFT) is the algorithm to implement Discrete Fourier Transform (DFT) which allows significant computational saving to find frequency components of a signal in discrete time domain. Instead of being a continuous function of frequency as the Fourier Transform (FT), the DFT is a sequence of samples. Direct computation of DFT requires N 2 complex multiplication and additions, whereas the FFT reduces that number to the order of N log N. The Discrete Fourier Transform (DFT) which is defined on the set of N samples xn, is as follows
𝑥𝑛= ∑𝑁−1𝑘=0𝑥𝑛𝑒−𝑗2𝜋𝑘𝑛/𝑁 n = 0, 1, 2,..., N − 1 We use j to denote the imaginary unit, i.e. Xn is a complex number
The resulting sequence Xn is interpreted as follows:
The zero frequency corresponds to 𝑛 = 0, positive frequencies
0 < 𝑓 <Fs
2 corresponds to values 1 ≤ 𝑛 ≤ 𝑁 2-1
−Fs
2 < 𝑓 < 0 corresponds to values 𝑁
2− 1 ≤ 𝑛 ≤ 𝑁 − 1 Here, Fs denote the sampling frequency. In our project we consider only magnitude spectrum only.
5) MEL Frequency Wrapping
In psychophysical studies have shown that human perception of the frequency contents of sound for speech signals does not follow a linear scale. Thus for each tone with an actual frequency f measured in Hz, a subjective pitch is measured on a scale called the ’mel’ scale. The mel-frequency scale is linear frequency spacing below 1 KHz and a logarithmic spacing above 1 KHz. This type of scale is called Mel-scale and is given as
m = 1127.01048ln (1 + f 700) f = 700(e1127.01048m − 1)
[image:3.595.44.290.165.306.2]Fig. 6: 6) CEPSTRUM
The cepstral representation of the speech spectrum provides a good representation of the local spectral properties of the signal for the given frame analysis. Because the mel spectrum coefficients are real numbers, we can convert them to the time domain using the Discrete Cosine Transform (DCT). Therefore if we denote those mel power spectrum coefficients that are the result of the last step are Sk, k = 0, 2.K − 1, we can calculate the MFCC's, cñ as
cn
̃ = ∑kk=1[log Skcos [n(k − 1 2)
π
K]] Where n=0, 1, 2……..,K-1.
VI. PROPOSED ALGORITHM FOR RECOGNIZATION PROCESS
To verify a speaker identity, the same voice printing process is done to the incoming speech to the reference voiceprints used to construct the library. This newly attained feature vector (voiceprints) in the case is compared against those reference vectors created and stored during the training process. This procedure is known as feature matching. The most common recognition technique used is Hidden Markov Modeling (HMM).
VII. GAUSSIAN MIXTURE MODEL (GMM)
A GMM is used in speaker recognition application as a generic probabilistic model for multivariate densities capable of representing arbitrary densities, which make it well suited for unconstrained text-independent applications.
GMMs are commonly used as a parametric model of the probability distribution of continuous measurements or features in a biometric system, such as vocal-tract related spectral features in a speaker recognition system. GMM parameters are estimated from training data using the iterative Expectation Maximization (EM) algorithm or Maximum A Posteriori (MAP) estimation from a well-trained prior model. A Gaussian mixture model is a weighted sum of M component Gaussian densities given by the equation
p (x
λ) = ∑ wi M
i=1 g(x
μi, ∑i)
Where x is a D-dimensional continuous-valued data vector. wi , i = 1, ..., M, are the mixture weights, and g(x|µi ,
The GMM algorithm is one of the clustering analyses for the text-independent speaker recognition. One of the main shortcomings of the traditional clustering algorithm is the inability of determining the correct number of clusters except by trial and error.
By adopting the idea of hierarchical clustering and GMM, an adaptive clustering algorithm, i.e., AGMM that can determine the number of optimal clusters automatically has been developed. Numerical experiments demonstrate that the AGMM achieves better performance than the traditional GMM where the number of clusters is fixed.
VIII. ADAPTIVE GAUSSIAN MIXTURE MODEL
In this approach each item of the data set will be considered as a cluster, and then some of these clusters are merged into a bigger cluster. In each merge process, the error sum of squares from all the data items to their corresponding cluster center is calculated, where the distance between objects is measured by Euclidean distance, and the objective function is Error Sum of squares criterion function. Here we split the clusters are used in AGMM. In each splitting process, the cluster will be split into two using GMM which can lead to the biggest decrement of the error sum squares of clusters
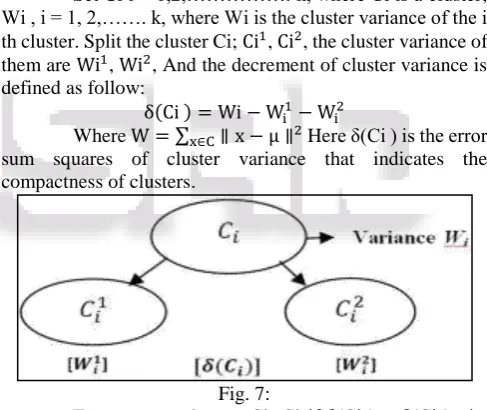
Set Ci i = 1,2,………. k, where Ci is a cluster; Wi , i = 1, 2,……. k, where Wi is the cluster variance of the i th cluster. Split the cluster Ci; Ci1, Ci2, the cluster variance of them are Wi1, Wi2, And the decrement of cluster variance is defined as follow:
δ(Ci ) = Wi − Wi1− Wi2 Where W = ∑ ∥ x − μ ∥2
[image:4.595.306.550.345.550.2]x∈C Here δ(Ci ) is the error sum squares of cluster variance that indicates the compactness of clusters.
Fig. 7:
[image:4.595.313.542.594.761.2]The basic criteria to measure the clustering effect include the divergence and the compactness which imply that the inter-cluster distance must be as large as possible, and intra-cluster distance must be as small as possible. A new index was proposed based on cluster variance.
S (K) = Max [δ (K )] − M ax[δ(K + 1)]
Where Max [δ(K )] and M ax[δ(K + 1)] are the values of the maximum error variance at K th and [K + 1]th stage of clustering respectively.
In two different modeling techniques, Gaussian Mix- ture Model (GMM) and new Adaptive Gaussian Mixture Model (AGMM), we got to know fixed clusters in GMM and how it can be rectified in AGMM.
IX. CONCLUSION
In ordered to improve the performance of text-independent speaker recognition system, this was accomplished by using new Adaptive Gaussian Mixture Model and is compared with Gaussian Mixture Model and we observed the system performed well. GMM systems has proven to be very effective for speaker recognition tasks, and the new Adaptive GMM technique is proved more efficient than GMM since the number of mixture densities are varied according to the data spread in the space in AGMM.
REFERENCES
[1] Ayaz Keerio, Bhargav Kumar Mitra, Philip Birch, Rupert Young, and Chris Chatwin, On Preprocessing of Speech Signals, World Academy of Science, Engineering and Technology 47 2008.
[2] D.A. Reynolds, T.F. Quatieri, R.B. Dunn, Speaker verification using adapted Gaus- sian mixture models, Digital Signal Processing, vol. 10, 2000, pp.19-41. [3] D.A. Reynolds, L.P. Heck, Speaker verification: from
research to reality, ICASSP Tutorial, Salt Lake City, 2001
[4] Lawrence Rabiner and Biing-Hwang Juang, Fundamental of Speech Recognition, Prentice-Hall, Englewood Cliffs, N.J., 1993.
[5] Brian Van Osdol, Cepstrum, This work is produced by The Connexions Project and licensed under the Creative Commons Attribution License.
[6] Md. Rashidul Hasan, Mustafa Jamil, Md. Golam Rabbani Md. Saifur Rahman, Speaker Identification Using Mel Frequency Cepstral Coefficients, 3rd International Conference on Electrical and Computer Engineering ICECE 2004, 28-30 December2004, Dhaka, Bangladesh.
[7] Dan Chazan, Ron Hoory, Gilad Cohen and Meir Zibulski,Speech Reconstruction from Mel Frequency Cepstral Coefficients and Pitch Frequency, IBM Research Lab- oratory in Haifa MATAM Haifa 31905, ISRAEL.
[8] Reynolds, Douglas Alan, A Gaussian Mixture Modeling Approach To Text- Independent Speaker Identification, PhD thesis, Georgia Institute Of Technology, Sept.1992. [9] G. Suvarna Kumar. Speaker Recognition using GMM, International Journal of Engineering Science and Technology Vol. 2(6), 2010, 2428-2436.
[10]D. Reynolds, R. Rose, Robust text-independent speaker identification using Gaussian mixture speaker models, IEEE Trans. Speech Audio Process., vol. 3, no.1, pp. 72-83, January, 1995.
[11]Zhehui Liang, Pingjian Zhang, Juanjuan Zhao, Optimization of the Number of Clusters in Fuzzy Clustering, Int. Conf. on Computer Design And Applications (IC- CDA 2010), Vol. 3, pp. 580-584. [12]Jiucang Hao; Te-Won Lee; Sejnowski, T.J.; Speech
Enhancement Using Gaussian Scale Mixture Models Audio, Speech, and Language Processing, IEEE Transactions on Volume: 18, Issue: 6, Digital Object Identifier: 10.1109/TASL.2009.2030012 Publication Year: 2010, Page(s): 1127 – 1136.