A Combined Algorithm for Layout Analysis of Arabic
Document Images and Text Lines Extraction
Abdulrahman Alshameri
Faculty of Computers and
Information
Cairo University
Sherif Abdou
Faculty of Computers and
Information
Cairo University
Khaled Mostafa
Faculty of Computers and
Information
Cairo University
ABSTRACT
Text and not -text segmentation and text line extraction from document images are the most challenging problems of information indexing of Arabic document images such as books, technical articles, business letters and faxes in order to successfully process them in systems such as OCR. Researches on Arabic language related to documents digitization have been focusing on word and handwriting recognition. Few approaches have been proposed for layout analysis for Arabic scanned/captured documents. In this paper we present a page segmentation method that deals with the complexity of the Arabic language characteristics and fonts using the combination between two algorithms. The first method is the Run length Smoothing. The second method is the Connected Component Labeling algorithm for text and non-text classification using SVM. The combination of the two methods is based on Anding and Oring operations between the outputs of the two methods based on certain conditions. Then, dynamic horizontal projection based on dynamic updating of the threshold to commensurate with the noise associated with different documents and in between text lines. The performance evaluation is performed using manually generated ground truth representations from a dataset of Arabic document images captured using cameras and a hardware built for this purpose. Evaluation and experimental results demonstrate that the proposed text extraction method is independent from different document size, text size, font, shape, and is robust to Arabic document segmentation and text lines extraction.
General Terms
Image processing, Pattern Recognition.
Keywords
Arabic document layout analysis, Arabic text line extraction,
1.
INTRODUCTION
Arabic language is the official language of 24 countries and it is spoken by almost more than 422 million people. The Arabic alphabet contains 28 letters, words are written in horizontal lines from right to left. Moreover, Arabic books and documents are written using different font's types and styles. The recent researches on Arabic language related to documents digitization has been focusing on word and handwriting recognition [1], and neglecting the layout analysis of Arabic documents relaying on methods proposed for documents of other languages such as Latin and English. Correct document layout analysis is a key step of the conversion of captured or scanned documents into electronic formats, optical character recognition (OCR), reformatting of documents for on-screen display. Moreover, the performance of any further layout processing is totally depends on the text and non-text segmentation.
The x-y cut [7], whitespace analysis [8], the constrained text line finding [9], Docstrum [10], and the Voronoi-diagram based approach [11] have been evaluated in Kumar et al. [5] for page segmentation on Nastaliq script. However, the letters in Nastaliq are similar to those in Arabic but, there is a huge difference in styles of fonts between the two scripts. These algorithms work very well for segmenting documents in Latin as shown in [12]. Nevertheless, all these methods performed badly on Arabic script with a very low accuracy according to Bukhari [6]. Shafait et al. [13] adapted RAST [14] for text line extraction on Urdu documents. Text-line extraction of handwritten Arabic documents presented in [15] is considered the best methodology dealt with Arabic scripts in the domain of handwriting only. However, all the listed approaches do not take into account the different characteristics of Arabic scripts and the variety of font's size, shape, and styles in different kinds of documents instead , they relay on the similarity of Arabic language with other languages such as Urdu . In this paper we present a page segmentation method that deals with the complexity of the Arabic language characteristics and fonts using the combination between two algorithms. The first method is the Run Length Smoothing (RLS) [2], which can achieve high detection rate for the text segments but tends to merge the detected areas . The second method is the Connected Component Labeling algorithm for text and non text classification using SVM (CCL_SVM) [3] , which avoids the merging effect but suffers from high splitting and insertion rates for new text segments. In this paper we introduce a combination approach for the two methods that achieves superior performance than using either one of them separately. The combination of the two methods is based on AND and OR operations between the outputs of the two methods according to certain conditions followed by dynamic horizontal projection with dynamic updating of the threshold to commensurate with the noise associated with different documents and within text lines.
In the following sections, section 2 addresses the challenges of text lines extraction from Arabic document images. Sections 3 and 4 describe the RLSA and the CCL_SVM methods in details, and section 5 presents the combination approach between the two methods. In section 6 we present our experimental results on Arabic documents from different sources, finally section 7 presents the conclusion and future work.
2.
PROBLEMS OF ARABIC TEXT
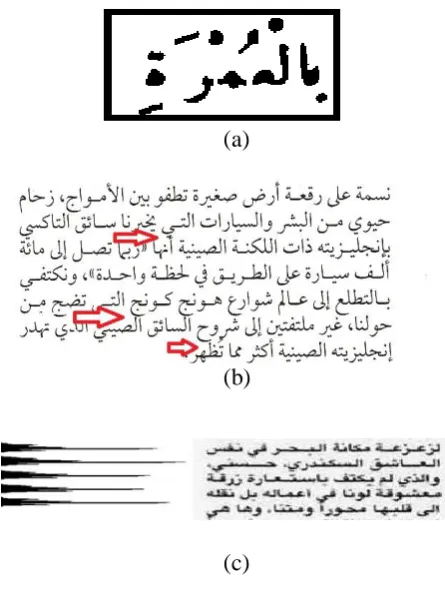
and inter-word spacing, as shown in figure 1 (b), are very small. Tall ascenders and descenders that penetrate into adjacent text-lines, which are illustrated by the projection profiles in figure 1 (c), show that inter-line spaces are too small to be manipulated. The problem of inter-line space makes obtaining each text line separated from the others a hard task.
(a)
(b)
(c)
Figure 1: (a) Problem of dots and punctuations in Arabic Script, (b) problem of inter-line space between Arabic text lines, (c) Inter line space from histogram perspective
Words in Arabic scripts are written from right to left. Letters in words are written in different styles according to the position of the letter. Moreover, the styles of Arabic fonts are usually thinner than other languages which make it more sensitive to the binarization at the preprocessing phase. All these challenges for the Arabic language affect the accuracy of layout analysis and text extraction methods when applied for Arabic document images.
3.
RULE BASED SEGMENTATION
BASED ON RLSA
The run-length smearing algorithm (RLSA) works on binary images where the data in images is represented in terms of 0’s for white pixels and 1’s for Black pixels [2]. The algorithm transforms a binary sequence x into y according to the following rules:
a. 0’s in x become 1’s in y if the number of adjacent 0’s is less than or equal to specific threshold C.
b. 1’s in x stay 1’s in y.
All neighboring black areas separated by less than C pixels are linked together. The binary images are processed by the RLSA in two ways, row-wise using a threshold C_h, and
column-wise using threshold C_v, process any binary image produce two distinct bitmap. These two bitmaps are combined using logical AND operation. Then connected component analysis is used to compute the following measurements:
Total number of black pixels in a segmented block (BC). Minimum x-y coordinates of a block and its x, y lengths (Xmin, Ymin, delX, delY).
Total number of black pixels in original data from the block (DC).
Horizontal white-black transitions of original data (TC). The measurements computed above are used to calculate the following features:
1. The height of each block segment:
2. The eccentricity of the rectangle surrounding the block:
3. The ratio of the number of block pixels to the area of the surrounding rectangle:
If S is close to one, the block segment is approximately rectangular.
4. The mean horizontal length of the black runs of the original data from each block:
The mean value of block height ( , and the block mean black pixel run length ), for the text cluster may vary for different types of documents, depending on character size and font. Furthermore, the text cluster’s standard deviations sigma ( ) and sigma ( ) may also vary depending on whether a document is in a single font or multiple fonts and character sizes [2]. Finally, connected components are classified as a text if:
and
And classified as images if:
and
[image:2.595.55.278.153.448.2](a) (b) (c)
(d) (e)
Figure 2: (a) The original document Image. (b) and (c) The output of Horizontal and vertical RLSA . (d) ANDing between (b) and (c). (e) The region of document which classified as text.
[image:3.595.101.249.69.225.2]Table 1 shows the selected values of RLSA Parameters that we used for this work. The values of C_h , C_v ,C_1, C_2 and C_3 have been chosen based on number of test documents, and the outlined method has been tested on a number of test documents with satisfactory performance.
Table 1. RLSA Parameters
RLSA Parameter Value
C_h 150
C_v 200
C_1 2
C_2 2
C_3 4
4.
CONNECTED
COMPONENT
LABELING AND SUPPORT VECTOR
MACHINE (CCL_SVM)
Connected components labeling groups image pixels into areas based on pixel connectivity. All pixels in a connected component have the same pixel intensity values and are connected with each other. Once all areas have been determined, each group of pixels is labeled with bounding box in order to extract the features of each box before the classification of these blocks of pixels into text or non-text using support vector machine classifier.
4.1
Connected Component labeling
After applying preprocessing techniques to the selected document using median filter and Otsu binarization[4], the initial blocks are identified using the Connected Component analysis. As shown in figure 3 (b), the initial bounding boxes of text regions for the dots and punctuations are apart from the word stem. In order to include the word with its dots and punctuations in one bounding box, the most common height of the connected components is calculated, in the next step each connected component is expanded [3] as shown in figure 3 (c) as follows:
Calculate the average height of bounding boxes.
Increment the width of the bounding boxes by a value equal to average height of bounding boxes.
Finally, the overlapped connected components are merged and lines / words are located as shown in figure 3 (d).
(a) (b)
(c) (d)
Figure 3: The Expansion and Merging of Connected Components step.
4.2
Feature Extraction of the Blocks
After the localization of the regions each one is classified as text or non-text region. The features are extracted for each block surrounded by a bounding box. The Features are a set of Document Structure Elements (DSEs) as shown in figure 4 (a). The DSE is any 3x3 binary block; therefore there are total DSEs. The L0 and L511 DSEs are removed because they correspond to background and document objects, respectively [3].
(a)
(b)
Figure 4: (a) The Pixel Order of the DSEs, (b) Some of the DSEs used to calculate the features
64 out of 510 DSEs are selected as training vector to the support vector machine based on the analysis of histogram of training text blocks and non-text blocks according to the following steps:
Finding the Standard Deviation for the Text Blocks SDXT(Ln) for each Ln DSE
[image:3.595.318.530.77.243.2] [image:3.595.60.279.357.495.2] [image:3.595.327.539.398.605.2]Normalize them
Defining the O(Ln) vector as : O(Ln)=|SDXT´ (Ln) – SDXP´(Ln)|
Finally, taking those 64 DSEs that correspond to the first 32 maximum values and 32 minimum values of O(Ln)
The goal is to find those DSEs that have maximum standard deviation at the text blocks and minimum standard deviation at the non text blocks. This feature vector that consists of 64 elements is used to train a Support Vector Machines based classifier. We have selected ten documents from the dataset to train that classifier. In this work we used LIBSVM toolkit to train our SVM classifier [16]. Figure 5 shows the steps of the CCL_SVM approach for a sample document.
(a) (b)
(b) (d)
(e)
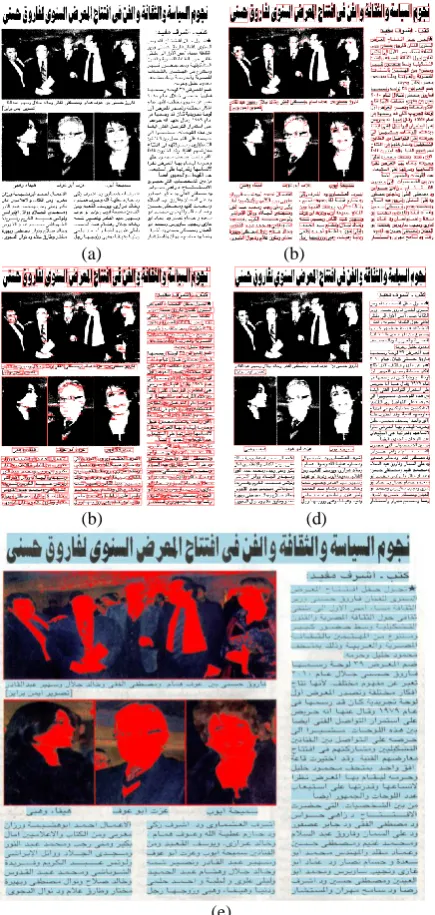
Figure 5: (a) binary image, (b) Initial bounding boxes produced by connected component, (c) expanded width of boxes with average height , (d) Merged boxes before the classification step, (e) final image text is marked with blue and non-text is marked with red.
5.
THE COMBINATION METHOD
Due to the complex characteristics of Arabic language the well-known document layout analysis and text lines extraction approaches achieve very low accuracy on Arabic documents [6]. Consequently, the idea of combining more than one algorithm is an essential to enhance the accuracy of Arabic document segmentation; In this study, the combination between two text extraction approaches is based on both logical AND and OR Operations between two text extraction approaches. The first approach is rule based document segmentation with RLSA [2]. The second approach is classifier based document segmentation based on support vector machine [3]. The document is processed by the two algorithms separately, then the results are combined together producing one output. In order to determine which operation to be performed, the following measurements are taken:
The height of each text block bounding box ( ).
The average height of text blocks bounding boxes ( ). The number of inner bounding boxes (C).
Minimum and maximum Y coordinates of inner bounding boxes (Ymin, , Ymax).
Anding operation is performed if:
o C is grater then 1 and , ( – ) and ( – ) of two inner bounding boxes is greater then , where i and j is any two adjacent inner boxes.
Otherwise Oring operation is performed between the outputs of the two methods.
To improve the performance of the combined method, a dynamic horizontal projection is applied using dynamic threshold created based on the histogram profile of the processed document. Detail of the two operations and dynamic projection, is described in the next three sections
.
5.1
ANDing Operation
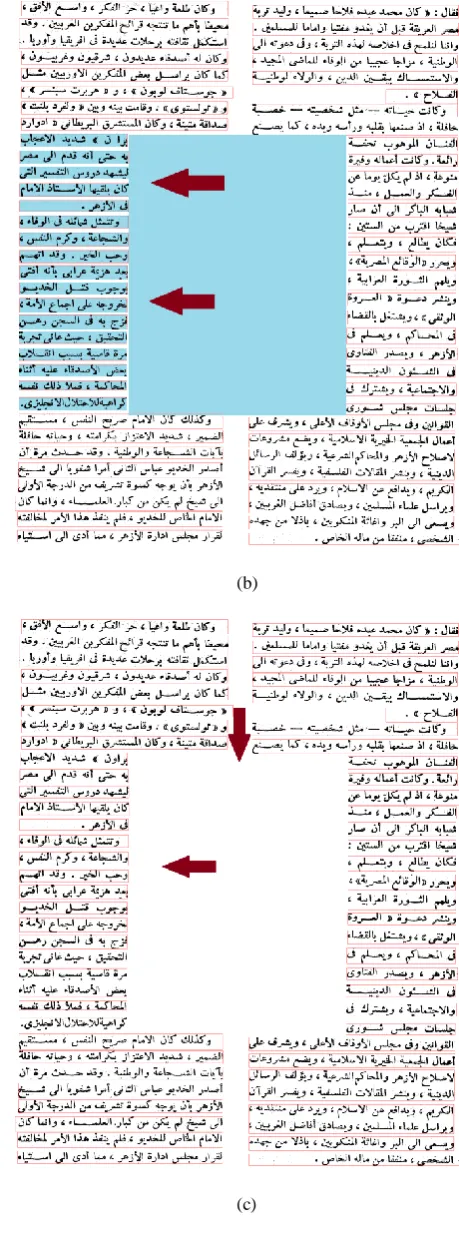
[image:4.595.56.274.240.698.2]by inner boxes are recalculated and processed by the second method to insure that it is classified correctly.
5.2
ORing Operation
Fonts of Arabic documents vary in size and shape from one document to another. This variation makes it difficult to set the parameters of the preprocessing techniques to be perfect for all size and shapes of Arabic fonts (( C_v and C_h) in first method and expansion parameter in second method).
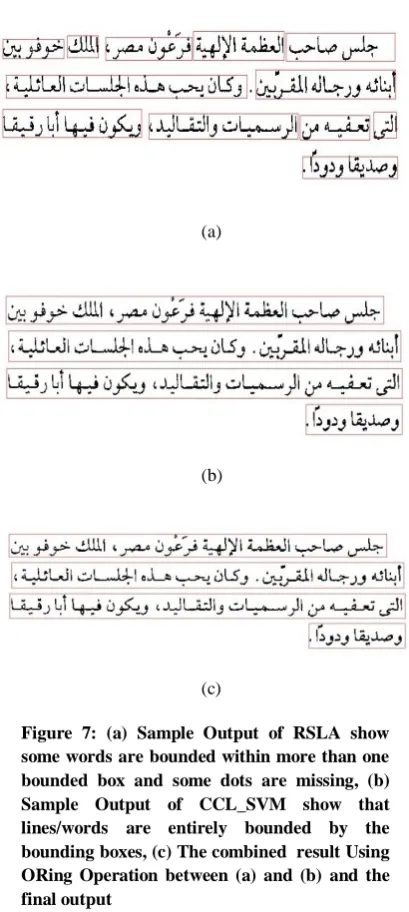
The bounding boxes produced by the connected component are depending on how much the text is linked to each other in the preprocessing step. As shown in figure 7, (a) some words are bounded with more than one bounding box. In order to select the best bounding box for each word or line we apply the ORing operation that guarantee the selection of the bounding boxes, which bounds text lines and word with its dots and punctuations. Moreover, this operation discards the inner and small bounding boxes as shown in figure 7 (c). One more advantage of the Oring operation for the RLSA method, which suffers from high misdetection rate, is when a text line is misdirected by this method and detected correctly by the CCL_SVM method, Oring operation guarantee that this text line will appear as correctly detected at the final output after the methods combination.
(a)
(b)
(c)
[image:5.595.310.540.73.690.2](a)
(b)
(c)
Figure 7: (a) Sample Output of RSLA show some words are bounded within more than one bounded box and some dots are missing, (b) Sample Output of CCL_SVM show that lines/words are entirely bounded by the bounding boxes, (c) The combined result Using ORing Operation between (a) and (b) and the final output
5.3
Dynamic Horizontal Projection
Performing projection on any document to insure that each bounding box surround only one text line needs to determine the threshold previously, but the intensity of noise vary from one document to another. In layout analysis we process all types of documents, both noisy and clear documents. Setting the threshold value equal to zero makes the projection useless in case of noisy documents. In our method, the threshold value is not fixed, but it varies dynamically depending upon the noise between the text lines and the intensity of noise of documents [17]. As soon as we obtain valleys in the profiles we segment the bounding box that contains more than one text line based on the minimal value of the profile. In order to find the minimal value of the threshold we perform the following steps:
Compute the histogram.
If there are two maxima, and there is only one local minimum between those maxima, we found the valley. Set the value of threshold to the local minimum.
6.
EVALUATION RESULTS
Performance evaluation of layout analysis and text line extraction algorithms needs a performance metrics, ground truth data and algorithm to match the automatic detected objects produced by the developed methods with the ground truth representation.
So far, there is no dataset for Arabic documents with its ground truth representation to be used to test the performance of Arabic layout analysis and Arabic text extraction methods. The evaluation of these methods on the available datasets of other languages such as English documents will not evaluate their performance precisely. In order to test the performance of our method we created a dataset of 200 Arabic documents that consists of documents with variety of complex single and multi-column layouts. The document's resolution is between 640x480 and 3264x2448. We manually created accurate ground-truth representation for 5o documents of this dataset that included 1768 entities. This ground truth is used as the test bed for our method.
The evaluation of our method is presented via the analysis of the area of intersection between the automatic detected regions with the ground truth representation and in terms of recall and precision [19, 18]. Suppose that the ground truth entities are given as G = and the automatic detected blocks produced by our method as D = the comparison of G and D is made in terms of the following measures:
And
Where 1 < i < M, 1 < j < N and is the intersection area of the ground truth and the automatic detected zone. The results of the two measures are analyzed to determine five metrics for our method: correct, splitting, merging, missing, and false alarm detections [19].
The automatic detected zone is considered;
Correct Detection if : 1 or 1
Misdetection if: 0, this means that there is in G and not detected by our method.
False Alarm if: 0, this means that our method detect an object which is not exists in G. Splitting Detection if: our method detect an object
but produce more than object for , the < 1 for all j and .
Merging detection if: our method detects an object its corresponding is more than one in G, then
< 1 for all i and .
[image:6.595.66.271.67.524.2]Table 2: The Evaluation Results
Method
Metric
RLSA CCL_SVM Combined Method
Correct 1466 (82.9%)
1439 (81.4%)
1687 (95.4%)
Splitting 126 (7.1%)
33 (1.9%)
34 (1.9%)
Merging 38 (2.1%)
245 (13.8%)
26 (1.4%)
Missing 138 (7.8%)
51 (2.9%)
21 (1.2%) The results in table (2) show that our proposed combination approach managed to achieve better results than each of the two approaches of RLAS and CCL_SVM when used separately. In addition, results show that RLSA has low tendency to merge blocks but, suffers from high splitting and missing rates. On the other hand, though the CCL_SVM approach has low splitting and missing rates, it has a high tendency to merge blocks. The detection rate for the two approaches is very close, 82.9% and 81.4%. When they combined together we managed to get the advantage of each approach and avoid its weakness to get a combined detection rate of 95.4%.
During the verification of automatic detected object boxes produced by our method with the ground truth representations, the evaluation reports some boxes with shrinking areas compared to the ground truth boxes areas. In order to take into account the shrinking areas of localized objects we apply another evaluation measures called recall and precision [18].
Recall rate: when a text box is totally missed, it is calculated as -1 from total number of text boxes. When the text box is shrunk, the missed percentage is substituted from the total number of text boxes.
Precision: when a false alarm exists, it is added to the correct detects. When splitting or merging is detected the total number of splitting and merging detections is added to the correct detects.
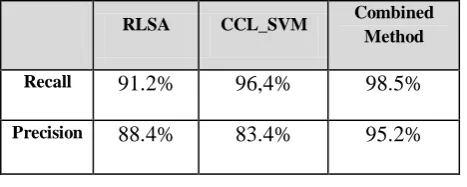
Table 3: Recall and Precision Results
From the results shown in table (3), we can see that the RLSA and CCL_SVM approaches have acceptable detection rates and low precision rates. The low precision rate of RLSA comes from the high variation of the size of document images
and sizes and shapes of different Arabic fonts in Arabic documents. The localization of text lines and non-text objects vary based on the thresholds and parameters selected for the RLSA approach. On the other hand, the low precision of the CCL_SVM method is occurred because the text localization is based on the expansion and merging of bounding boxes of connected component blocks. The operation of text localization makes more than two regions merged in one region according to the document and font size. The combination using the ORing operation reduced the splitting detections by (7.1%) and missing detections by (9.5%) whereas, the ANDing operation and dynamic horizontal projection reduced the merged text lines detections by (14.5%), However, there are still some merged text lines because. the projection fails to find the local minimal of the histogram due to the skewed appearance in some parts of the test documents.
7.
CONCLUSION AND FUTURE WORK
In this paper, a hybrid method for Arabic Document Layout Analysis is presented. This method is based on the combination between two algorithms, rule based algorithm (RLSA) and SVM based algorithm using ANDing and ORing operations. Moreover, a dynamic horizontal projection is applied to the result based on dynamic threshold. A testing dataset that consist of 50 documents with variety of complex single- and multi-column layouts was created with its ground truth representation and developed a tool to compare the automatic detected blocks with the ground truth. Evaluation results demonstrate that the proposed algorithm achieved significantly better performance for the localization of the text blocks in the documents images compared with the performance of the RLSA and CCL_SVM approaches when used separately. In addition, this superior performance is independent from the documents size, the text size and the font shape.
Currently we are expanding our test set to include larger set of documents with different layouts, font shapes and sizes. Availing this type of test set would promote the research efforts for Arabic documents analysis and text extraction applications.
8.
REFERENCES
[1] H. E. Abed and V. M¨argner, “ICDAR 2009-Arabic handwriting recognition competition,” Int. Journal on Document Analysis and Recognition, vol. 14, pp. 3–13, 2011.
[2] K.Y. Wong, R.G. Casey and F.M. Wahl, "Docuinent analysis system," IBM J. Res. Devel., Vol. 26, NO. 6,111). 647-656, 1982. .
[3] K Zagoris, N Papamarkos, Text Extraction Using Document Structure Features And Support Vector Machines, in Proceedings of the 11th IASTED International Conference on Computer Graphics and Imaging, (2010)
[4] N.Otsu, “A threshold selection method from gray-level histograms”, IEEE Trans. Systems, Man, and Cybernetics, 1979, 9, pp. 62-66.
[5] K. S. Kumar, S. Kumar, and C. Jawahar, “On segmentation of documents in complex scripts,” in 9th Int. Conf. on Document Analysis and Recognition, Brazil, Sep. 2007, pp. 1243–1247.
RLSA CCL_SVM Combined Method
Recall
91.2%
96,4%
98.5%
[image:7.595.48.282.610.703.2][6] Bukhari, S.S.; Shafait, F.; Breuel, T.M.; , "High Performance Layout Analysis of Arabic and Urdu Document Images," Document Analysis and Recognition (ICDAR), 2011 International Conference on , vol., no., pp.1275-1279, 18-21 Sept. 2011
[7] G. Nagy, S. Seth, and M. Viswanathan, “A prototype document image analysis system for technical journals,” Computer, vol. 7, no. 25, pp. 10–22, 1992.
[8] H.S. Baird, “Background structure in document images,” inDocument Image Analysis, H. Bunke, P. Wang, and H. S.Baird, Eds. World Scientific, Singapore, 1994, pp. 17– 34.
[9] T. M. Breuel, “Two geometric algorithms for layout analysis,”in Proc. Workshop on Document Analysis Systems, Princeton,NY, USA, Aug. 2002, pp. 188–199. [10] L. O’Gorman, “The document spectrum for page layout
analysis,” IEEE TPAMI, vol. 15, no. 11, pp. 1162–1173, 1993.
[11] K. Kise, A. Sato, and M. Iwata, “Segmentation of page images using the area Voronoi diagram,” Computer vision and Image Understanding, vol. 70, no. 3, pp. 370– 382, 1998.
[12] F. Shafait, D. Keysers, and T. M. Breuel, “Performance evaluation and benchmarking of six page segmentation algorithms,”IEEE TPAMI, vol. 30, no. 6, 2008.
[13] F. Shafait, A. Hasan, D. Keysers, and T. M. Breuel, “Layout analysis of Urdu document images,” in 10th
IEEE Int. Multitopic Conference, INMIC’06, Islamabad, Pakistan, Dec. 2006.
[14] T. M. Breuel, “Two geometric algorithms for layout analysis,”in Proc. Workshop on Document Analysis Systems, Princeton, NY, USA, Aug. 2002, pp. 188–199. [15] W. Boussellaa, A. Zahour, H. E. Abed, A.
Benabdelhafid, andA. M. Alimi, “Unsupervised block covering analysis for textline segmentation of arabic ancient handwritten document images,” in ICPR, Istanbul, Turkey, 2010, pp. 1929–1932.
[16] Chih-Chung Chang, and Chih-Jen Lin, LIBSVM : a library for support vector machines,Software available at http://www.csie.ntu.edu.tw/~cjlin/libsvm, 2001.
[17] P.Shivakumara, G. Hemantha Kumar, D. S Guru, P. Nagabhushan ,Skew Estimation of Binary Document Images Using Static and Dynamic Thresholds Useful for Document Image Mosaicing. National Workshop on IT Services and Applications (WITSA2003) Feb 27-28, 2003.
[18] Effective Text Extraction from Video Scenes. E. H. Shaheen,K. M. El Sayed,S. H. Ahmed,,,. p119-p134. Genetic Programming Scheme for Optimizing Register Allocation.