Munich Personal RePEc Archive
Student Study Choices in the Principles
of Economics: A Case Study of
Computer Usage
Grimes, Paul W. and Sanderson, Patricia L. and Ching,
Geok H.
Mississippi State University, Mississippi State University, Mississippi
State University
July 1996
Online at
https://mpra.ub.uni-muenchen.de/63265/
STUDENT STUDY CHOICES IN THE PRINCIPLES OF ECONOMICS:
A CASE STUDY OF COMPUTER USAGE
ABSTRACT
Principles of Economics students at Mississippi State University were provided the opportunity to use computer assisted instruction (CAI) as a supplemental study activity. Students were free to choose the extent of their computer work. Throughout the course, weekly surveys were conducted to monitor the time each student spent with their textbook, computerized tutorials, workbook, class notes, and study groups. The surveys indicated that only a minority of the students actively pursued CAI. Probit and OLS models were estimated to identify the factors which determined the probability of computer use and the mean weekly time spent in CAI. The results indicated that black students spent significantly less time engaged in CAI but older students spent more time with the computer. Students with greater physical access to computers and students who had taken a formal course in computer operations spent more time each week in CAI. Further, students who highly rated the importance of CAI to their learning were more likely to be computer users and spend more time on task. The impact of CAI on student performance was estimated within the context of a "treatment effects" model which controlled for the self-selection of students into two categories of computer users. The results indicated that CAI did significantly improve end-of-course test performance, holding all else constant. Given the negligible use of CAI, the authors conclude that students failed to perceive the expected return to computer time or were willing to bear the opportunity cost of pursuing other study activities.
Note: This is the final draft of the following article subsequently published as: “Student Study Choices in the Principles of Economics: A Case Study of Computer Usage.” Journal of Educational Computing Research, Vol. 16, No. 1, 1997, pp. 65-81.
STUDENT STUDY CHOICES IN THE PRINCIPLES OF ECONOMICS:
A CASE STUDY OF COMPUTER USAGE
Paul W. Grimes Professor of Economics
Patricia L. Sanderson Associate Professor of Economics
Geok H. Ching
Doctoral Assistant in Economics
All Authors:
College of Business and Industry Mississippi State University 326 McCool Hall - Box 9580 Mississippi State, MS 39762-9580
July 1996
Draft - Not for Quotation
An earlier version of this paper was presented at the annual meetings of the Allied Social Sciences Association. The authors extend their appreciation to Keith Smith and Steve Canfield of the MSU COBI Computer Services Center and the Principles of Economics students who participated in this study. Valuable comments were provided by George Chressanthis and Charles Register.
STUDENT STUDY CHOICES IN THE PRINCIPLES OF ECONOMICS:
A CASE STUDY OF COMPUTER USAGE
Today the microcomputer is a common feature in many college economics classrooms. The
advent of powerful inexpensive hardware and the growing availability of computer assisted instruction
(CAI) software tailored for specific textbooks and courses have made the microcomputer a popular
teaching tool. Several recent studies have examined the effects of microcomputer usage on student
outcomes in Principles of Economics courses. A review of this literature by Grimes and Ray [6]
indicates that CAI is often found to increase student learning. The evidence to date suggests that
computerized simulations may be more effective than computerized tutorials and that CAI in general is
most effective for students at either end of the grade distribution. This latter conclusion is very
important given that all previous studies have examined CAI when it is used in a formal classroom
setting (e.g. a laboratory or as specific class assignments). Even though some departments have
restructured their curriculum [1] or developed laboratory courses [10] which integrate CAI into the
classroom, there is a growing trend for students to have access to CAI software in unstructured study
environments. CAI software is often made available to students through local area networks or
through diskettes bundled with textbooks. At many schools, instructors do not require CAI as part of
their coursework but make it available to students as an optional study aid. In such situations, the
extent of CAI is determined by the student who chooses to use the computer from a portfolio of study
activities including more traditional learning aids such as workbooks and study groups.
This case study first examines which students choose to use CAI materials when they are readily
available as a learning aid but not a structured part of their course assignments. What characteristics
influence a student's choice to utilize CAI relative to more traditional study activities? Are the students
who are expected to benefit the most from CAI voluntarily using it? Secondly, this case study analyzes
the effect of choosing CAI on student understanding of course material. Is time on the computer
equivalent to time spent with a workbook or in a study group? Obviously, these issues are important
to economic educators who must determine how the microcomputer should be used in the college
classroom.
THE SETTING AND ANALYSIS DESIGN
This study was conducted at Mississippi State University (MSU). As a public Land Grant
institution, MSU's student body is diverse representing all fifty states and several foreign nations.
Total enrollment is approximately 14,000. The average ACT score for first-year students is 22.5. MSU
offers the traditional Principles of Economics two-course sequence through the College of Business and
Industry. All Principles of Economics students have access to a variety of textbook-based CAI programs
through the College of Business and Industry Local Area Network (COBI-LAN). Most student use of the
COBI-LAN occurs in standard multi-station laboratory settings or in an "electronic classroom"
environment. The primary computer laboratory is available as a "walk-in" study area for extended
hours each day of the semester. All software on the COBI-LAN operates under DOS or WINDOWS.
Two regular semester sections of the Principles of Macroeconomics (EC 2123) participated in
this study. Both sections were taught by the same instructor who used the same textbook, course
syllabus, and grading procedures in each class. Classroom lectures were held at similar times of day.
At the beginning of the semester, each student was provided with a detailed handout describing the
Principles of Economics CAI software available on the COBI-LAN. Students also received an extended
set of instructions on how to use their textbook's CAI tutorial.1 However, students were not required
to use the CAI software or to complete computer assignments. Use of the computer was left as an
individual and voluntary decision.
Each week throughout the semester students were asked to complete a brief survey concerning
their time spent studying and preparing for class. This survey was conducted in-class the same day of
each week. Absent students were contacted and completed the survey by phone. All students were
asked to indicate the number of hours during the previous week they spent engaged in five types of
study activities for the course:2 1) reading the textbook, 2) using the computerized tutorials, 3) using the
workbook, 4) reviewing class notes, and 5) studying with someone else or in a group. Regular reading
assignments from the textbook were made by the instructor throughout the semester but students
were free to choose which additional study activities to pursue.
Demographic information about each student was collected at the beginning of the semester
from questionnaires and official school records. In addition, all students were pre- and post-course
tested with the Test of Understanding in College Economics, Third Edition (TUCE) [11]. Finally, at the
end of the course students completed a questionnaire concerning their course experiences and
attitudes toward the various study activities. (Copies of the course syllabus, study time survey, and
questionnaires are available upon request from the authors.)
The data taken from the survey instruments reveal information about the characteristics of
Principles of Economics students who chose to use CAI. Further, the TUCE data provide a means to
measure the cognitive impact of CAI on students who self-select this form of study activity. Statistical
analyzes of these data are outlined and discussed in the following sections.
STUDY TIME AND COMPUTER USAGE
Data from the study time surveys were used to calculate the average number of hours per week
each student spent engaged in the various study activities over the course of the semester. The
averages were calculated for all students in the final sample and by degree of voluntary computer
usage.3 The upper portion of Table 1 reports the mean weekly hours, by study activity category, for all
students in the sample, all Non-Users, all Users, and all "Heavy Users." A User is defined as any
student who reported study time on the computer during at least one week of the semester. Heavy
Users are the subset of all Users whose time on the computer exceeded the mean user time.
As indicated in Table 1, only 19.79 percent of the students in the sample took advantage of the
CAI materials available to them. And only 6.25 percent could be classified as Heavy Users of the
computer. Thus, students who voluntarily chose to use the computer represented a minority of the
class. Time on the computer for all Users averaged only .12 hours (7 minutes) per week. Heavy Users
averaged .28 hours (17 minutes) per week.4 Work with the computer accounted for 4.78 percent of
total study time for all Users and 8.97 percent of total study time for Heavy Users. The relatively slight
incidence and degree of computer usage occurred even though students had been briefed on the
benefits of CAI, provided with detailed instructions and easy access, and had agreed to participate in a
research project which focused on study behavior. Apparently, voluntary CAI activity depends on more
than just encouragement and opportunity.
--- Insert Table 1 About Here ---
Table 1 suggests that computer users may employ CAI as a complement to other study activity
and not as a substitute. Simple t-tests revealed no statistically significant difference between the
weekly mean study times of computer Users and Non-Users for time with the textbook, workbook, class
notes, or groups. Also, Heavy Users of the computer appear to have studied slightly more on average
than Non-Users, in total. A t-test reveals that the mean total weekly study time for Heavy Users (3.11
hours) is significantly greater than that of Non-Users (2.19 hours) at the .10 level of confidence (t-value =
1.69). Thus, serious users of the computer apparently studied for longer periods of time each week
than those who chose not to utilize CAI.
It is clear that the textbook was the preferred study activity for each group. Textbooks are the
traditional medium for delivery of detailed and sophisticated information. Given that students in the
sample were asked each week to read selections from their text, it is not surprising that the mean time
spent with the textbook was significantly greater than time spent in other forms of study pursuits for all
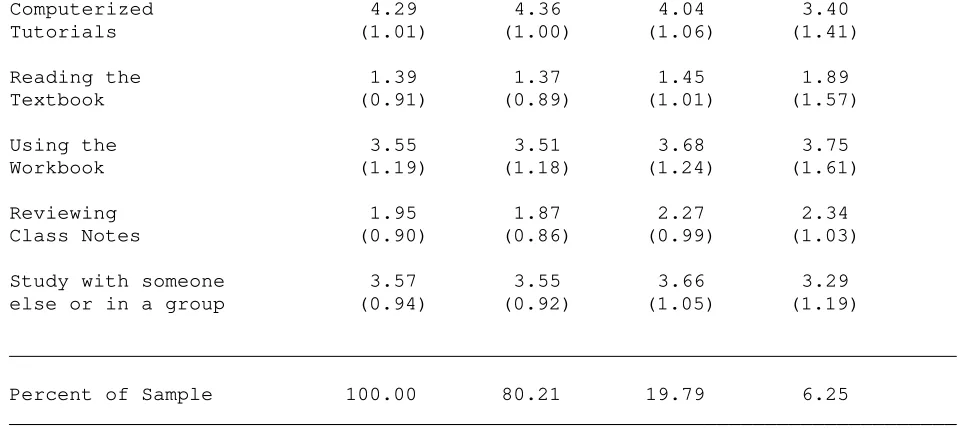
groups. When asked to evaluate the importance of each study activity, each group of students gave
"Reading the Textbook" the highest rating. Class notes were also highly valued by each student group.
The relative ratings for the study activities are reported in the lower portion of Table 1.
The computer received the lowest importance rating from all the student groups, including the
Heavy Users of CAI. Not surprisingly, however, Users and Heavy Users did rate the computerized
tutorials higher than the Non-Users. The low importance ratings and the relatively negligible overall
utilization of the computer suggests that CAI was not a popular study activity for the average student in
the sample. To identify what factors determine voluntary computer usage additional analysis of the
data was performed.
THE DETERMINANTS OF COMPUTER USAGE
The voluntary use of CAI as a study activity in the Principles of Economics was assumed to be a
function of a student's human capital attributes, personal characteristics, computer access and attitude
toward computerized tutorials. These factors were viewed as the major determinants of an individual
student's demand for computerized instruction. Using data collected from the instruments described
above, four specifications of the following regression model were estimated:
CAI = α + β1PRE TUCE + β2PRIOR ECONOMICS + β3ACT + β4GPA + β5STUDY + β6GENDER + β7BLACK +
β8AGE + β9MAJOR + β10PRIOR COMPUTER + β11ACCESS + β12IMPORTANCE + ε (1)
OLS and tobit estimations of the equation were calculated using the mean weekly hours of computer
study time as the dependent CAI variable (COMPUTER TIME). The tobit specification was estimated to
control for the natural truncation of the sample due to the significant number of students reporting zero
hours. Two probit estimations were also calculated with dependent categorical variables identifying
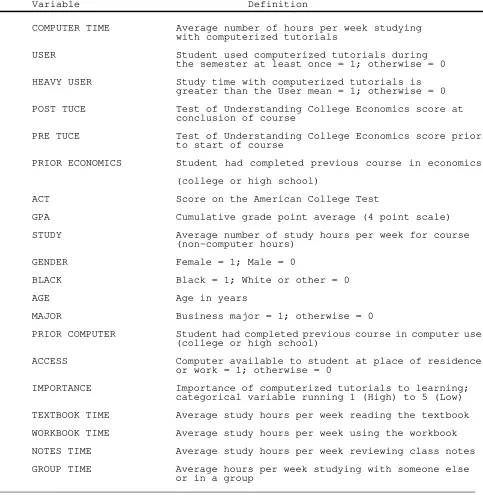
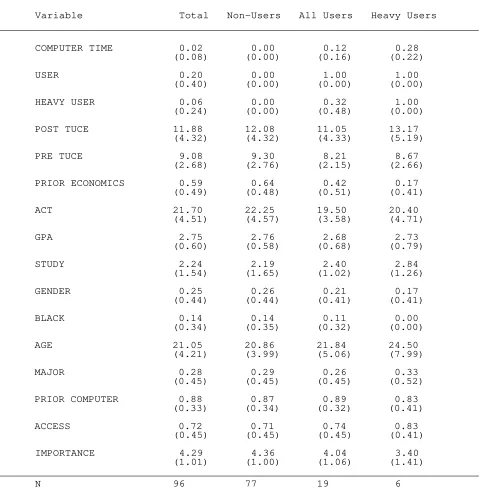
USERS and HEAVY USERS. The operational definition of each variable is reported in Table 2. Table 3
reports the mean and standard deviation of each variable for the total sample and by computer usage
groups.
--- Insert Tables 2 and 3 About Here ---
PRE TUCE and PRIOR ECONOMICS enter the model to control for a student's specific economics
human capital. Students with lower levels of economics understanding and experience studying
economics were expected to pursue study activities, such as CAI, to remediate their relative
disadvantage. Likewise, ACT, GPA, and STUDY were included to control for more general aspects of
student aptitude and academic effort. GENDER, BLACK, and AGE were used to capture any systematic
differences across demographic groups in the propensity to choose CAI study activities. Because the
CAI materials were accessed through the COBI-LAN facilities, MAJOR was included to control for
differences in the familiarity and ease of laboratory access between business and non-business students.
Students with greater degrees of computer experience and access were expected to be more receptive
to the computerized tutorials. Thus, PRIOR COMPUTER and ACCESS were expected to enter the
equation with positive signs. Likewise, IMPORTANCE was expected to positively affect CAI as students
with more favorable attitudes towards computerized instruction were expected to take advantage of
the computerized study aids.
--- Insert Table 4 About Here ---
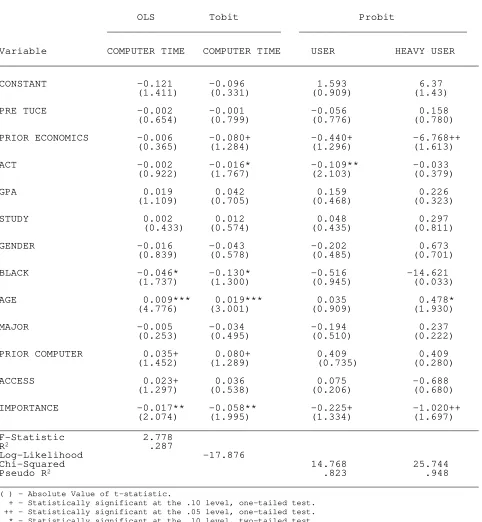
The estimated results for each specification of equation (1) are reported in Table 4. It is
important to note that the OLS and tobit specifications estimate the independent variables' effects on
COMPUTER TIME, while the probit equations examine the variables' effects on the probability that a
student chose to be a USER or HEAVY USER of CAI. Thus, direct comparisons of the coefficients
between the specifications cannot be made. One-tailed tests of statistical significance were conducted
for those variables with a priori expected signs. Two-tailed tests were employed for coefficients with
ambiguous expected signs. In addition to passing various specification tests, each estimated equation
obtained acceptable diagnostic statistics as reported at the bottom of Table 4.
None of the human capital attribute variables were found to be significant in the OLS equation.
However, two demographic characteristics were found to be important. BLACK students were found
to spend less time with CAI relative to their white cohorts. Evaluation of the BLACK coefficient
indicates that minority students spend about 38 percent less time per week with the computer than the
sample mean. Given the positive and significant AGE coefficient, older students were found to choose
more time per week with the computer. As expected, PRIOR COMPUTER experience and ACCESS were
found to significantly increase the mean hours per week spent with the computerized tutorials.5
Finally, with respect to the OLS estimation, students who more highly rated the IMPORTANCE of
computerized study activities were found to spend more hours per week pursuing CAI. (Recall from
Table 2 that the IMPORTANCE scale runs from High = 1 to Low = 5. Thus, the negative coefficient
indicates that students who more highly valued CAI spent more time on task.)
The COMPUTER TIME regression estimated by tobit yielded results similar and consistent with
the OLS estimation. Again, black students were found to spend significantly less time with the
computer while older students were found to allocate more study time to CAI. Likewise, the tobit
results indicate that PRIOR COMPUTER experience and positive attitudes for CAI, as measured by the
IMPORTANCE variable, significantly and positively affect COMPUTER TIME. In addition to collaborating
the OLS results for these variables, the tobit estimation also found PRIOR ECONOMICS and ACT to be
significant determinants of COMPUTER TIME. The negative PRIOR ECONOMICS coefficient indicates
that students who had a previous course in economics spent less time using CAI. The negative ACT
coefficient indicates that students with greater academic endowments also spent less time pursuing CAI.
Together, these two coefficients imply that students with a stronger stock of human capital allocated
less study time to CAI, relative to students with a weaker stock of human capital. Thus, the
computerized tutorials may be seen as a remediation tool by students who require additional study
assistance.
The results for the probit specifications were similar to the OLS and tobit results with respect to
the AGE and IMPORTANCE variables. A student's age was found to significantly increase the
probability that the student became a Heavy User of CAI and students who reported a more positive
attitude toward the computerized tutorials were more likely to be Users or Heavy Users of the
computer. Thus, older students and those with more positive computer attitudes were more likely to
use the computer and to spend more time studying with it.
Two human capital attributes, PRIOR ECONOMICS and ACT, were found to be significant factors
in one or both of the probit specifications. Both were found to negatively effect the probability that a
student would use the computer. Students who had not previously studied economics may have
chosen CAI in order to "catch up" with their classmates who had taken a prior course in high school or
college.6 Again, the negative ACT coefficient may indicate that students with lower levels of overall
academic aptitude seek out additional study aids, such as CAI, to remediate their academic position.
Such students would have more to gain from successful CAI, holding all else constant, than students
with relatively greater degrees of academic aptitude.
PRE TUCE, GPA, STUDY, GENDER and MAJOR were not found to be significant in any
specification of the model. These factors apparently did not have significant independent effects on a
student's decision to use the computer or the mean time spent with the course's CAI materials. Of the
statistically significant variables, only IMPORTANCE was found to be significant across all four
specifications of equation (1). Thus, student attitude toward computerized study is of primary
importance in determining the extent of CAI use. Students who felt that CAI could not improve their
course learning, relative to other modes of study, chose to use the computer to a significantly lesser
extent than those students who perceived a learning benefit. This conclusion raises the question of
whether CAI did or did not improve student understanding of course material. The next section
addresses this important issue.
COMPUTER USAGE AND ECONOMIC UNDERSTANDING
Many of the empirical models of student learning in the economic education literature implicitly
assume that the effects of study time are captured in other measures of student aptitude and effort
(e.g. grades and test scores). However, some researchers have developed formal models of student
utility maximization to explain study time (e.g. [7] and [2]). Empirical tests of such models have not
always verified the theoretically identified returns to total time spent studying [4]. Schmidt [12] found
that components of total study time became significant within the traditional production function
framework when time was disaggregated by type of study activity. Thus, students may be viewed as
maximizers who choose between alternative study strategies within the portfolio of activities available
to them. It is this perspective that is taken here.
As noted earlier, all previous studies examining the effects of CAI on student performance in the
Principles course were conducted under quasi-experimental conditions. In these studies, one group of
students would be given computer assignments (the treatment group) and another group would not
(the control group). Researchers then tested for differences in performance between the two groups.
In our case, students made the decision about who used the computer, not the instructor. Thus, in
order to determine the effect of CAI on student performance we must first account for the probability of
CAI being chosen as a study activity. This is a classic case of self-selection. Students self-selected
themselves into the Users and Heavy Users groups.
The probit equations reported in Table 4 were used to calculate Heckman's selection estimators
(the inverse of Mill's Ratio) for Users and Heavy Users. These were then used to estimate a "treatment
effects" selection variant of the traditional education production function regression for the two groups.
The treatment effects model utilizes the full sample (all 96 observations) to calculate the regression
coefficients and has been previously applied in the returns to education literature.7 Thus, the following
equation was estimated separately for Users and Heavy Users:
POST TUCE = α + δ1PRE TUCE + δ2PRIOR ECONOMICS + δ3ACT + δ4GPA + δ5GENDER + δ6BLACK + δ7AGE +
δ8MAJOR + δ9COMPUTER TIME + δ10TEXTBOOK TIME + δ11WORKBOOK TIME + δ12NOTES TIME +
δ13GROUP TIME + LAMBDA + ε (2)
Equation (2) is a slight modification of the standard production function prevalent in the empirical
economics education literature [3]. As specified, a student's study time explicitly enters the model in a
disaggregated form through the five study activity variables. Lambda is the selection term which
controls for the probability that a student chose the treatment (computer usage) which defines the
relevant sample. The estimated results are reported in Table 5.
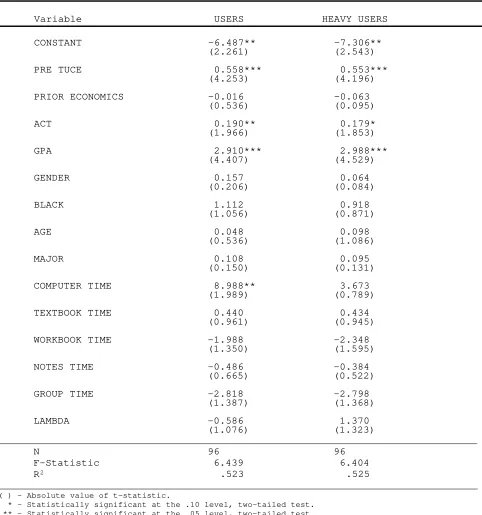
--- Insert Table 5 About Here ---
Table 5 reveals that the results are similar across the Users and Heavy Users samples. Both
estimated equations obtained significant F-statistics and acceptable R2 values. Lambda, the selection
term, was not found to be statistically significant in either equation. Even though Lambda was found
to be insignificant, the design of this study required us to account for the voluntary selection of
treatment by the student subjects.
Although neither estimation yielded statistically significant coefficients for the demographic
variables, PRE TUCE, ACT, and GPA were found to be significant positive determinants of end-of-course
economic understanding for both samples. These findings are consistent with a priori expectations
and the established empirical literature.
Only one study activity variable was found to have a statistically significant effect on student
performance. COMPUTER TIME entered the Users equation with a positive coefficient significant at
the .05 level (two-tailed test). Evaluation of this coefficient suggests that a one hour increase in the
average weekly time spent with CAI would improve POST TUCE performance by almost 9 points, ceteris
paribus. This is a substantial return given the distribution of PRE TUCE and POST TUCE scores (see
Table 3).8 However, it must be recalled that students in the samples averaged far less than one hour a
week engaging in CAI opportunities. This suggests that students failed to perceive the predicted return
to CAI or were willing to bear the opportunity cost of choosing alternative study activities. The
insignificance of the other study time coefficients suggest a stronger test performance return to CAI
relative to more traditional study activities, holding all else constant.
CONCLUSIONS
Several conclusions can be drawn from the case study presented here. First, the computer was
not found to be a popular elective study tool with students in a typical Principles of Economics course.
Even when students were provided easy access, a relative minority voluntarily chose CAI as a study
activity. Those who did pursue CAI spent only a minimal amount of their total class study time with the
computer.9 There was some indication that the most dedicated computer users supplemented their
study time with the computer rather than to substitute computer time for time spent in other study
activities.
Second, our model of computer usage indicated that two demographic characteristics
significantly influenced computer use. Black students were found to use the computer significantly
less than their white cohorts. Age was found to be positively related to averaging more study hours on
the computer each week. Such findings suggest that additional attention should be placed on these
two characteristics of students when computerized instruction is incorporated into course design.
The third major conclusion drawn from our results involves the ease of access and student
computer endowments and attitude. Students with greater physical access to computers and students
who had taken a formal course in computer operations spent more time each week with CAI. Most
significantly, students who highly rated the importance of CAI to their learning were more likely to be
computer users and spend more time on task. Students must be convinced that CAI will generate a
performance reward before they will undertake this activity which is not part of their normal study
routine. Casual empiricism supports this conclusion. Conversations with students in the sample
indicated than many did not pursue the computerized tutorials because they felt the computer quizzes
and problems were not relevant to the material they were seeing in class and on exams. Software
authors and instructors need to insure that the relevance of material is clear to all students who choose
to pursue CAI.
The fourth and final major conclusion concerns the effect of CAI on student performance.
Results from a treatment effects selection model indicated that computer time for students who
voluntarily chose CAI activities significantly improved post-course test performance, ceteris paribus.
Time spent in more traditional study activities was not found to improve student performance. Given
the negligible use of CAI, we must conclude that students failed to perceive the expected return to time
on the computer or were willing to bear the opportunity cost by pursuing other study activities.
This case study illustrates that economic educators need to assess the behavior of students
when introducing new pedagogical tools in their classrooms. Additional research is needed to explore
how courses can be designed to encourage the use of beneficial instructional technologies. Our results
suggest that when given the freedom of choice, students may not necessarily perceive which activities
provide the greatest return.
REFERENCES
1. Bartlett R. and King P., Teaching economics as a laboratory science. Journal of Economic Education 21, 181-194 (1990).
2. Becker W. E., Economic education research: Part II, new directions in theoretical model building. Journal of Economic Education14 4-10 (1983).
3. Becker W. E. and Walstad W. B., Econometric modeling in economic education research. Kluwer-Nijhoff Publishing, Boston (1987).
4. Gleason J. P. and Walstad W. B., An empirical test of an inventory model of student study time. Journal of Economic Education19 315-321 (1988).
5. Greene W. H., Limdep version 6.0 - Users manual and reference guide. Econometric Software Incorporated, Bellport NY (1992).
6. Grimes P. W. and Ray M. A., Economics: Microcomputers in the college classroom - A review of the academic literature. Social Science Computer Review11 452-463 (1993).
7. Kelley A. C., The student as utility maximizer. Journal of Economic Education7 82-92 (1975).
8. Maxwell N. L. and Lopus J. S., The Lake Wobegon Effect in Student Self-Reported Data. American Economic Review84 201-205 (1994).
9. Parkin M., Economics - Second Edition. Addison-Wesley Publishing Company, New York (1993).
10. Ray M. A., Economics 2131: Computer laboratory in economics - a supplement to principles of economics. In Economic Education Experiences of Enterprising Teachers 141-148. Joint Council on Economic Education, New York (1991).
11. Saunders P., Test of understanding in college economics - Examiner's manual. Joint Council on Economic Education, New York (1991).
12. Schmidt R. M., Who maximizes what? A study in student time allocation. American Economic Review73 23-27 (1983).
NOTES
1The textbook for the course was Michael Parkin's Economics [9]. A CAI package entitled Economics
in Action is distributed with this textbook. Economics in Action is a state of the art tutorial, quiz, graphing, demonstration and testing program that covers the main themes of a Principles of Economics course. The instructional material utilizes a Windows-like graphical user interface. The user navigates the program with either a mouse or keyboard using a series of menus and icons. All students in the course were provided with a ten page handout describing the program and the various units of material that it covers. In addition, any student who requested help getting started with the program was given assistance by the graduate teaching assistant or the instructor. Further, information and handouts concerning the availability of CAI programs being used in other sections were also provided.
2Maxwell and Lopus [8] report that students may inflate their academic achievements when data is collected by survey. The frequency of our surveys and the personal nature of the data collection process minimizes this problem.
3The original sample contained 104 students. Eight students failed to complete the course due to schedule change, university withdrawl, or personal illness. All statistical calculations are based on the final sample of 96 students. Analysis of the data did not indicate a statistically significant self-selection problem for the investigative sample. Only one student who failed to complete the course was a computer user. The complete database constructed for this study is available upon request from the authors.
4Examination of the study time surveys indicate that approximately one half of the computer users worked with the CAI material only one or two times. Further, the surveys report that a majority of computer time occurred in the early and middle part of the semester. Thus, some degree of "sampling" appears to have taken place and some students did not find the experience beneficial for them. Also, as expected, computer time demonstrated a pattern of "batch" use occurring immediately prior to scheduled examinations.
5Examination of the data revealed that black students may have had a lower incidence of prior computer experience than white students. An alternative specification of Equation (1) which included an interaction term between BLACK and PRIOR COMPUTER was estimated by OLS. The results indicated completion of a computer course significantly reduces the estimated BLACK effect on CAI study time. Complete copies of these results are available upon request.
6Most students who reported completing a prior course in economics had done so at the high school level. At MSU, Principles of Macroeconomics (EC 2113) is the first course of the Principles sequence. However, because of transfer students from other schools and because some students fail to take the sequence in the recommended order, EC 2113 is not everyone's first college economics course at MSU.
7The treatment effects form of the selection model allows the equation to be estimated with a sufficient number of degrees of freedom. The entire sample of 96 observations is used in the estimation. See Greene [5] for a discussion of this technique.
8It is reasonable to assume that study time is subject to diminishing marginal returns. To account for this, the following logarithmic specification of Equation (2) was estimated for both Users and Heavy Users:
where X represents the study time inputs and Z represents the other determinants of student understanding. The results are consistent with the linear form of the model presented in Table 5. The ln(COMPUTER TIME) was found to be positive and significant for Users (0.428 with a t = 2.114), but marginally insignificant for Heavy Users (0.034 with a t = 1.256). The other study time variables were insignificant. Copies of the complete logarithmic estimations are available upon request from the authors.
9The relatively low levels of computer use may be a reflection of the current state of educational software sophistication and not of CAI as a study activity. Future advancements in CAI technology which enhance learning efficiency may encourage greater levels of use.
ln(POST-TUCE)=α+
k
å
i=0
γiln(Xi)+ 13
å
i=k+1
γiZi+λ+ε
Table 1
STUDY ATTITUDES AND BEHAVIOR BY COMPUTER USAGE:
MEANS AND STANDARD DEVIATIONS OF SURVEY RESPONSES
_______________________________________________________________________________
Activity Total Non-Users All Users Heavy Users
_______________________________________________________________________________
Average number of hours spent per week in each type of study activity. Calculated from weekly study time surveys.
Computerized 0.02 0.00 0.12 0.28 Tutorials (0.08) (0.00) (0.16) (0.22)
Reading the 1.33 1.31 1.37 1.83 Textbook (0.95) (0.99) (0.75) (1.20)
Using the 0.10 0.09 0.14 0.11 Workbook (0.23) (0.23) (0.22) (0.20)
Reviewing 0.70 0.69 0.76 0.74 Class Notes (0.62) (0.66) (0.43) (0.37)
Study with someone 0.10 0.10 0.12 0.16 else on in a group (0.17) (0.16) (0.20) (0.19)
Question: Rank from 1 (High) to 5 (Low) the importance of each of the following study activities in determining your learning from this class.
Computerized 4.29 4.36 4.04 3.40 Tutorials (1.01) (1.00) (1.06) (1.41)
Reading the 1.39 1.37 1.45 1.89 Textbook (0.91) (0.89) (1.01) (1.57)
Using the 3.55 3.51 3.68 3.75 Workbook (1.19) (1.18) (1.24) (1.61)
Reviewing 1.95 1.87 2.27 2.34 Class Notes (0.90) (0.86) (0.99) (1.03)
Study with someone 3.57 3.55 3.66 3.29 else or in a group (0.94) (0.92) (1.05) (1.19)
_______________________________________________________________________________
Percent of Sample 100.00 80.21 19.79 6.25
_______________________________________________________________________________
Table 2
SPECIFICATION OF VARIABLES
________________________________________________________________________________
Variable Definition
COMPUTER TIME Average number of hours per week studying with computerized tutorials
USER Student used computerized tutorials during the semester at least once = 1; otherwise = 0 HEAVY USER Study time with computerized tutorials is
greater than the User mean = 1; otherwise = 0 POST TUCE Test of Understanding College Economics score at
conclusion of course
PRE TUCE Test of Understanding College Economics score prior to start of course
PRIOR ECONOMICS Student had completed previous course in economics (college or high school)
ACT Score on the American College Test
GPA Cumulative grade point average (4 point scale) STUDY Average number of study hours per week for course
(non-computer hours) GENDER Female = 1; Male = 0
BLACK Black = 1; White or other = 0
AGE Age in years
MAJOR Business major = 1; otherwise = 0
PRIOR COMPUTER Student had completed previous course in computer use (college or high school)
ACCESS Computer available to student at place of residence or work = 1; otherwise = 0
IMPORTANCE Importance of computerized tutorials to learning; categorical variable running 1 (High) to 5 (Low) TEXTBOOK TIME Average study hours per week reading the textbook WORKBOOK TIME Average study hours per week using the workbook NOTES TIME Average study hours per week reviewing class notes GROUP TIME Average hours per week studying with someone else
or in a group
________________________________________________________________________________
Table 3
MEANS AND STANDARD DEVIATIONS OF REGRESSION VARIABLES
________________________________________________________________________________
Variable Total Non-Users All Users Heavy Users
________________________________________________________________________________
COMPUTER TIME 0.02 0.00 0.12 0.28 (0.08) (0.00) (0.16) (0.22)
USER 0.20 0.00 1.00 1.00 (0.40) (0.00) (0.00) (0.00)
HEAVY USER 0.06 0.00 0.32 1.00 (0.24) (0.00) (0.48) (0.00)
POST TUCE 11.88 12.08 11.05 13.17 (4.32) (4.32) (4.33) (5.19)
PRE TUCE 9.08 9.30 8.21 8.67 (2.68) (2.76) (2.15) (2.66)
PRIOR ECONOMICS 0.59 0.64 0.42 0.17 (0.49) (0.48) (0.51) (0.41)
ACT 21.70 22.25 19.50 20.40 (4.51) (4.57) (3.58) (4.71)
GPA 2.75 2.76 2.68 2.73 (0.60) (0.58) (0.68) (0.79)
STUDY 2.24 2.19 2.40 2.84 (1.54) (1.65) (1.02) (1.26)
GENDER 0.25 0.26 0.21 0.17 (0.44) (0.44) (0.41) (0.41)
BLACK 0.14 0.14 0.11 0.00 (0.34) (0.35) (0.32) (0.00)
AGE 21.05 20.86 21.84 24.50 (4.21) (3.99) (5.06) (7.99)
MAJOR 0.28 0.29 0.26 0.33 (0.45) (0.45) (0.45) (0.52)
PRIOR COMPUTER 0.88 0.87 0.89 0.83 (0.33) (0.34) (0.32) (0.41)
ACCESS 0.72 0.71 0.74 0.83 (0.45) (0.45) (0.45) (0.41)
IMPORTANCE 4.29 4.36 4.04 3.40 (1.01) (1.00) (1.06) (1.41)
________________________________________________________________________________ N 96 77 19 6
________________________________________________________________________________
Note: Descriptive statistics for TEXTBOOK TIME, WORKBOOK TIME, NOTES TIME, and GROUP TIME can be found in the upper portion of Table 1.
Table 4
THE DETERMINANTS OF COMPUTER USAGE: OLS AND PROBIT RESULTS
________________________________________________________________________________
OLS Tobit Probit
_____________________________ ____________________________
Variable COMPUTER TIME COMPUTER TIME USER HEAVY USER ________________________________________________________________________________
CONSTANT -0.121 -0.096 1.593 6.37 (1.411) (0.331) (0.909) (1.43) PRE TUCE -0.002 -0.001 -0.056 0.158 (0.654) (0.799) (0.776) (0.780) PRIOR ECONOMICS -0.006 -0.080+ -0.440+ -6.768++
(0.365) (1.284) (1.296) (1.613) ACT -0.002 -0.016* -0.109** -0.033
(0.922) (1.767) (2.103) (0.379) GPA 0.019 0.042 0.159 0.226
(1.109) (0.705) (0.468) (0.323) STUDY 0.002 0.012 0.048 0.297
(0.433) (0.574) (0.435) (0.811) GENDER -0.016 -0.043 -0.202 0.673
(0.839) (0.578) (0.485) (0.701) BLACK -0.046* -0.130* -0.516 -14.621
(1.737) (1.300) (0.945) (0.033) AGE 0.009*** 0.019*** 0.035 0.478* (4.776) (3.001) (0.909) (1.930) MAJOR -0.005 -0.034 -0.194 0.237
(0.253) (0.495) (0.510) (0.222) PRIOR COMPUTER 0.035+ 0.080+ 0.409 0.409
(1.452) (1.289) (0.735) (0.280) ACCESS 0.023+ 0.036 0.075 -0.688
(1.297) (0.538) (0.206) (0.680) IMPORTANCE -0.017** -0.058** -0.225+ -1.020++
(2.074) (1.995) (1.334) (1.697) ________________________________________________________________________________ F-Statistic 2.778
R2 .287
Log-Likelihood -17.876
Chi-Squared 14.768 25.744
Pseudo R2 .823 .948
________________________________________________________________________________
( ) - Absolute Value of t-statistic.
+ - Statistically significant at the .10 level, one-tailed test. ++ - Statistically significant at the .05 level, one-tailed test. * - Statistically significant at the .10 level, two-tailed test. ** - Statistically significant at the .05 level, two-tailed test. *** - Statistically significant at the .01 level, two-tailed test.
Table 5
THE DETERMINANTS OF ECONOMIC UNDERSTANDING: SELECTION MODEL RESULTS
Variable USERS HEAVY USERS
CONSTANT -6.487** -7.306** (2.261) (2.543)
PRE TUCE 0.558*** 0.553*** (4.253) (4.196)
PRIOR ECONOMICS -0.016 -0.063 (0.536) (0.095)
ACT 0.190** 0.179*
(1.966) (1.853)
GPA 2.910*** 2.988***
(4.407) (4.529)
GENDER 0.157 0.064
(0.206) (0.084)
BLACK 1.112 0.918
(1.056) (0.871)
AGE 0.048 0.098
(0.536) (1.086)
MAJOR 0.108 0.095
(0.150) (0.131) COMPUTER TIME 8.988** 3.673 (1.989) (0.789)
TEXTBOOK TIME 0.440 0.434 (0.961) (0.945)
WORKBOOK TIME -1.988 -2.348 (1.350) (1.595)
NOTES TIME -0.486 -0.384 (0.665) (0.522)
GROUP TIME -2.818 -2.798 (1.387) (1.368)
LAMBDA -0.586 1.370 (1.076) (1.323)
________________________________________________________________________________
N 96 96
F-Statistic 6.439 6.404
R2 .523 .525
________________________________________________________________________________
( ) - Absolute value of t-statistic.
* - Statistically significant at the .10 level, two-tailed test. ** - Statistically significant at the .05 level, two-tailed test. *** - Statistically significant at the .01 level, two-tailed test.