http://dx.doi.org/10.4236/aim.2014.413095
How to cite this paper: Huang, I-N., et al. (2014) Diversity of Microflora in Colonic Mucus from Severe Ulcerative Colitis Pa-tients Analyzed by Terminal Restriction Fragment Length Polymorphism and Clone Libraries of Bacterial 16S rRNA Gene Sequences. Advances in Microbiology, 4, 857-870. http://dx.doi.org/10.4236/aim.2014.413095
Diversity of Microflora in Colonic Mucus
from Severe Ulcerative Colitis Patients
Analyzed by Terminal Restriction
Fragment Length Polymorphism
and Clone Libraries of Bacterial
16S rRNA Gene Sequences
I-Nung Huang1,2, Yuri Sato1,2, Mitsuo Sakamoto2, Moriya Ohkuma2, Shinobu Ohnuma3, Takeshi Naitoh3, Chikashi Shibata3, Akira Horii4, Junko Nishimura1, Haruki Kitazawa1, Tadao Saito1*
1Graduate School of Agricultural Science, Tohoku University, Miyagi, Japan 2Japan Collection of Microorganisms, RIKEN BioResource Center, Ibaraki, Japan
3Department of Surgery, Tohoku University Graduate School of Medicine, Miyagi, Japan
4Department of Molecular Pathology, Tohoku University Graduate School of Medicine, Miyagi, Japan
Email: *[email protected]
Received 29 April 2014; revised 30 May 2014; accepted 28 June 2014
Copyright © 2014 by authors and Scientific Research Publishing Inc.
This work is licensed under the Creative Commons Attribution International License (CC BY). http://creativecommons.org/licenses/by/4.0/
Abstract
Although the gut microflora is thought to be an essential factor in the development of ulcerative colitis (UC), the entire gut microflora occurring in UC remains unknown. Most studies use feces to represent the microflora distribution; however, here we analyzed the bacterial diversity in colonic mucus from UC patients receiving colectomy surgery and control patients. The diversity of micro-flora was investigated using a combination of terminal restriction fragment length polymorphism (T-RFLP) and clone library analyses of the 16S rRNA gene sequences. In the T-RFLP analysis, the number of terminal restriction fragments (T-RFs) decreased significantly in UC patients when compared to control samples. Also in the clone library analysis, the number of operational tax-onomic units (OTU) and the Shannon diversity index were reduced significantly in UC patients. These molecular analyses reveal an overall dysbiosis in UC patients. No specific pathogen was found, and a strong negative correlation in relative abundance of bacterial populations was
observed between the phyla Bacteroidetes and Firmicutes in the UC patients. This is the first re-port showing a significant correlation between these two phyla, which may be imre-portant charac-teristics in the pathogenesis of UC.
Keywords
Ulcerative Colitis, Microflora, Terminal Restriction Fragment Length Polymorphism, 16S rRNA Gene Clone Library
1. Introduction
Ulcerative colitis (UC) is an intractable disease where erosion and ulcers occur in the colon with chronic in-flammation. Although medical therapy, e.g. antibiotics and 5-aminosalicylic acid (5-ASA) treatments, can sup-press the inflammation of UC, colectomy surgery is required in some cases. The etiology of UC is associated with genetic and environmental factors causing immunological disorders and chronic inflammation; however, the mechanism remains unclear. Genetic factors, such as ECM1[1] and HLA-DR [2] were reported to be strongly associated with an excessive immune response in UC. However, because the increase in UC patients in Asian nations began when the life style changed to western with a western dietary style, the change in the microflora of the intestine was considered to be an important environmental factor in the pathogenesis of UC [3] [4].
The commensal gut flora contributes to the control of the immune system by promoting the growth of regula-tory T cells that maintain the homeostasis in the gut [5]. Without the commensal flora in the intestine, immune- associated tissues, such as Peyer’s patches, mesenteric lymph nodes [6], and isolated lymphoid follicles [7] re-main immature, indicating the normal flora in the gut influences the growth of the immune systems. Moreover, immunodeficient mouse models, such as the interleukin (IL)-2 knockout mouse [8], IL-10 knockout mouse [9], and TCR-α knockout mouse [10] show similar inflammatory symptoms to human inflammatory bowel disease (IBD). The symptoms disappeared when the mice were bred in sterile conditions. This supports the hypothesis that the presence of microflora is necessary for development of UC symptoms.
Due to the importance of the microflora in UC, there are a large number of reports that investigate gut micro-flora in UC patients using feces or biopsy by culture-dependent methods and culture-independent methods [11]- [15]. Some bacteria, such as Bacteroides[16], pathogenic Escherichia coli[17], and Fusobacterium varium[18]
have been implicated in the pathogenesis of UC. A positive correlation between the expressed proportion of sulfomucin and sulfate-reducing bacteria was observed in the gut microflora of healthy subjects [19], whereas sulfomucin was decreased in UC [20]. However, consensus has not been achieved where severe UC patients undergoing colectomy surgery have lower quality of life and their gut microflora has not been investigated. Therefore, the purpose of this study was to investigate the diversity of gut microflora from the colonic mucus collected from UC patients receiving colectomy surgery. We applied culture-independent molecular approaches to combine terminal restriction fragment length polymorphism (T-RFLP) and clone library analyses of the 16S rRNA gene sequences. T-RFLP is a molecular technique that provides rapid comparison of community struc-tures and diversity of complex bacterial flora and has been applied to characterize the endodontic microflora
[21], soil bacterial communities [22], gut microflora [23], and bacterial communities in other environments [24]. The clone analysis of 16S rRNA gene sequences is a powerful tool for determination of exact species of bacteria, and the fragments in the T-RFLP analysis can be assigned to corresponding bacterial species. The diversity of microflora and the correlation between different taxa of bacteria were also investigated in this study. Using analysis of the gut microflora in UC patients (especially in serious cases), our observations may contribute to explain the pathogenesis of UC, and provide new therapeutic strategies for UC.
2. Materials and Methods
2.1. Preparation of Mucus Samples for DNA Extraction
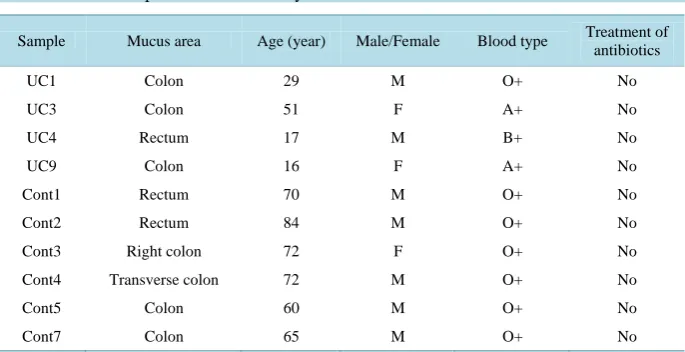
anti-biotics. The human colonic mucus was prepared from four UC patients who were diagnosed with UC based on clinical symptoms and required colectomy surgery at Tohoku University Hospital. As a control, the mucus from the normal portions of six colorectal cancer patients was used (Table 1). The mucus was collected from colon specimens by scraping and stored at −80˚C until used.
2.2. DNA Extraction and PCR Amplification of the 16S rRNA Gene
DNA was extracted from colonic mucus using MORA-EXTRACT (Kyokuto Pharmaceutical Industrial Co., Ja-pan) according to the manufacturer’s instructions. The total DNA was dissolved in 100 μl of TE buffer (pH 8.0, Nippon Gene Co., Japan) and stored at −30˚C until used. The 16S rRNA gene was amplified using 35F (5’- CCTGGCTCAGGATGAACG-3’) and 1492R (5’-GGTTACCTTGTTACGACTT-3’). The primers with or with-out a fluorescent label were used for T-RFLP analysis and clone library analysis, respectively. Primer 35F was labeled at 5’ end with 6’-carboxyfluorescein (6-FAM). Amplification reactions were performed in a total vo-lume of 50 μl containing dissolved DNA (<100 ng), 0.25 μl TaKaRa Ex Taq (Takara Shuzo, Japan), 5 μl 10× Ex Taq buffer, 4 μl dNTP mixture (each 2.5 mM), and 10 pmol each primer. The 16S rRNA gene was amplified using 10 min at 95˚C for initial denaturation, followed by 30 cycles: 95˚C for 30 s; 50˚C for 30 s; 72˚C for 1.5 min; and a final extension of 10 min at 72˚C. The products were electrophoresed in 1% agarose using 1× TAE as the reservoir buffer. After electrophoresis, the gel was visualized using ethidium bromide staining. Further, PCR products were purified with the QIAquick PCR purification kit (Qiagen, Germany).
2.3. T-RFLP Analysis
T-RFLP analysis was performed using the method from Sakamoto et al. [21]. In brief, purified PCR products were digested with HhaI, MspI, AluI, HaeIII, or RsaI (20 U each; TaKaRa Shuzo) in a total volume of 10 μl at 37˚C for 2.5 h. The restriction digest product (1 μl) was mixed with 8 μl of Hi-Di Formamide (Applied Biosys-tems, USA) and 1μl of GS1200LIZ® Size Standard (Applied Biosystems) as an internal standard. After denatu-ration at 95˚C for 2 min and cooling on ice, the lengths of the terminal restriction fragments (T-RFs) were ana-lyzed using an ABI PRISM 3130x/genetic analyzer (Applied Biosystems) in Genescan mode. To remove back-ground and small peaks, T-RFs whose relative areas were less than 2.0% of the total area were deleted. Frag-ments ranging from three to five base pairs (bp) were grouped into one operational taxonomic unit (OTU). T-RF length of the 16S rRNA gene of known bacterial species was predicted in silico using the Genetyx program (version10, Genetyx Corporation, Japan).
2.4. 16S rRNA Gene Clone Library Analysis
[image:3.595.127.470.546.722.2]The purified PCR products were cloned into Escherichia coli DH5α using the pGEM-T Easy vector system (Promega, USA). 96 recombinant colonies were selected for direct PCR by the blue-white selection. The vec-tor-specific primers T7 (5’-TAATACGACTCACTATAGGG-3’) and Sp6 (5’-ATTTAGGTGACACTATAGA-
Table 1. Patient samples used in this study.
Sample Mucus area Age (year) Male/Female Blood type Treatment of antibiotics
UC1 Colon 29 M O+ No
UC3 Colon 51 F A+ No
UC4 Rectum 17 M B+ No
UC9 Colon 16 F A+ No
Cont1 Rectum 70 M O+ No
Cont2 Rectum 84 M O+ No
Cont3 Right colon 72 F O+ No
Cont4 Transverse colon 72 M O+ No
Cont5 Colon 60 M O+ No
AT-3’) were used. Amplification was performed in a 20 μl reaction mixture containing 10 μl TaKaRa Ex Taq (Takara Shuzo), 200 μl 10× Ex Taq buffer, 160 μl dNTP mixture (2.5 mM each), each primer (10 pmol), and bacterial cells. The samples were amplified using a C1000™ Thermal Cycles (Bio-Rad, USA) and the following: 95˚C for 3 min; 30 cycles of 95˚C for 30 s, 50˚C for 30 s, and 72˚C for 1.5 min; and finally 72˚C for 10 min. After electrophoresis and purification with ExoSAP-IT (GE Healthcare, UK), approximately 500 bp of the 5’ end of the 16S rRNA gene containing hypervariable regions V1 to V3 was sequenced using the 35F primer, a Big Dye Terminator Cycle Sequencing Kit (Applied Biosystems) and an ABI PRISM 3130xl Genetic Analyzer (Applied Biosystems). Sequences were aligned with the Clustal X 2.0.12 program [25], and corrected by manual inspection. Libraries were clustered using the Dist program of Mothur [26], and compared with similar se-quences to the reference organisms using EzTaxon server 2.1 (http://www.ezbiocloud.net/eztaxon) or a BLAST search [27]. 16S rRNA gene sequence similarity of 98% was used as the cut-off for positive identification of a taxon (OTU). The coverage of the sequence was expressed as a percentage representing sampling intensity [28]. Com- munity diversity was measured using the Shannon [29] and Simpson [30] index. The Chao1 index was used to measure community richness [31]. The fraction of shared OTUs was represented in Venn diagrams using the Venn program of Mothur [26].
2.5. Statistical Analysis
The average number of fragments generated using digestion with each restriction enzyme was expressed as mean ± SE. Differences between two groups were examined using the Student’s t-test. The test of population proportion was performed for the related ratios of gut bacteria in UC patients compared to the controls using the SAS computer program, the GLM procedure.
Correlations among the related ratios of microflora detected by the clone library were examined, and signi-ficances of their coefficients were estimated by the SAS computer program, the CORR procedure.
3. Results
3.1. T-RFLP Analysis
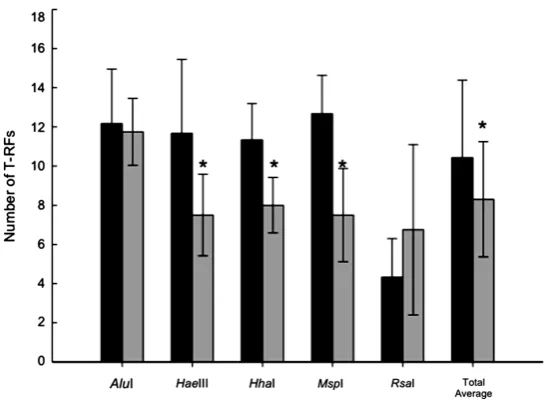
T-RFLP analysis was performed using four UC patients and six control patients. The typical T-RFLP patterns are shown in Figure 1. The number of T-RFs having an area >2% of the total fragment area was counted, and computed to compare the average value for each group. The number of total T-RFs decreased significantly in UC patients (8.3 ± 2.9) compared to controls (10.4 ± 3.9) (p < 0.05). Although the number of HaeIII, HhaI, or MspI-digested T-RFs in UC patients (7.5 ± 2.1, 8.0 ± 1.4, 7.5 ± 2.4, respectively) was significantly larger than in controls (11.7 ± 3.8, 11.3 ± 1.9, 12.7 ± 2.0, respectively) (p < 0.05), there was no significant difference using AluI or RsaI (Figure 2).
3.2. 16S rRNA Gene Clone Library Analysis
We constructed 16S rRNA gene clone libraries and obtained sequences from 93, 89, 94, 92, 93, 94, 58, and 94 clones representing cont1, cont2, cont3, cont4, UC1, UC3, UC4, and UC9, respectively. The coverage of UC and control group libraries was found to be 88.7% (range 84.5% - 93.5%) and 75.9% (range 62.9% - 87.2%), respectively. No significant differences in sampling coverage were evident between the two groups, thus permit-ting meaningful comparison of the samples.
The 16S rRNA clones with >98% sequence similarity were grouped into the same OTU. The number of OTUs decreased significantly in UC patients (16.5 ± 5.7) compared to the controls (34.5 ± 12.8), and the Shan-non index also decreased significantly in UC patients (1.7 ± 0.6) as compared to the controls (2.9 ± 0.6) (Figure 3). This suggests decreased microflora diversity in UC patients; as was also shown in the T-RFLP analysis where the number of fragments in UC was less than the controls. Although the average of the Chao1 richness estimators was lower in UC patients (28.5 ± 9.9) than in controls (76.3 ± 44.5), there was no significant differ-ence between the two groups (p = 0.13). Additionally, there was no significant differdiffer-ence in the Simpson index (data not shown).
Figure 1. T-RFLP patterns of 16S rRNA genes from UC and control samples generated after digestion with MspI restriction enzyme. 16S rRNA genes were amplified with universal primers 35F and 1492R.Cl., Clostridium; Ru.,
[image:5.595.178.455.268.469.2]Ruminococcus.
Figure 2. Average number of T-RFs detected in T-RFLP analysis of control
(black bars) and UC (gray bars) groups digested with five restriction en-zymes. *p< 0.05.
Figure 3. Comparison of the number of OTUs and Shannon diversity
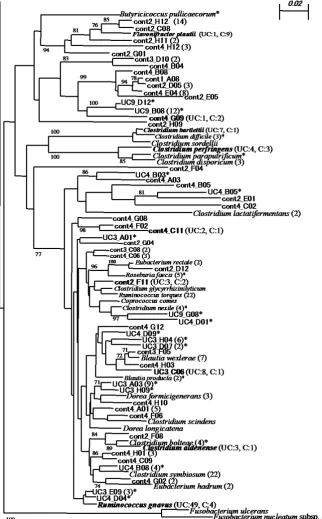
[image:5.595.185.445.517.687.2]Figure 4.Phylogenetic tree showing clones detected in the eight libraries. The tree was constructed by the neighbor-joining method based on 16S rRNA gene sequence comparisons. The scale bar represents 0.05 substitutions per nucleotide position. The numbers at the nodes of the tree indicate bootstrap values for each node out of 100 bootstrap resampling. The numbers at the end of species name represent the number of clones detected in UC and control group for each species. * Only detected in UC group. The species name without * means only detected in control group. The species without number at the end means only detected in one clone.
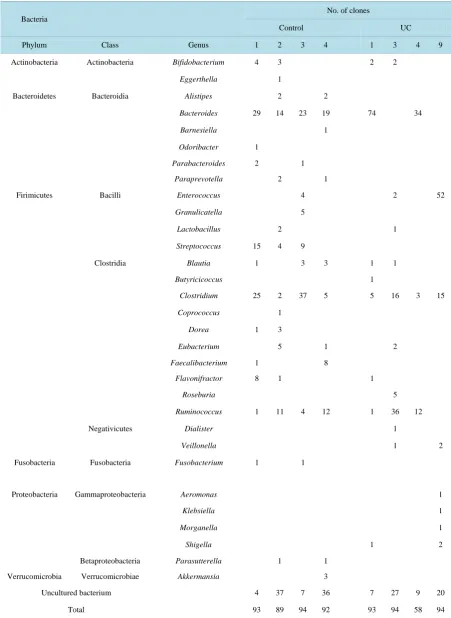
Table 2. Bacterial OTUs in UC and control groups identified by 16S rRNA gene clone library analysis.
Bacteria
No. of clones
Control UC
Phylum Class Genus 1 2 3 4 1 3 4 9
Actinobacteria Actinobacteria Bifidobacterium 4 3 2 2
Eggerthella 1
Bacteroidetes Bacteroidia Alistipes 2 2
Bacteroides 29 14 23 19 74 34
Barnesiella 1
Odoribacter 1
Parabacteroides 2 1
Paraprevotella 2 1
Firimicutes Bacilli Enterococcus 4 2 52
Granulicatella 5
Lactobacillus 2 1
Streptococcus 15 4 9
Clostridia Blautia 1 3 3 1 1
Butyricicoccus 1
Clostridium 25 2 37 5 5 16 3 15
Coprococcus 1
Dorea 1 3
Eubacterium 5 1 2
Faecalibacterium 1 8
Flavonifractor 8 1 1
Roseburia 5
Ruminococcus 1 11 4 12 1 36 12
Negativicutes Dialister 1
Veillonella 1 2
Fusobacteria Fusobacteria Fusobacterium 1 1
Proteobacteria Gammaproteobacteria Aeromonas 1
Klebsiella 1
Morganella 1
Shigella 1 2
Betaproteobacteria Parasutterella 1 1
Verrucomicrobia Verrucomicrobiae Akkermansia 3
Uncultured bacterium 4 37 7 36 7 27 9 20
Figure 5. Relative abundance of bacterial phyla identified in the 16S rRNA gene clone library analysis. Each bar represents the percent contribution of the phy-lum level profiles for each individual.
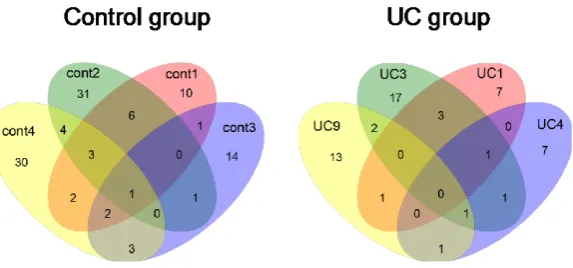
Figure 6. Venn diagrams showing the number of OTUs shared with each
sam-ples. The criterion used for grouping the sequences into OTU was 2% dissimi-larity.
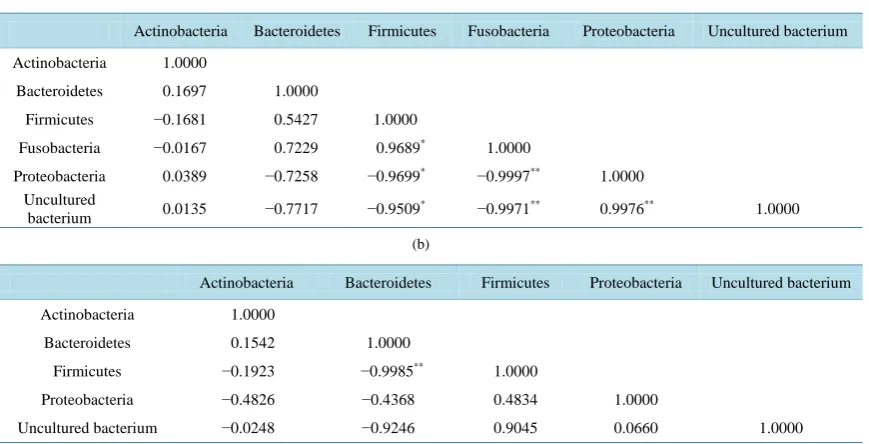
Because UC patients showed inconsistent diversity in microflora, the correlation of abundance ratio of each species (in phylum level) was analyzed. In the control group, significant positive correlations were found be-tween Firmicutes and Fusobacteria (p < 0.05) and bebe-tween Proteobacteria and uncultured bacterium (p < 0.01), whereas significant negative correlations were observed between Firmicutes and Proteobacteria (p < 0.05), Fir-micutes and uncultured bacterium (p < 0.05), Fusobacteria and Proteobacteria (p < 0.01), and Fusobacteria and uncultured bacterium (p < 0.01). In contrast, only a strong negative correlation between Bacteroidetes and Fir-micutes was significantly found in the UC group (p < 0.01) (Table 3).
3.3. Computer-Simulated T-RFLP Analysis
[image:9.595.173.460.326.460.2]Table 3. Statistical relationship between abundance of each phylum in (a) control and (b) UC group respectively. *p< 0.05, **p< 0.01. (a) Control group; (b) UC group.
(a)
Actinobacteria Bacteroidetes Firmicutes Fusobacteria Proteobacteria Uncultured bacterium
Actinobacteria 1.0000
Bacteroidetes 0.1697 1.0000
Firmicutes −0.1681 0.5427 1.0000
Fusobacteria −0.0167 0.7229 0.9689* 1.0000
Proteobacteria 0.0389 −0.7258 −0.9699* −0.9997** 1.0000 Uncultured
bacterium 0.0135 −0.7717 −0.9509
* −0.9971** 0.9976** 1.0000
(b)
Actinobacteria Bacteroidetes Firmicutes Proteobacteria Uncultured bacterium
Actinobacteria 1.0000
Bacteroidetes 0.1542 1.0000
Firmicutes −0.1923 −0.9985** 1.0000
Proteobacteria −0.4826 −0.4368 0.4834 1.0000
Uncultured bacterium −0.0248 −0.9246 0.9045 0.0660 1.0000
Table 4. Significant change in OTUs when compared to controls in T-RFLP analysis.
OTU Predicted bacteria
(genus or species)
Control (n = 6)
UC
(n = 4) pvalue
AluI
76 Bacteroides vulgatus, Clostridium disporicum 0 5.2 ± 3.7 0.03
HaeIII
70 B. vulgatus, B. massilensis, Bifidobacterium 13.2 ± 10.4 0 0.01
226 Flavonifractor plautii, Eubacterium hallii, Clostridium 9.3 ± 8.6 1.3 ± 2.6 0.04
303 Ruminococcus torques, Cl. symbiosum 15.7 ± 8.6 4.8 ± 3.7 0.01
MspI
72 Bifidobacterium, Parabacteroides 3.1 ± 2.1 0 <0.01
The OTUs were quantified as the percentage values of individual OTU per total OTU areas. Values (%) were expressed as means ± SD. p< 0.05 was considered significant.
4. Discussion
Although it is evident that there is a strong relationship between UC and gut microflora, the entire picture re-mains unclear. Using molecular techniques, we analyzed the bacteria existing in colonic mucus that were consi-dered to be influencing the inflammation of UC to clarify the relationship between gut inflammation and micro-flora diversity in UC. Instead of using feces, the colonic mucus from severe UC patients who had not been treated with antibiotics and received colectomy surgery were analyzed in this study.
[image:10.595.89.520.369.523.2]about 7% in intestinal tissue of healthy subjects. Compared with the results above, although Firmicutes was lower in this study (Figure 5), the microflora composition was similar in our data and in an acceptable range; thus our control group was comparative in this study.
Molecular techniques investigating sequence diversity of the 16S rRNA gene were employed to estimate the microflora composition in the gut. Using T-RFLP analysis, a culture-independent tool that provides a rapid over- view of microbial communities, the 16S rRNA genes from the mucosa-adherent microflora of UC patients and controls were analyzed after digestion with five restriction enzymes (Figure 2). HhaI and MspI-digested T-RFs from mucosa-associated microflora were reported to decrease in UC patients [15]. The decreased number of to-tal T-RFs was also confirmed in feces sample of UC patients [38], suggesting the diversity of the microflora was reduced in UC.
From the 16S rRNA gene clone library, the gut microflora was further clarified. To determine if each simula-tion was representative of the bacterial community in each group, coverage values were calculated. The average value of coverage in this study was in an acceptable range and corroborated previous findings that coverage av-eraged 80% [39], thus offering a valid basis for inter-group comparisons. A decreased number of OTUs, Shan-non (Figure 3), and Chao1 indices in UC samples were observed in this study and other similar studies [36] [40], suggesting the bacterial diversity and richness were reduced in UC pathogenesis. However, Bibiloni et al. [37]
indicated that there was a significant difference in the Shannon index between Crohn’s disease and healthy sub-jects but not between UC and healthy subsub-jects, showing some conflicting results remain.
After sequences were compared with reference bacteria, we found the commonality of bacterial species was low between each sample, which was supported by the Venn diagrams of the control and UC groups (Figure 6). The data suggested individual differences in gut microflora exist in both groups. It is a common phenomenon globally that the difference in microflora between human individuals was large, whether in UC patients or healthy individuals [36] [41] [42]. Moreover, a significant negative correlation was observed between the phy-lum Bacteroidetes and Firmicutes in the UC group (Table 3). Bacteroides vulgatus, a member of Bacteroidetes, was thought to be the most predominant bacterial species in the gut of both UC and healthy people [12] [43]. Bacteroidetes was reported to decrease in gut flora of UC [14] [40], but inconsistent reports indicated Bacteroi-detes increased [12] [36] [37] or showed no significant change [44] in UC microflora. Similarly, some reports indicated Firmicutes increased [44] or decreased [36] in UC microflora. Although previous studies gave differ-ent results, we found a significant negative correlation of Bacteroidetes and Firmicutes in UC patidiffer-ents but not in the control microflora.
With a combination of T-RFLP and 16S rRNA gene clone library, most of the T-RFs were assigned to cor-responding species or genera. There were five OTUs significantly changed in UC samples in this study. Except the AluI-digested T-RF 76-bp that was absent in controls, other OTUs decreased significantly in UC patients, and most of the corresponding bacteria were classified into Bacteroides, Clostridium, or Bifidobacterium (Table 4). The Clostridium [45] and Bacteroides [46] cluster decreased significantly in fecal samples from UC patients, whereas T-RFs were determined after digestion with BslI. Similar results were also confirmed by quantitative real-time PCR [38]. However, comparing HhaI-digested T-RFs, the T-RFs derived from Bacteroides and Bifi-dobacterium were detected in fecal sample from UC patients not healthy individuals, whereas the T-RFs derived from the class Clostridia and Lactobacillus were detected in healthy individuals not UC patients [47]. These findings showed different bacterial growth and decline, but indicated the same conclusion that the diversity of gut microflora collapsed in UC patients.
In this study, no specific pathogen was observed in the microflora of UC patients. The bacterial species found in UC were known as commensal bacteria, and also found in healthy people’s intestinal bacterial flora (Table 2). Mucus under inflammatory conditions and the changed environment in the gut influenced growth and adhesion ability of bacteria selectively in the mouse [48] [49]. It was reported that the thickness of the human gut mucus layer decreases with inflammation [50], suggesting that reduction of the mucin, which serves as the scaffold for growth and the source of nutrition for microflora, may cause loss of microflora diversity in the gut. Moreover, using Interleukin (IL)-10 deficient mice infected with Enterococcus faecalis or Escherichia coli respectively, toll-like receptor mediated NF-κB was activated and secretion of IL-23 increased, causing intestinal inflamma-tion [51]. The pathogenesis of UC may be induced by non-pathogenic commensal bacteria in the host with spe-cial genetic factors, but not induced by a specific pathogen.
to healthy subjects [43] [52], and there was no significant difference between microflora from inflamed and non-inflamed gut tissue from the same individual [53]. However, the mechanism of decreased diversity in UC is still unclear. A strong correlation between Bacteroidetes and Firmicutes in UC was shown here that may be one of the indicators in UC progression, and may contribute to the development of new therapeutic strategies for UC patients.
Acknowledgements
This work was partially supported by a Grant-in-Aid for Scientific Research (B) (No. 22380144) and Challeng-ing Exploratory Research (No. 25660097) from the Japan Society for the Promotion of Science (JSPS) to Prof. T. Saito.
References
[1] Fisher, S.A., Tremelling, M., Anderson, C.A., Gwilliam, R., Bumpstead, S., Prescott, N.J., et al. (2008) Genetic De-terminants of Ulcerative Colitis Include the ECM1 Locus and Five Loci Implicated in Crohn’s Disease. Nature Genet-ics, 40, 710-712. http://dx.doi.org/10.1038/ng.145
[2] Satsangi, J., Welsh, K.I., Bunce, M., Julier, C., Farrant, J.M., Bell, J.I., et al. (1996) Contribution of Genes of the Major Histocompatibility Complex to Susceptibility and Disease Phenotype in Inflammatory Bowel Disease. The Lancet, 347, 1212-1217. http://dx.doi.org/10.1016/S0140-6736(96)90734-5
[3] Yang, S.K., Hong, W.S., Min, Y.I., Kim, H.Y., Yoo, J.Y., Rhee, P.L., et al. (2000) Incidence and Prevalence of Ulcer-ative Colitis in the Songpa-Kangdong District, Seoul, Korea, 1986-1997. Journal of Gastroenterology and Hepatology,
15, 1037-1042. http://dx.doi.org/10.1046/j.1440-1746.2000.02252.x
[4] Ahuja, V. and Tandon, R.K. (2010) Inflammatory Bowel Disease in the Asia-Pacific Area: A Comparison with Devel-oped Countries and Regional Differences. Journal of Digestive Diseases, 11, 134-147.
http://dx.doi.org/10.1111/j.1751-2980.2010.00429.x
[5] Rakoff-Nahoum, S., Paglino, J., Eslami-Varzaneh, F., Edberg, S. and Medzhitov, R. (2004) Recognition of Commensal Microflora by Toll-Like Receptors Is Required for Intestinal Homeostasis. Cell, 118, 229-241.
http://dx.doi.org/10.1016/j.cell.2004.07.002
[6] Bouskra, D., Brézillon, C., Bérard, M., Werts, C., Varona, R., Boneca, I.G., et al. (2008) Lymphoid Tissue Genesis Induced by Commensals through NOD1 Regulates Intestinal Homeostasis. Nature, 456, 507-510.
http://dx.doi.org/10.1038/nature07450
[7] Tsuji, M., Suzuki, K., Kitamura, H., Maruya, M., Kinoshita, K., Ivanov, I.I., et al. (2008) Requirement for Lymphoid Tissue-Inducer Cells in Isolated Follicle Formation and T Cell-Independent Immunoglobulin A Generation in the Gut.
Immunity, 29, 261-271. http://dx.doi.org/10.1016/j.immuni.2008.05.014
[8] Sadlack, B., Merz, H., Schorle, H., Schimpl, A., Feller, A.C. and Horak, I. (1993) Ulcerative Colitis-Like Disease in Mice with a Disrupted Interleukin-2 Gene. Cell, 75, 253-261. http://dx.doi.org/10.1016/0092-8674(93)80067-O
[9] Sellon, R.K., Tonkonogy, S., Schultz, M., Dieleman, L.A., Grenther, W., Balish, E., et al. (1998) Resident Enteric Bacteria Are Necessary for Development of Spontaneous Colitis and Immune System Activation in Interleukin-10- Deficient mice. Infection and Immunity, 66, 5224-5531.
[10] Bhan, A.K., Mizoguchi, E., Smith, R.N. and Mizoguchi, A. (2000) Spontaneous Chronic Colitis in TCR Alpha-Mutant Mice: An Experimental Model of Human Ulcerative Colitis. International Reviews of Immunology, 19, 123-138.
http://dx.doi.org/10.3109/08830180009048393
[11] Ott, S.J., Plamondon, S., Hart, A., Begun, A., Rehman, A., Kamm, M.A., et al. (2008) Dynamics of the Mucosa-Asso- ciated Flora in Ulcerative Colitis Patients during Remission and Clinical Relapse. Journal of Clinical Microbiology, 46, 3510-3513. http://dx.doi.org/10.1128/JCM.01512-08
[12] Lucke, K., Miehlke, S., Jacobs, E. and Schuppler, M. (2006) Prevalence of Bacteroides and Prevotella spp. in Ulcera-tive Colitis. Journal of Medical Microbiology, 55, 617-624. http://dx.doi.org/10.1099/jmm.0.46198-0
[13] Frank, D.N., St. Amand, A.L., Feldman, R.A., Boedeker, E.C., Harpaz, N. and Pace, N.R. (2007) Molecular-Phyloge- netic Characterization of Microbial Community Imbalances in Human Inflammatory Bowel Diseases. Proceedings of the National Academy of Sciences of the United States of America, 104, 13780-13785.
http://dx.doi.org/10.1073/pnas.0706625104
[15] Nishikawa, J., Kudo, T., Sakata, S., Benno, Y. and Sugiyama, T. (2009) Diversity of Mucosa-Associated Microbiota in Active and Inactive Ulcerative Colitis. Scandinavian Journal of Gastroenterology, 44, 180-186.
http://dx.doi.org/10.1080/00365520802433231
[16] Bloom, S.M., Bijanki, V.N., Nava, G.M., Sun, L., Malvin, N.P., Donermeyer, D.L., et al. (2011) Commensal Bacte-roides Species Induce Colitis in Host-Genotype-Specific Fashion in a Mouse Model of Inflammatory Bowel Disease.
Cell Host and Microbe, 9, 390-403. http://dx.doi.org/10.1016/j.chom.2011.04.009
[17] Burke, D.A. and Axon, A.T. (1988) Adhesive Escherichia coli in Inflammatory Bowel Disease and Infective Diarrhoea.
British Medical Journal, 297, 102-104. http://dx.doi.org/10.1136/bmj.297.6641.102
[18] Ohkusa, T., Sato, N., Ogihara, T., Morita, K., Ogawa, M. and Okayasu, I. (2002) Fusobacterium varium Localized in the Colonic Mucosa of Patients with Ulcerative Colitis Stimulates Species-Specific Antibody. Journal of Gastroenter-ology HepatGastroenter-ology, 17, 849-853. http://dx.doi.org/10.1046/j.1440-1746.2002.02834.x
[19] Croix, J.A., Carbonero, F., Nava, G.M., Russell, M., Greenberg, E. and Gaskins, H.R. (2011) On the Relationship be-tween Sialomucin and Sulfomucin Expression and Hydrogenotrophic Microbes in the Human Colonic Mucosa. PLoS ONE, 6, e24447. http://dx.doi.org/10.1371/journal.pone.0024447
[20] Corfield, A.P., Myerscough, N. and Bradfield, N. (1996) Colonic Mucins in Ulcerative Colitis: Evidence for Loss Sul-fation. Glycoconjugate Journal, 13, 809-822. http://dx.doi.org/10.1007/BF00702345
[21] Sakamoto, M., Rocas, I.N., Siqueira, J.F. and Benno, Y. (2006) Molecular Analysis of Bacteria in Asymptomatic and Symptomatic Endodontic Infections. Oral Microbiology and Immunology, 21, 112-122.
http://dx.doi.org/10.1111/j.1399-302X.2006.00270.x
[22] Lukow, T., Dunfield, P. and Liesack, W. (2000) Use of the T-RFLP Technique to Assess Spatial and Temporal Changes in the Bacterial Community Structure within an Agricultural Soil Planted with Transgenic and Non-Transgenic Potato Plants. FEMS Microbiology Ecology, 32, 241-247. http://dx.doi.org/10.1111/j.1574-6941.2000.tb00717.x
[23] Hayashi, H., Takahashi, R., Nishi, T., Sakamoto, M. and Benno, Y. (2005) Molecular Analysis of Jejunal, Ileal, Caecal and Recto-Sigmoidal Human Colonic Microbiota Using 16S rRNA Gene Libraries and Terminal Restriction Fragment Length Polymorphism. Journal of Medical Microbiology, 54, 1093-1101. http://dx.doi.org/10.1099/jmm.0.45935-0
[24] Marsh, T.L. (1999) Terminal Restriction Fragment Length Polymorphism (T-RFLP): An Emerging Method for Cha-racterizing Diversity among Homologous Populations of Amplification Products. Current Opinion in Microbiology, 2, 323-327. http://dx.doi.org/10.1016/S1369-5274(99)80056-3
[25] Larkin, M.A., Blackshields, G., Brown, N.P., Chenna, R., McGettigan, P.A., McWilliam, H., et al. (2007) Clustal W and Clustal X Version 2.0. Bioinformatics, 23, 2947-2948. http://dx.doi.org/10.1093/bioinformatics/btm404
[26] Schloss, P.D., Westcott, S.L., Ryabin, T., Hall, J.R., Hartmann, M., Hollister, E.B., et al. (2009) Introducing Mothur: Open-Source, Platform-Independent, Community-Supported Software for Describing and Comparing Microbial Com- munities. Applied and Environmental Microbiology, 75, 7537-7541. http://dx.doi.org/10.1128/AEM.01541-09
[27] Altschul, S.F., Gish, W., Miller, W., Myers, E.W. and Lipman, D.J. (1990) Basic Local Alignment Search Tool. Jour-nal of Molecular Biology, 215, 403-410. http://dx.doi.org/10.1016/S0022-2836(05)80360-2
[28] Good, I.J. (1953) The Population Frequencies of Species and the Estimation of Population Parameters. Biometrika, 40, 237-264. http://dx.doi.org/10.1093/biomet/40.3-4.237
[29] Ludwig, J.A. and Reynolds, J.F. (1988) Statistical Ecology. John Wiley & Sons, New York.
[30] Simpson, E.H. (1949) Measurement of Diversity. Nature, 163, 688-688. http://dx.doi.org/10.1038/163688a0
[31] Chao, A. (1984) Nonparametric Estimation of the Number of Classes in a Population. Scandinavian Journal of Statis-tics, 11, 265-270.
[32] Mariat, D., Firmesse, O., Levenez, F., Guimarăes, V.D., Sokol, H., Doré, J., et al. (2009) The Firmicutes/Bacteroidetes Ratio of the Human Microbiota Changes with Age. BMC Microbiology, 9, 123.
http://dx.doi.org/10.1186/1471-2180-9-123
[33] Wang, M., Ahrné, S., Jeppsson, B. and Molin, G. (2005) Comparison of Bacterial Diversity along the Human Intestinal Tract by Direct Cloning and Sequencing of 16S rRNA Genes. FEMS Microbiology Ecology, 54, 219-231.
http://dx.doi.org/10.1016/j.femsec.2005.03.012
[34] Wang, X., Heazlewood, S.P., Krause, D.O. and Florin, T.H.J. (2003) Molecular Characterization of the Microbial Spe-cies That Colonize Human Ileal and Colonic Mucosa by Using 16S rDNA Sequence Analysis. Journal of Applied Mi-crobiology, 95, 508-520. http://dx.doi.org/10.1046/j.1365-2672.2003.02005.x
[35] Hong, P.-Y., Croix, J.A., Greenberg, E., Gaskins, H.R. and Mackie, R.I. (2011) Pyrosequencing-Based Analysis of the Mucosal Microbiota in Healthy Individuals Reveals Ubiquitous Bacterial Groups and Micro-Heterogeneity. PLoS ONE,
6, e25042. http://dx.doi.org/10.1371/journal.pone.0025042
Clone Library Analysis of the Mucosa-Associated Microbiota Reveals Dysbiosis and Differences between Inflamed and Non-Inflamed Regions of the Intestine in Inflammatory Bowel Disease. BMC Microbiology, 11, 7.
http://dx.doi.org/10.1186/1471-2180-11-7
[37] Bibiloni, R., Mangold, M., Madsen, K.L., Fedorak, R.N. and Tannock, G.W. (2006) The Bacteriology of Biopsies Dif-fers between Newly Diagnosed, Untreated, Crohn’s Disease and Ulcerative Colitis Patients. Journal of Medical Micro-biology, 55, 1141-1149. http://dx.doi.org/10.1099/jmm.0.46498-0
[38] Nemoto, H., Kataoka, K., Ishikawa, H., Ikata, K., Arimochi, H., Iwasaki, T., et al. (2012) Reduced Diversity and Im-balance of Fecal Microbiota in Patients with Ulcerative Colitis. Digestive Disease and Sciences, 57, 2955-2964.
http://dx.doi.org/10.1007/s10620-012-2236-y
[39] Bibiloni, R., Simon, M.A., Albright, C., Sartor, B. and Tannock, G.W. (2005) Analysis of the Large Bowel Microbiota of Colitic Mice Using PCR/DGGE. Letters in Applied Microbiology, 41, 45-51.
http://dx.doi.org/10.1111/j.1472-765X.2005.01720.x
[40] Ott, S.J., Musfeldt, M., Wenderoth, D.F., Hampe, J., Brant, O., Fölsch, U.R., et al. (2004) Reduction in Diversity of the Colonic Mucosa Associated Bacterial Microflora in Patients with Active Inflammatory Bowel Disease. Gut, 53, 685- 693. http://dx.doi.org/10.1136/gut.2003.025403
[41] Eckburg, P.B., Bik, E.M., Bernstein, C.N., Purdom, E., Dethlefsen, L., Sargent, M., et al. (2005) Diversity of the Hu-man Intestinal Microbial Flora. Science, 308, 1635-1638. http://dx.doi.org/10.1126/science.1110591
[42] Green, G.L., Brostoff, J., Hudspith, B., Michael, M., Mylonaki, M., Rayment, N., et al. (2006) Molecular Characteriza-tion of the Bacteria Adherent to Human Colorectal Mucosa. Journal of Applied Microbiology, 100, 460-469.
http://dx.doi.org/10.1111/j.1365-2672.2005.02783.x
[43] Conte, M.P., Schippa, S., Zamboni, I., Penta, M., Chiarini, F., Seganti, L., et al. (2006) Gut-Associated Bacterial Mi-crobiota in Paediatric Patients with Inflammatory Bowel Disease. Gut, 55, 1760-1767.
http://dx.doi.org/10.1136/gut.2005.078824
[44] Mylonaki, M., Rayment, N.B., Rampton, D.S., Hudspith, B.N. and Brostoff, J. (2005) Molecular Characterization of Rectal Mucosa-Associated Bacterial Flora in Inflammatory Bowel Disease. Inflammatory Bowel Disease, 11, 481-487.
http://dx.doi.org/10.1097/01.MIB.0000159663.62651.4f
[45] Andoh, A., Imaeda, H., Aomatsu, T., Inatomi, O., Bamba, S., Sasaki, M., et al. (2011) Comparison of the Fecal Micro-biota Profiles between Ulcerative Colitis and Crohn’s Disease Using Terminal Restriction Fragment Length Polymor-phism Analysis. Journal of Gastroenterology, 46, 479-486. http://dx.doi.org/10.1007/s00535-010-0368-4
[46] Aomatsu, T., Imaeda, H., Fujimoto, T., Takahashi, K., Yoden, A., Tamai, H., et al. (2012) Terminal Restriction Frag-ment Length Polymorphism Analysis of the Gut Microbiota Profiles of Pediatric Patients with Inflammatory Bowel Disease. Digestion, 86, 129-135. http://dx.doi.org/10.1159/000339777
[47] Andoh, A., Sakata, S., Koizumi, Y., Mitsuyama, K., Fujiyama, Y. and Benno, Y. (2007) Terminal Restriction Frag-ment Length Polymorphism Analysis of the Diversity of Fecal Microbiota in Patients with Ulcerative Colitis. Inflam-matory Bowel Disease, 13, 955-962. http://dx.doi.org/10.1002/ibd.20151
[48] Swidsinski, A., Loening-Baucke, V., Lochs, H. and Hale, L.P. (2005) Spatial Organization of Bacterial Flora in Nor-mal and Inflamed Intestine: A Fluorescence in Situ Hybridization Study in Mice. World Journal of Gastroenterology,
11, 1131-1140.
[49] Lupp, C., Robertson, M.L., Wickham, M.E., Sekirov, I., Champion, O.L., Gaynor, E.C., et al. (2007) Host-Mediated Inflammation Disrupts the Intestinal Microbiota and Promotes the Overgrowth of Enterobacteriaceae. Cell Host and Microbe, 2, 119-129. http://dx.doi.org/10.1016/j.chom.2007.06.010
[50] Swidsinski, A., Loening-Baucke, V., Theissig, F., Engelhardt, H., Bengmark, S., Koch, S., et al. (2007) Comparative Study of the Intestinal Mucus Barrier in Normal and Inflamed Colon. Gut, 56, 343-350.
http://dx.doi.org/10.1136/gut.2006.098160
[51] Kim, S.C., Tonkonogy, S.L., Karrasch, T., Jobin, C. and Sartor, R.B. (2007) Dual-Association of Gnotobiotic IL-10-/- Mice with 2 Nonpathogenic Commensal Bacteria Induces Aggressive Pancolitis. Inflammatory Bowel Disease, 13, 1457-1466. http://dx.doi.org/10.1002/ibd.20246
[52] Kleessen, B., Kroesen, A.J., Buhr, H.J. and Blaut, M. (2002) Mucosal and Invading Bacteria in Patients with Inflam-matory Bowel Disease Compared with Controls. Scandinavian Journal of Gastroenterology, 37, 1034-1041.
http://dx.doi.org/10.1080/003655202320378220