http://dx.doi.org/10.4236/jmf.2015.53021
How to cite this paper: Zhao, Q. and Gu, G.D. (2015) Approximation for Convenience Yield with Mean-Reverting Commod-ity Price. Journal of Mathematical Finance, 5, 233-242. http://dx.doi.org/10.4236/jmf.2015.53021
Approximation for Convenience Yield with
Mean-Reverting Commodity Price
*
Qiang Zhao
1, Guiding Gu
21School of Finance, Shanghai University of Finance and Economics, Shanghai, China 2School of Mathematics, Shanghai University of Finance and Economics, Shanghai, China
Email: [email protected]
Received 22 May 2015; accepted 23 June 2015; published 27 June 2015
Copyright © 2015 by authors and Scientific Research Publishing Inc.
This work is licensed under the Creative Commons Attribution International License (CC BY). http://creativecommons.org/licenses/by/4.0/
Abstract
The convenience yield of commodities is an important factor influencing futures prices and its ac-curate measure is a hot issue. Standard option-based measures assume the commodity prices fol-low a geometric Brownian motion, while some empirical evidence supports that the commodity prices show mean-reverting properties. Using a mean-reverting price process, we derive an ana-lytical convenience yield approximation. We use the soybean meal and strong wheat futures to compare the new measure with the existing approximations. Empirical study shows that the new method with the mean-reverting price process is a better approximation for convenience yields.
Keywords
Convenience Yield, Mean-Reverting Price, Options
1. Introduction
Convenience yield measures the benefit from holding physical commodities that are not available from holding futures contracts. The theory can be used to explain the difference between the spot and futures prices of com-modities. In the theory of storage as described in Kaldor (1939) [1] and Brennan (1958) [2], the futures price is considered to be the sum of spot price and the cost of storing and minus the benefit from owning the commodi-ties, which is defined as the convenience yield. The above method to estimate convenience yield is called the traditional method, which builds upon a no-arbitrage condition. In order to hold a certain commodity at time T, an investor is indifferent between the following two strategies. The first is to buy the commodity and pay the storage cost, and surely benefit from the potential upward price movement. The second is to hold a long forward contract with maturity T. A lack of storage cost data makes it difficult to estimate the convenience yield. In
ad-*This work is supported by National Natural Science Foundation of China (No.11371105), and the special fund for Shanghai colleges
dition, the short-sale restrictions, especially when the storage level is low and the cost of reproduction is expen-sive, make the arbitrage impossible. The dynamics of convenience yield plays an important role in the relation between futures and spot prices for many commodities. As an alternative, option-based approaches are used to approximate convenience yields.
The economic institution is that instead of holding a long future contract, a holder of an inventory has the op-tion to sell the commodity at any time before maturity if the spot price is high enough and if it does happen, he can buy the commodity back at a relatively low price when maturity. The value of this strategy can be derived using no-arbitrage principles. The convenience yield described as the percentage of the spot price can be ex-pressed as the difference between the values of the options written on the spot and futures prices.
Longstaff (1995) [3] derives a simple analytical value of look-back option as the upper bound on the value of marketability using option-pricing theory. Heaney (2002) [4] uses the analysis of Longstaff (1995) [3] to ap-proximate the convenience yield as the difference between two floating-strike look-back options written on the underlying commodity and the futures contract. He assumes that the investor has the perfect foresight of the price dynamics before maturity. So he can sell the commodity at the maximum price and invest the proceeds at the risk free rate, and then buy back again at the lower price at the maturity. Hochradl and Rammerstorfer (2012) [5] model the convenience yield as the difference between two geometric-mean floating strike Asian options by relaxing the assumption of the investors’ perfect foresight. Instead of selling the commodity at the maximum price, the investors are assumed to sell at geometric average prices. This makes some sense, but unlikely, they ignore the reinvestment proceeds after the commodities are sold at the geometric mean prices. The lack of rein-vestment proceeds makes the approximation result of convenience yields lower than the actual ones.
In this study, we use the option pricing method to measure the convenience yield. In order to highlight the contribution of our approach to approximating the convenience yield, we first present the existing approaches. We start our review on the traditional approach, and continue to discuss the two existing option-based ap-proaches before we introduce the modified geometric Asian option approach with the consideration for the reinvestment proceeds.
Our article is organized as follows. In Section 2, we first summarize existing approaches to approximating the convenience yields. In Section 3, we present a new modified geometric Asian option approach with the rein-vestment proceeds. Section 4 reports estimates for convenience yields using existing and the new approximation model. Finally, Section 5 concludes the article.
2. Approaches to Approximating Convenience Yield Modeling
2.1. Traditional Approach
According to the theory of storage, the arbitrage-free futures prices Ft T, agreed at time t with maturity T is equal to the cost of buying and storing the underlying commodities minus the benefits from owning it, i.e.
( )( )
, e
r c y T t t T t
F =S + − − (1) where the carrying cost c and the convenience yield y are expressed as a proportion of the commodity prices St, and r is the risk-free interest rate. According to Equation (1), implied convenience yield is given by
,
, 1
ln t t T
t T S
y r c
T t F
= + +
− (2)
As discussed before, the carrying cost data are not readily available; Equation (2) is difficult to approximate the implied convenience yield. As an alternative, the convenience yield net of carrying cost, net convenience yield
,
, 1
ln t t T
t T S
y c
T t F
− =
− (3)
is easily to estimate.
2.2. Convenience Yield Modeling Via Look-Back Options
Heaney (2002) [4] follows the discussion about the formulation of value of illiquidity of stock in Longstaff (1995) [3]. He assumes both the spot price and futures price follow the geometric Brownian motion and an in-vestor who holds the commodity has perfect foresight about the price movement later before maturity. He has the option to sell the commodity opportunistically. A rational investor will sell the commodity when its price reaches the highest during the time interval [t,T] and invest the proceeds at the risk free rate r. So, he can lock in
( )
{
}
, max e
r T S
t T t T
M = ≤ ≤τ Sτ −τ . When maturity, he can buy back the same amount of commodity at price ST. By doing
so, he earns Mt TS, −ST ≥0. This is the same payoff structure as a look-back put option with strike ,
S t T
M writ-ten on the modified underlying asset Ster T t( )
−
. Arbitrage free pricing theory suggests that the time t value of the look-back option is given by
( )
, e r T t
S S
t t T T
PV = − − E M −S (4) where the expectation is taken under the risk-neutral world.
In this paper, we assume a probability space
(
Ω,{ }
t t≥0,P)
, where P is the risk neutral measure. All expec-tations are derived under the risk neutral measure P unless a special statement. Suppose the price of commodityt
S follows
d
d d
t
S t t
S
r t w
S = +σ , (5)
Longstaff (1995) [3] derives the analytical expression of S t
PV . Then, we can get
, ln 1
S
S t
t T
t PV y
S
= +
(6)
as the benefits from holding the commodity.
For an investor who holds a futures contract on the commodity, similar calculation leads to
, ln 1
F
F t
t T
t PV y
F
= +
(7)
as the benefits from holding a long futures contract.
Heaney (2002) [4] takes the difference between yt TS, and yt TF, as the benefits from holding the physical commodity that is not obtained from holding a long futures contract. Therefore, the convenience yields can be approximated by
, , ,
S F
t T t T t T
y =y −y (8)
2.3. Convenience Yield Modeling Via Asian Options
Hochradl and Rammerstorfer (2012) [5] relax the assumption that investors have perfect foresight. Instead of selling the commodity at maximum prices, they assume that investors can only sell at its average price during [t,T]. The investors can lock in
( ) 1
,
T t T
S
t T u
u t
M S
−
=
=
∏
(9)When maturity, he can buy back the same amount of commodity at price ST. By doing so, he earns
(
,)
max 0,Mt TS −ST . This is equivalent to the payoff structure of a geometric average floating strike Asian put option. Arbitrage free pricing theory suggests that the time t value of the option is given by
( )
(
)
, er T t max 0,
S S
t t T T
PV = − − E M −S (10)
3. Convenience Yield Modeling Via Asian Options with Mean-Reverting Price
The option-based approaches introduced by Heaney (2002) [4] and Hochradl and Rammerstorfer (2012) [5] as-sume that the price of both the spot price and futures price follow a geometric Brownian motion. If the spot price is higher than the long term mean price, the outside supplies will enter this market, making the price drop. If the commodity price is lower than the long term mean price, the manufactures with high production costs will exit the market, making the price rise. The empirical evidence in Bessembinder, Coughenour and Seguin (1995) [7] and Pindyck (2001) [8] show that the commodity prices mean revert. In addition, Hochradl and Rammerstorfer (2012) [5] ignore the reinvestment proceeds after the investors sell the commodity. In this section, we assume the investor can only earn the medium proceeds by selling the inventory at the geometric average price and in-vesting the proceeds at the risk free rate. Thus, we approximate the convenience yields with the geometric mean Asian option with the investment proceeds at the risk free rate.Schwartz (1997) [9] assumes the commodity price has the following dynamics,
(
)
d
ln d d t
t t
t
S
k S t w
S = µ− +σ (11)
Define Xt =lnSt, we have dXt =k a
(
−Xt)
dt+σdwt, where2
2
a
k
σ
µ
= − is the long run mean of the log- Price, k
( )
>0 denotes the speed of adjustment.We assume that the investors can only earn the medium proceeds by selling the inventory and investing the proceeds at the rate d (To incorporate the results without the reinvestment proceeds, we assume the profit mak-ing from sellmak-ing the inventory is reinvested with rate of interest d). For simplicity, we assume the investor sell the inventory at the middle time. By doing so, the investor can lock the profit at time t,
( )
(
)
, e r T t max 0,
S Q S
t t T T t
PV = − − E M −S F (12) where
( ) ( ) 1
2
, e
T t T
d T t S
t T u
u t
M S
− −
=
=
∏
.The cash flows at maturity are similar to the payoff structure of a geometric-mean floating strike Asian put option. Careful calculation shows that the payoff structure is different from the geometric-mean floating strike Asian put option as indicated in Hochradl and Rammerstorfer (2012) [5].
We consider a more general case
(
)
d
ln d d t
t t
t
S
k b S t w
S = µ− +σ (13)
If b=0, the above equation is a geometric Brownian motion equation; If b=1, the above equation is the same as Equation (5); If d =0, this is the case without reinvestment.
Define Xt =lnSt, we have
(
)
dXt =k a−bXt dt+σdwt (14) Let
i
i t
S =S denote the price of underlying assets at the ith observation date ti with 0= < <t0 t1 < =tn T.
For simplicity, we set ti−ti−1= =h T n, i=1, 2,, .n
At time 0,
(
)
0 e max 0,
S rT Q S
T T
PV = − E M −S (15)
1 2 0,
1 e n T
S S Td
T T u
u
M M S
=
= =
∏
(16)The main task is to derive an analytical formula for the convenience yield.
writ-ten on St is
/ 2 e
S A G G
o
A A
PV = + +Σ NΣ + −e N
Σ Σ
, (17)
where
(
)
(
)
(
)
(
)
2
0
2 2
e 1 e e 1 e e 1 e
1 ln
2
1 e 1 e 1 e
1 e ,
2 2
kbh kbT kbT kbh kbT kbh kbT
kbT
kbh kbh kbh
kbT
a e
A S e
b n nkb
T d kb
σ
σ
− − − − −
−
− −
−
− − −
= − − + −
− − −
− − +
(
)
2 2
2 2 2 2
0 2
1
2 1
1 e ln e , e e
4 2
n
kbT kbT kbih kbT
i
a a i
G S rT
b kb b kb n
σ − − σ − −
=
−
= + − + − − Σ = +
∑
Proof. See the Technical Appendix. The explicit formula for S
t
PV allows us to compute convenience yields by applying the same logic as Equa-tions (6)-(8).
In Proposition 1, if we set b=0, Equation (13) is a geometric Brownian motion equation; If we set the reinvestment proceeds is zero further, Equation (13) is the case in Hochradl and Rammerstorfer (2012) [5]; If we set the reinvestment proceeds is the risk free rate, Equation (13) is the case in Hochradl and Rammerstorfer (2012) [5] with the reinvestment. In the following empirical study, we set b=1, d=r.
4. Empirical Analysis
To compare the statistical properties of different convenience yield approximation approaches, we use soybean meal futures in Dalian Commodity Exchange and strong wheat futures in Zhengzhou Commodity Exchange in China. The two futures have typical representativeness with large trading volume and good liquidity.
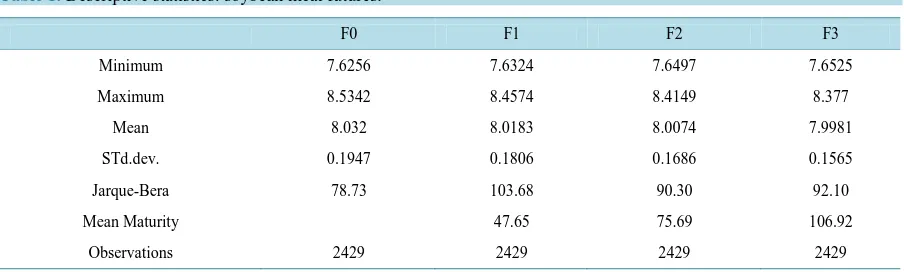
The sample consists of daily observations from January 4th, 2005 to December 31st, 2014. The futures price series are constructed using consecutive futures contracts. We denote the logarithm of futures price series with less than 1 month as F0. The logarithm of futures price series with maturities ranging from 1 to 3 months are si-milarly denoted as F1, F2, F3. We use F0 and one year benchmark lending rate to represent the logarithm of spot price and the risk free interest rate.
The data comes from Wind database and is summarized in Table 1 and Table 2.
To compare the different methods to estimate the convenience yields, we need to approximate the conveni-ence yields using the different methods. Take the new method, for example, we need to estimate the parameters of the mean reverting process. Maximum likelihood techniques can be used. Then, the present value of the op-tion is calculated for the spot and futures price. At last, the convenience yields can be approximated by proce-dure as in Equations (6)-(8).
[image:5.595.87.539.582.718.2]The differences about the structural properties of the approximation measures have been discussed in Dockner, Eksi and Rammerstorfer (2015) [10]. The traditional approach requires data for inventory costs, while the option-
Table 1.Descriptive statistics: soybean meal futures.
F0 F1 F2 F3
Minimum 7.6256 7.6324 7.6497 7.6525
Maximum 8.5342 8.4574 8.4149 8.377
Mean 8.032 8.0183 8.0074 7.9981
STd.dev. 0.1947 0.1806 0.1686 0.1565
Jarque-Bera 78.73 103.68 90.30 92.10
Mean Maturity 47.65 75.69 106.92
based approaches require the estimation of the spot and futures prices.
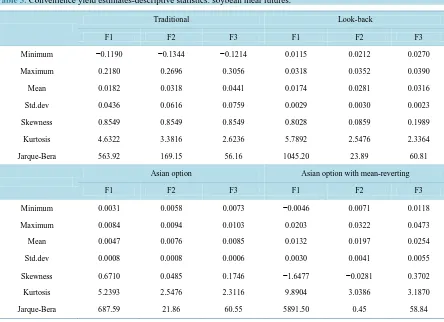
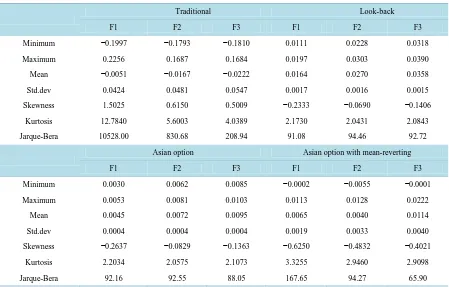
[image:6.595.87.539.239.384.2]Descriptive statistics for traditional yield estimates are presented in the upper left corners of Table 3 and Ta-ble 4. For strong wheat futures, the convenience yields are negative and decreasing with an increase in maturity. The carry costs of commodities are increasing with an increase in maturity, which leads to the decrease in con-venience yields. For soybean meal futures, we have the opposite result. The concon-venience yields are positive and increasing with an increase in maturity. The price spreads between spot and futures prices are always large with a long maturity, which leads to the increase in convenience yields. This property is the well-known length of pe-riod effect. The results show that the storage costs are the main factor influencing the convenience yields of strong wheat futures, while the length of period effect is the main factor influencing the convenience yields of soybean meal futures. In addition, the fact that the standard deviations of the convenience yields are increasing with the maturity shows the uncertainties of prices with a long maturity.
Table 2.Descriptive statistics: strong wheat futures.
F0 F1 F2 F3
Minimum 7.2298 7.2944 7.3278 7.3434
Maximum 8.0027 7.9732 7.9721 8.0320
Mean 7.6501 7.6697 7.6910 7.7062
STd.dev. 0.1974 0.1926 0.1875 0.1877
Jarque-Bera 154.77 183.69 191.05 192.92
Mean Maturity 60.01 100.57 140.81
Observations 2417 2417 2417 2417
Table 3.Convenience yield estimates-descriptive statistics: soybean meal futures.
Traditional Look-back
F1 F2 F3 F1 F2 F3
Minimum −0.1190 −0.1344 −0.1214 0.0115 0.0212 0.0270
Maximum 0.2180 0.2696 0.3056 0.0318 0.0352 0.0390
Mean 0.0182 0.0318 0.0441 0.0174 0.0281 0.0316
Std.dev 0.0436 0.0616 0.0759 0.0029 0.0030 0.0023
Skewness 0.8549 0.8549 0.8549 0.8028 0.0859 0.1989
Kurtosis 4.6322 3.3816 2.6236 5.7892 2.5476 2.3364
Jarque-Bera 563.92 169.15 56.16 1045.20 23.89 60.81
Asian option Asian option with mean-reverting
F1 F2 F3 F1 F2 F3
Minimum 0.0031 0.0058 0.0073 −0.0046 0.0071 0.0118
Maximum 0.0084 0.0094 0.0103 0.0203 0.0322 0.0473
Mean 0.0047 0.0076 0.0085 0.0132 0.0197 0.0254
Std.dev 0.0008 0.0008 0.0006 0.0030 0.0041 0.0055
Skewness 0.6710 0.0485 0.1746 −1.6477 −0.0281 0.3702
Kurtosis 5.2393 2.5476 2.3116 9.8904 3.0386 3.1870
[image:6.595.91.535.399.721.2]Table 4.Convenience yield estimates-descriptive statistics: strong wheat futures.
Traditional Look-back
F1 F2 F3 F1 F2 F3
Minimum −0.1997 −0.1793 −0.1810 0.0111 0.0228 0.0318
Maximum 0.2256 0.1687 0.1684 0.0197 0.0303 0.0390
Mean −0.0051 −0.0167 −0.0222 0.0164 0.0270 0.0358
Std.dev 0.0424 0.0481 0.0547 0.0017 0.0016 0.0015
Skewness 1.5025 0.6150 0.5009 −0.2333 −0.0690 −0.1406
Kurtosis 12.7840 5.6003 4.0389 2.1730 2.0431 2.0843
Jarque-Bera 10528.00 830.68 208.94 91.08 94.46 92.72
Asian option Asian option with mean-reverting
F1 F2 F3 F1 F2 F3
Minimum 0.0030 0.0062 0.0085 −0.0002 −0.0055 −0.0001
Maximum 0.0053 0.0081 0.0103 0.0113 0.0128 0.0222
Mean 0.0045 0.0072 0.0095 0.0065 0.0040 0.0114
Std.dev 0.0004 0.0004 0.0004 0.0019 0.0033 0.0040
Skewness −0.2637 −0.0829 −0.1363 −0.6250 −0.4832 −0.4021
Kurtosis 2.2034 2.0575 2.1073 3.3255 2.9460 2.9098
Jarque-Bera 92.16 92.55 88.05 167.65 94.27 65.90
Descriptive statistics for estimates using look-back options and Asian options are presented in Table 3 and Table 4. The estimates using Asian options are lower than using look-back options, which arise from the struc-tural properties of the options. It is noted that there are no obvious trends for standard deviations. The estimates can’t reflect the fact that the uncertainties increase with an increase in maturity, which makes the two op-tion-based approaches are not fit for approximating convenience yields.
Descriptive statistics for estimates using Asian options with mean-reverting price dynamics are presented in Table 3 and Table 4. The estimates of convenience yields are similar to the ones using the traditional approach-es. It’s worth noting that the standard deviations of the convenience yields are increasing with the maturity. So, the new method is a better way to approximate the convenience yields. Although new method takes the reinvest proceeds into account, the different modeling of the price process makes the comparison of estimates impossible. Even though, most of the estimates using mean reverting prices are larger than the estimates using Asian op-tions.
5. Concluding Remarks
In this paper, unlike the assumption of geometric Brownian motion in the existing literature, we assume that the price of commodity follows a mean-reverting price process. Under this assumption, we derive an analytical convenience yield approximation. We use the soybean meal and strong wheat futures to compare the new ap-proximation with the existing apap-proximations. Empirical study shows that the new method with the mean-re- verting price process is a better approximation for convenience yields.
References
[1] Kaldor, N. (1939) Speculation and Economic Stability. The Review of Economic Studies, 7, 1-27.
http://dx.doi.org/10.2307/2967593
[2] Brennan, M.J. (1958) The Supply of Storage. The American Economic Review, 48, 50-72.
[3] Longstaff, F.A. (1995) How Much can Marketability Affect Security Values? The Journal of Finance, 50, 1767-1774.
[4] Heaney, R. (2002) Approximation for Convenience Yield in Commodity Futures Pricing. Journal of Futures Markets,
22, 1005-1017. http://dx.doi.org/10.1002/fut.10036
[5] Hochradl, M. and Rammerstorfer, M. (2012) The Convenience Yield Implied in European Natural Gas Hub Trading.
Journal of Futures Markets, 32, 459-479. http://dx.doi.org/10.1002/fut.20523
[6] Lévy, E. (1997) Exotic Options: The State of the Art. Les Clewlow, Chris Strickland. International Thomson Business
Press, London.
[7] Bessembinder, H, Coughenour, J.F. and Seguin, P.J. (1995) Mean Reversion in Equilibrium Asset Prices: Evidence
from the Futures Term Structure. The Journal of Finance, 50, 361-375.
http://dx.doi.org/10.1111/j.1540-6261.1995.tb05178.x
[8] Pindyck, R.S. (2001) The Dynamics of Commodity Spot and Futures Markets: A Primer. The Energy Journal, 22, 1-29.
http://dx.doi.org/10.5547/issn0195-6574-ej-vol22-no3-1
[9] Schwartz, E.S. (1997) The Stochastic Behavior of Commodity Prices: Implication for Valuation and Hedging. The
Journal of Finance, 52, 923-973. http://dx.doi.org/10.1111/j.1540-6261.1997.tb02721.x
[10] Dockner, E.J., Eksi, Z. and Rammerstorfer, M. (2015) A Convenience Yield Approximation Model for Mean-Revert-
Appendix
By the Ito’s Lemma, from (14), we have
( )
0 e 0e d
t kb t u kbt
t u
a a
X X w
b b
σ
− − −
= + − +
∫
(18)Set
θ
( )
t = −σ
e−kb T t( −) and( )
( ) ( ) 2 0 0 1 d d 2 e t t uu w u u
Z t = −∫θ − ∫θ , we can define a new probability measure
( )
( )
ˆ d ,
A
P A =
∫
Z T P ∀ ∈A FBy Girsanov’s theorem,
( )
0
ˆt t t d
w =w −
∫
θ u u is a Winner process under the new probability measure ˆP. The risk-neutral pricing formula gives(
)
0 e max 0,
ˆ
e 1 e 1
S rT S
T T
S S
rT T rT T T
T
T T
PV E M S
M S M
E S E
S Z S
− + + − − = − = − = − (19)
where Eˆ
[ ]
⋅ denotes the expectation under the probability measure ˆP.For simplicity, we use the same notation of S X Mt, t, T under the probability measure P and ˆP. Next, we compute X Mt, T,Z T
( )
under the new measure ˆP.Insertion of
( )
0
ˆ t d
t t
w =w +
∫
θ u u into (18) and Z T( )
yields( ) ( )
2 2
0 e e 0e d 0e dˆ
t t
kb T t kb t u
kbt kbu
t u
a a
X X u w
b b
σ
σ
− + − −
−
= + − + +
∫
∫
(20)( )
2 2 ( ) ( )0 0
1
ˆ
ln e d e d
2
T kb T u T kb T u u
Z T =
∫
σ − − u+∫
σ − − w (21) It follows that( ) ( )
( )
1
2 2
0 0 0
1 1 1
2 2 2
0 0 0
1
1 1 ln ln
2
1 1 1
ˆ
e e e d e d
ˆ
e e e d e d
1 1 1 . i i i i i n
T T i n
i
n n t n t
kb T t kb t u
kbt kbu
u
i i i
T T kb T u
kbT kbT ku
u
n
i n
i
T
M S X X d
n a
X u w
b n n n
a
X u w
b
A I I
n n σ σ σ σ σ σ = − + − − − = = = − − − − − = − = − + = − + + − − − − = + + −
∑
∑
∑
∫
∑
∫
∫
∫
∑
(22)(
)
(
)
(
)
( ) 2 2 2 0 0e 1 e e 1 e e 1 e
1 e
e 1 e ,
2 2 2
1 e 1 e 1 e
ˆ
e d
i i
kbh kbT kbT kbh kbT kbh kbT
kbT kbT
kbh kbh kbh
t kb t u
i u
a T
A X d
b n kbn kb
I w σ σ − − − − − − − − − − − − − − = − − + − − − + − − − =
∫
Note that Ii is an Ito integral,
1 1 1 1 1 n i n i I I n n
σ
−σ
=
+ −
∑
obeys normal distribution with mean 0 and variance 2Σ . Denote i∧ =j min ,
( )
i j , we have(
)
(
)
1(
2)
cov , cov , 1 e
2
i j kbt i j i j i j
I I I I
kb
∧ −
∧ ∧
= = − , and cov
(
1, 2, ,)
1(
)
2 n
I I I E H
kb
= −
where E is a matrix with 1, and
( )
i j,n n
(
)
1 2
1
T 2
2
2 2
2 1
1 1
cov 1
1 1 1 1 1 1 1 1
, , , , 1 , , , , 1
2
2 1
e e
2
n
i n
i
n
kbih kbT
i
I I
n n
E H
kb n n n n n n n n
i
kb n
σ σ
σ σ
−
=
− −
=
Σ = + −
= − − −
−
= +
∑
∑
It is evident that lnMT−lnST ~N A
(
,Σ2)
. From (15),(
)
22 2 2
2 0
2 2 2
1 ˆ
e 1 e e 1 e d
2π
e e d e e d e e
z
S G T G A z
T
z z
z A G
A G G G
A A
M
PV E z
S
A A
z z N N
+
− + +∞ +Σ −∞
Σ
Σ − − + +
+∞ +∞
+
− −
Σ Σ
= − = −
= − = Σ + −
Σ Σ